| Param | Original file | Final file |
|---|---|---|
| Filename | modeM0/AS1G07_057T02_9000001504_10400cztM0_level2.evt | modeM0/AS1G07_057T02_9000001504_10400cztM0_level2_quad_clean.evt |
| Size (bytes) | 307,851,840 | 58,400,640 |
| Size | 293.6 MB | 55.7 MB |
| Events in quadrant A | 2,115,701 | 414,690 |
| Events in quadrant B | 2,232,237 | 338,951 |
| Events in quadrant C | 2,093,355 | 345,894 |
| Events in quadrant D | 2,561,339 | 340,003 |
| Mode M0 | |||
|---|---|---|---|
| Quadrant | BADHDUFLAG | Total packets | Discarded packets |
| A | 0 | 40482 | 30892 |
| B | 0 | 46642 | 36972 |
| C | 0 | 42122 | 32459 |
| D | 0 | 46171 | 35662 |
| Mode M9 | |||
|---|---|---|---|
| Quadrant | BADHDUFLAG | Total packets | Discarded packets |
| A | 0 | 18 | 14 |
| B | 0 | 18 | 14 |
| C | 0 | 18 | 14 |
| D | 0 | 17 | 14 |
| Mode SS | |||
|---|---|---|---|
| Quadrant | BADHDUFLAG | Total packets | Discarded packets |
| A | 0 | 415 | 330 |
| B | 0 | 412 | 322 |
| C | 0 | 414 | 312 |
| D | 0 | 402 | 309 |
| Quadrant | Total seconds | Saturated seconds | Saturation percentage |
|---|---|---|---|
| A | 4706 | 55 | 1.168721% |
| B | 4559 | 58 | 1.272209% |
| C | 4758 | 31 | 0.651534% |
| D | 4689 | 51 | 1.087652% |
Noise dominated data is calculated using 1-second bins in cleaned event files. If a bin has >2000 counts, and if more than 50% of those come from <1% of pixels, then it is considered to be noise-dominated and hence unusable.
| Quadrant | # 1 sec bins | Bins with >0 counts | Bins with >2000 counts | High rate bins dominated by noise | Noise dominated (total time) | Noise dominated (detector-on time) | Marked lightcurve |
|---|---|---|---|---|---|---|---|
| A | 11463 | 6470 | 0 | 0 | 0.00% | 0.00% | 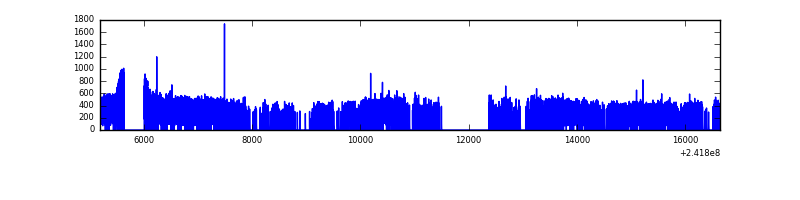 |
| B | 11462 | 6353 | 0 | 0 | 0.00% | 0.00% | 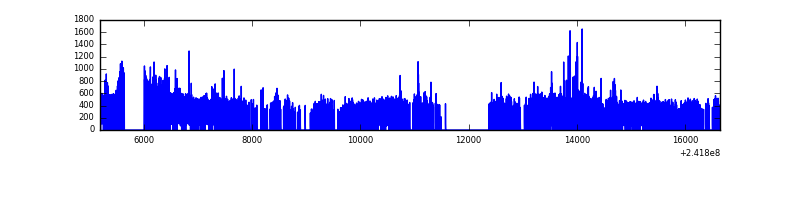 |
| C | 11456 | 6593 | 0 | 0 | 0.00% | 0.00% | 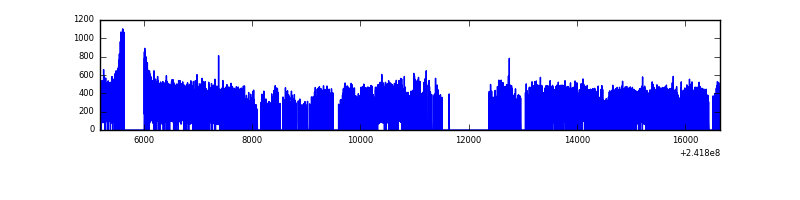 |
| D | 11459 | 6447 | 2 | 2 | 0.02% | 0.03% | 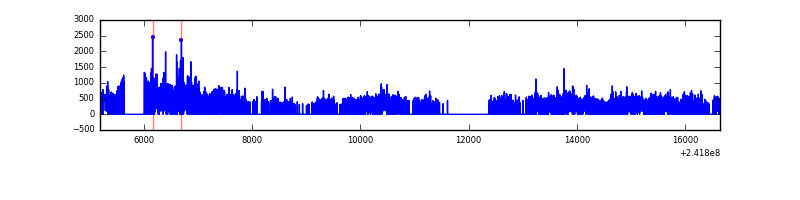 |
Top three noisy pixels from each quadrant. If the there are fewer than three noisy pixels in the level2.evt file, extra rows are filled as -1
| Pixel properties | Quadrant properties | ||||||
|---|---|---|---|---|---|---|---|
| Quadrant | DetID | PixID | Counts | Sigma | Mean | Median | Sigma |
| A | 15 | 174 | 6593 | 53.37 | 543 | 530 | 113.6 |
| A | 1 | 162 | 5207 | 41.17 | 543 | 530 | 113.6 |
| A | 13 | 253 | 4893 | 38.4 | 543 | 530 | 113.6 |
| B | 4 | 239 | 64226 | 623.15 | 527 | 514 | 102.2 |
| B | 11 | 51 | 56642 | 548.97 | 527 | 514 | 102.2 |
| B | 0 | 219 | 19318 | 183.92 | 527 | 514 | 102.2 |
| C | 13 | 61 | 4157 | 28.93 | 534 | 537 | 125.1 |
| C | 14 | 234 | 3889 | 26.79 | 534 | 537 | 125.1 |
| C | 14 | 67 | 3487 | 23.57 | 534 | 537 | 125.1 |
| D | 1 | 52 | 190707 | 1503.97 | 522 | 508 | 126.5 |
| D | 8 | 195 | 190153 | 1499.59 | 522 | 508 | 126.5 |
| D | 1 | 20 | 85031 | 668.35 | 522 | 508 | 126.5 |
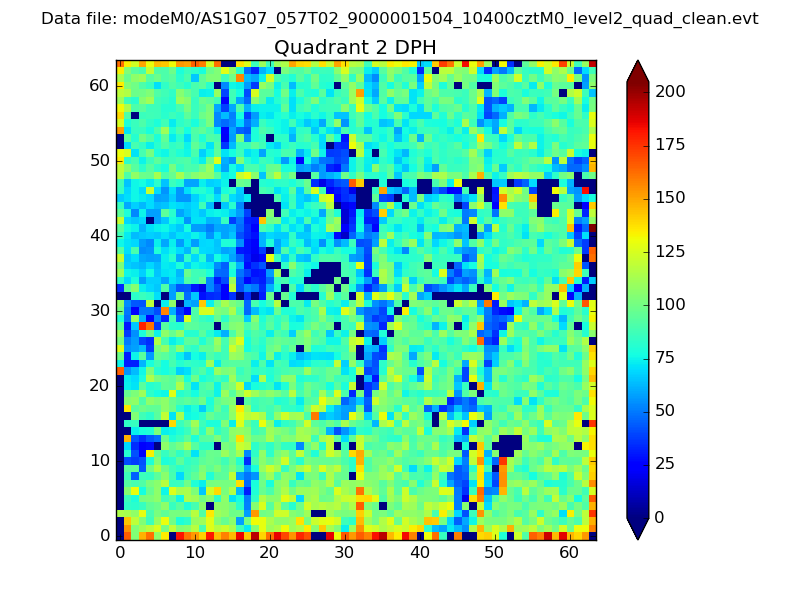
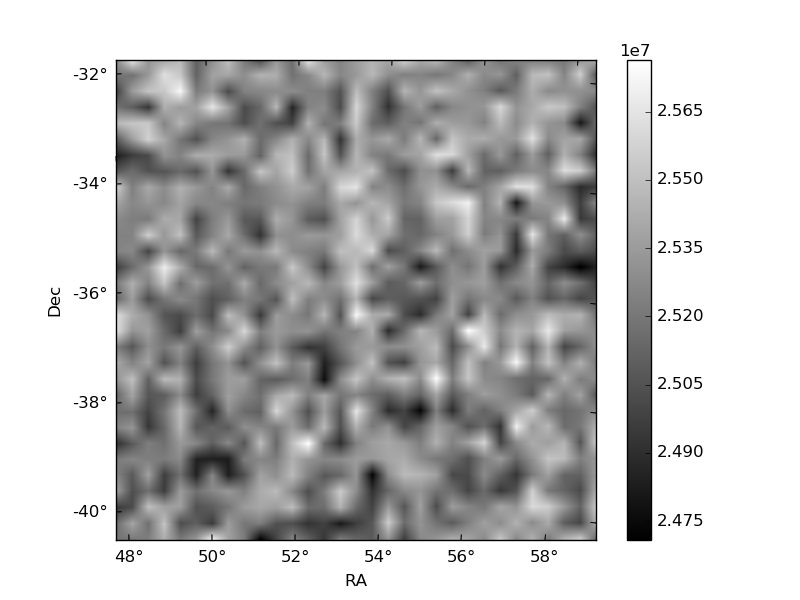
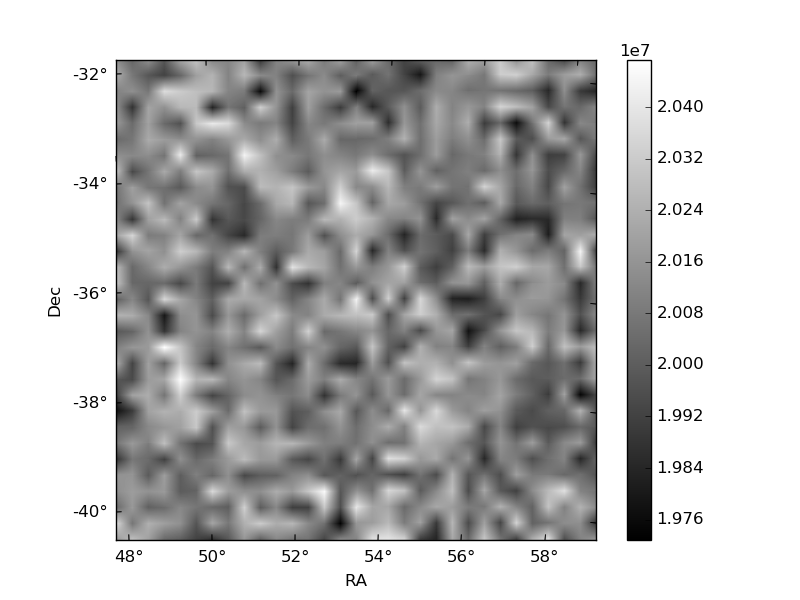
Histogram calculated using DETX and DETY for each event in the final _common_clean file
| Quadrant A | 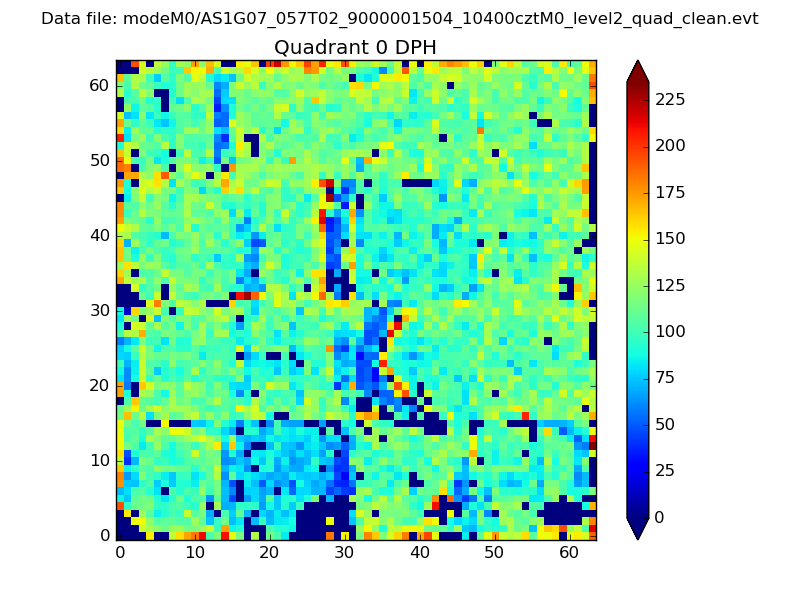 |
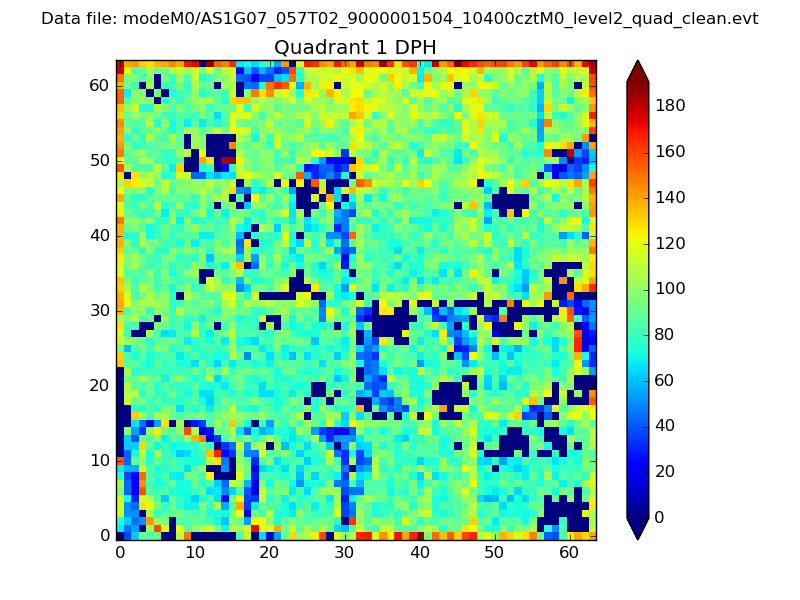 |
Quadrant B |
|---|---|---|---|
| Quadrant D | 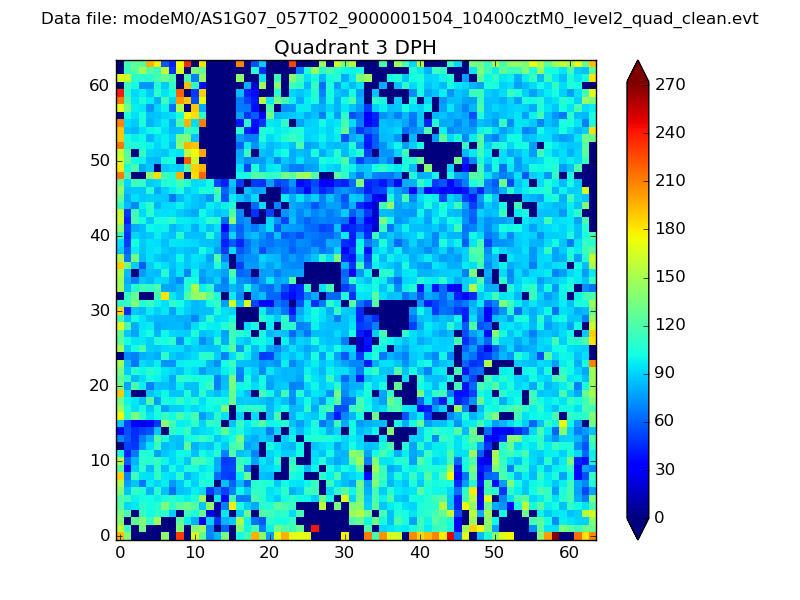 |
 |
Quadrant C |
| Plot type | Count rate plots | Images |
|---|---|---|
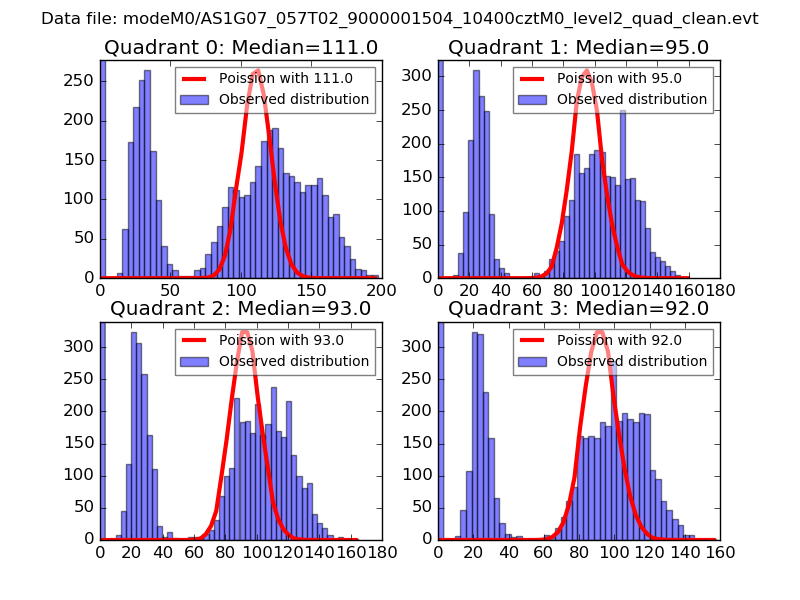
| Comparison with Poisson distribution Blue bars denote a histogram of data divided into 1 sec bins. Red curve is a Poisson curve with rate = median count rate of data. |
 |
 |
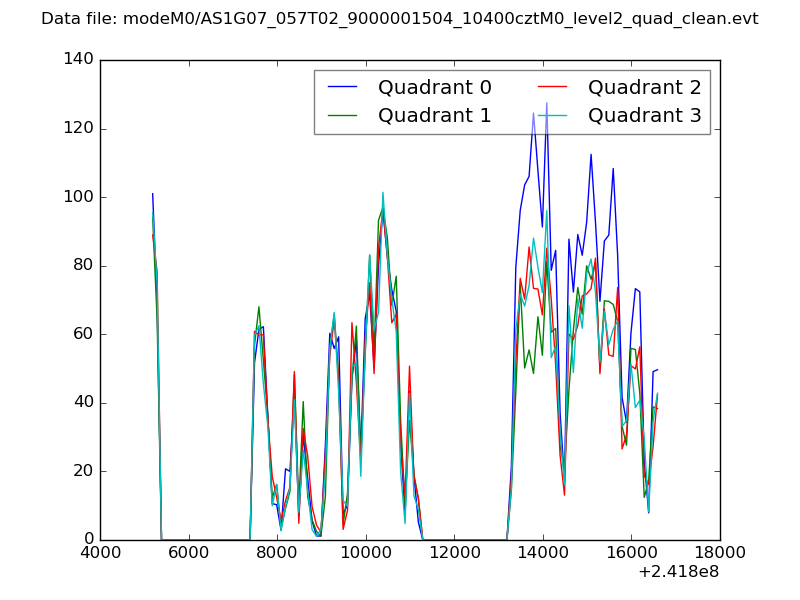
| Quadrant-wise count rates Data is divided into 100 sec bins |
 |
|
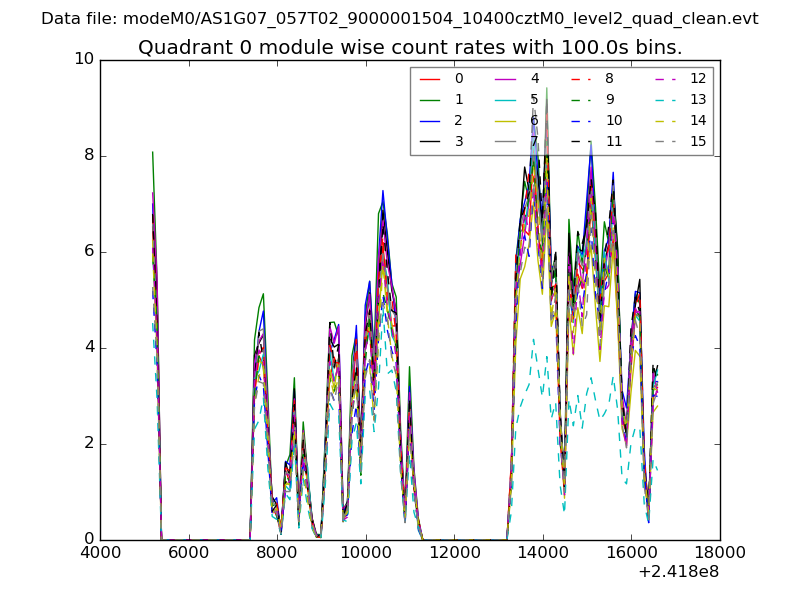
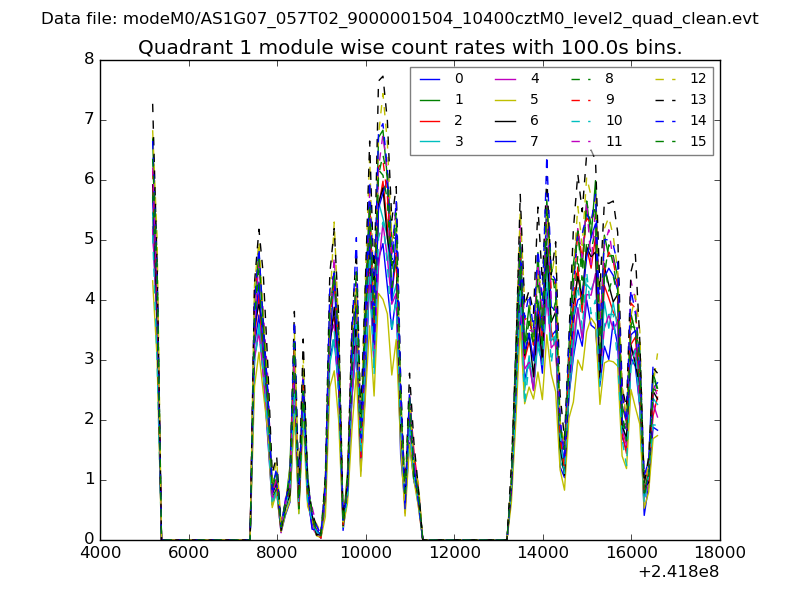
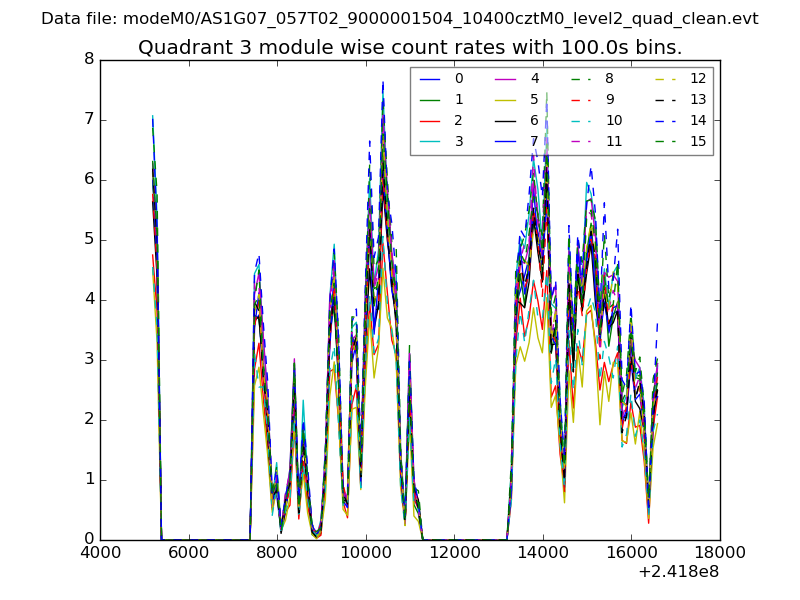
| Module-wise count rates for Quadrant A Data is divided into 100 sec bins |
 |
 |
| Module-wise count rates for Quadrant B Data is divided into 100 sec bins |
 |
 |
| Module-wise count rates for Quadrant C Data is divided into 100 sec bins |
 |
 |
| Module-wise count rates for Quadrant D Data is divided into 100 sec bins |
 |
 |
| Parameter | Plot |
|---|---|
| CZT HV Monitor | 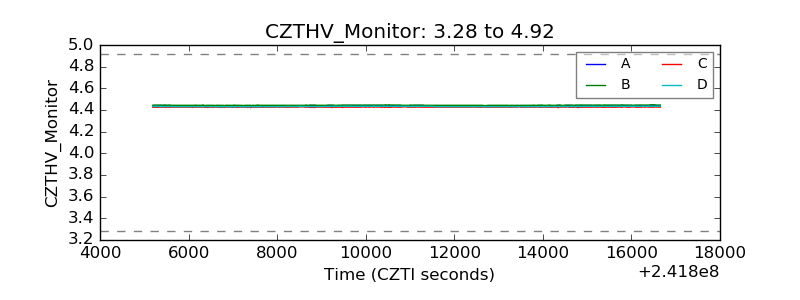 |
| D_VDD | 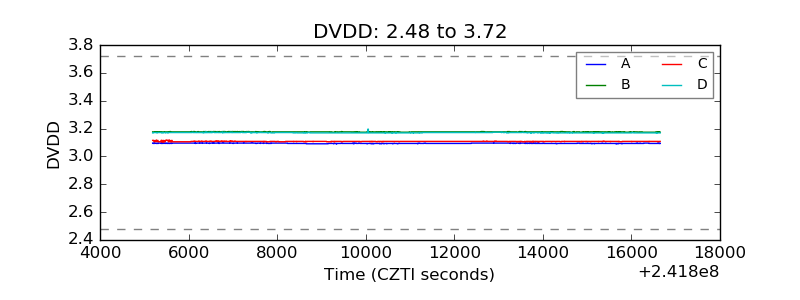 |
| Temperature 1 | 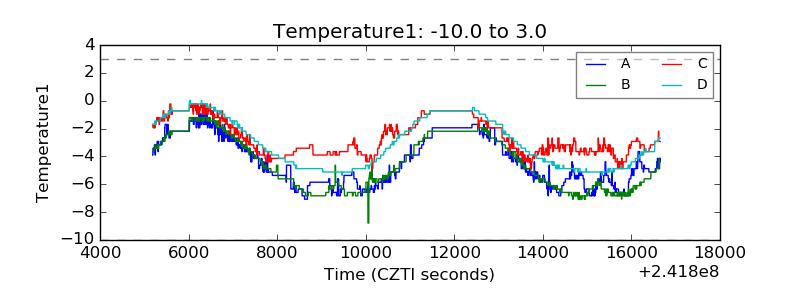 |
| Veto HV Monitor | 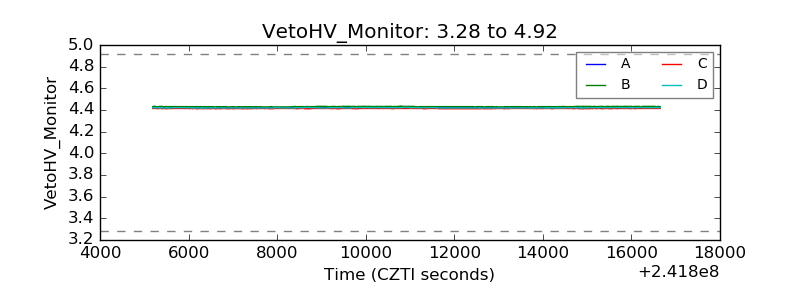 |
| Veto LLD | 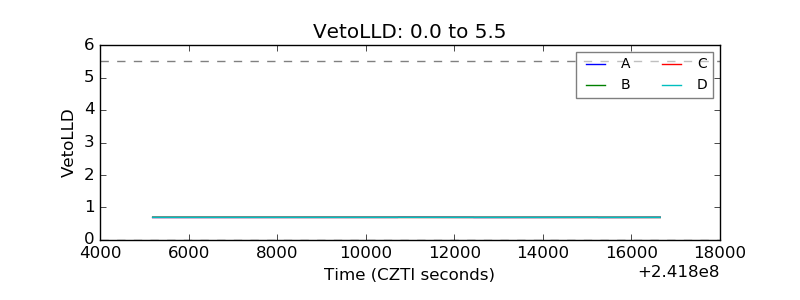 |
| Alpha Counter | 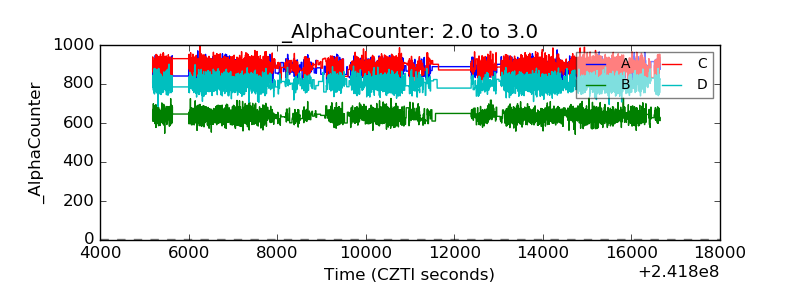 |
| _CPM_Rate | 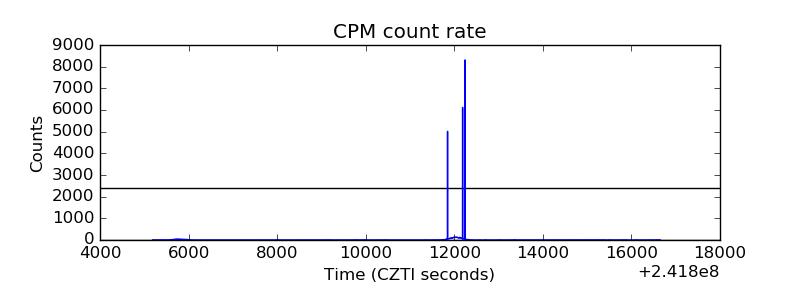 |
| CZT Counter | 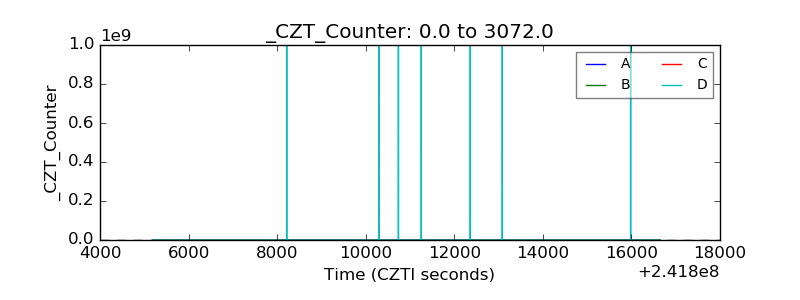 |
| +2.5 Volts monitor |  |
| +5 Volts monitor |  |
| _ROLL_ROT | 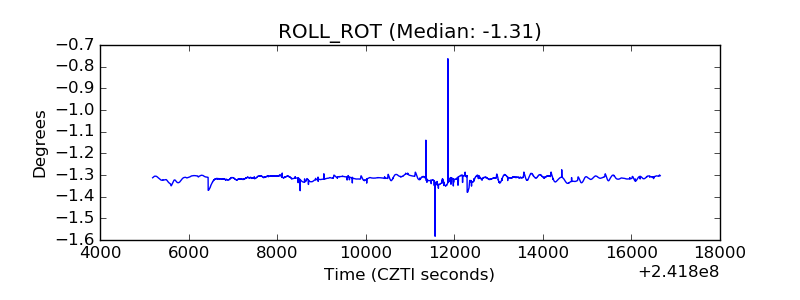 |
| _Roll_DEC | 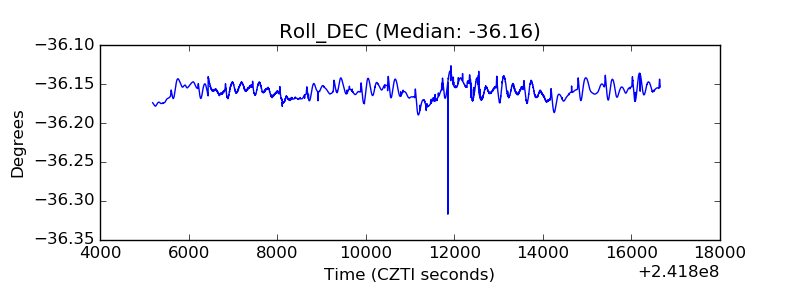 |
| _Roll_RA | 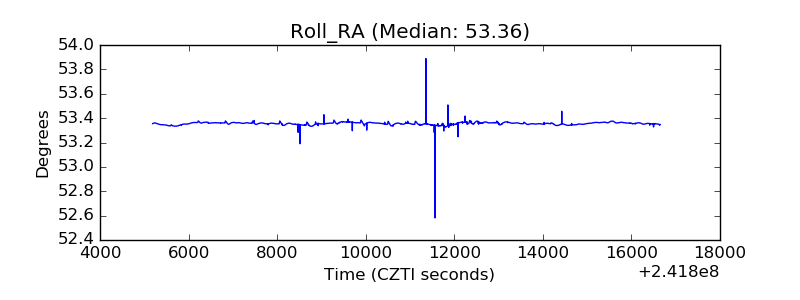 |
| Veto Counter | 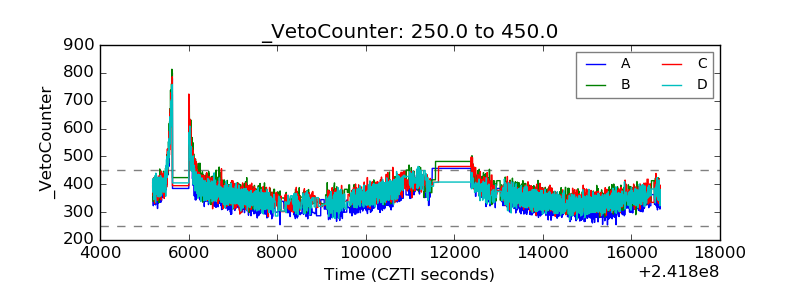 |