| Param | Original file | Final file |
|---|---|---|
| Filename | modeM0/AS1G07_057T02_9000001504_10401cztM0_level2.evt | modeM0/AS1G07_057T02_9000001504_10401cztM0_level2_quad_clean.evt |
| Size (bytes) | 603,768,960 | 114,868,800 |
| Size | 575.8 MB | 109.5 MB |
| Events in quadrant A | 4,012,553 | 723,428 |
| Events in quadrant B | 4,624,635 | 735,094 |
| Events in quadrant C | 3,978,038 | 726,124 |
| Events in quadrant D | 5,079,679 | 689,885 |
| Mode M0 | |||
|---|---|---|---|
| Quadrant | BADHDUFLAG | Total packets | Discarded packets |
| A | 0 | 17743 | 21 |
| B | 0 | 19621 | 27 |
| C | 0 | 17685 | 20 |
| D | 0 | 20678 | 22 |
| Mode M9 | |||
|---|---|---|---|
| Quadrant | BADHDUFLAG | Total packets | Discarded packets |
| A | 0 | 16 | 0 |
| B | 0 | 16 | 0 |
| C | 0 | 16 | 0 |
| D | 0 | 16 | 0 |
| Mode SS | |||
|---|---|---|---|
| Quadrant | BADHDUFLAG | Total packets | Discarded packets |
| A | 0 | 178 | 0 |
| B | 0 | 178 | 0 |
| C | 0 | 178 | 0 |
| D | 0 | 178 | 0 |
| Quadrant | Total seconds | Saturated seconds | Saturation percentage |
|---|---|---|---|
| A | 8707 | 32 | 0.367520% |
| B | 8704 | 156 | 1.792279% |
| C | 8707 | 15 | 0.172275% |
| D | 8708 | 51 | 0.585668% |
Noise dominated data is calculated using 1-second bins in cleaned event files. If a bin has >2000 counts, and if more than 50% of those come from <1% of pixels, then it is considered to be noise-dominated and hence unusable.
| Quadrant | # 1 sec bins | Bins with >0 counts | Bins with >2000 counts | High rate bins dominated by noise | Noise dominated (total time) | Noise dominated (detector-on time) | Marked lightcurve |
|---|---|---|---|---|---|---|---|
| A | 10356 | 8718 | 0 | 0 | 0.00% | 0.00% | 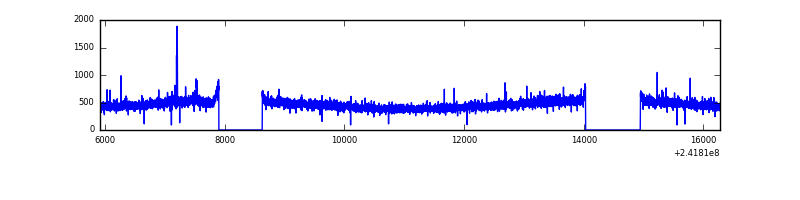 |
| B | 10356 | 8717 | 59 | 59 | 0.57% | 0.68% | 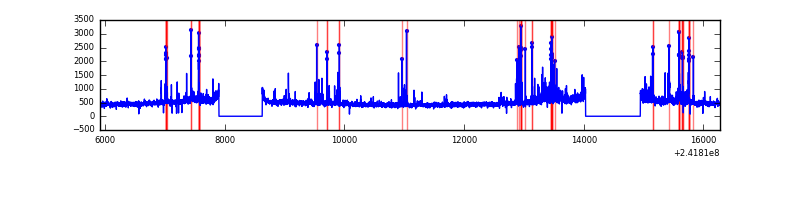 |
| C | 10356 | 8718 | 3 | 3 | 0.03% | 0.03% | 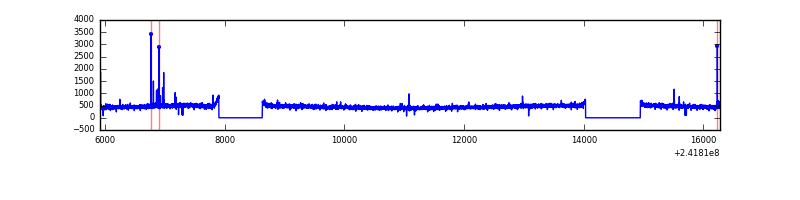 |
| D | 10356 | 8718 | 38 | 38 | 0.37% | 0.44% | 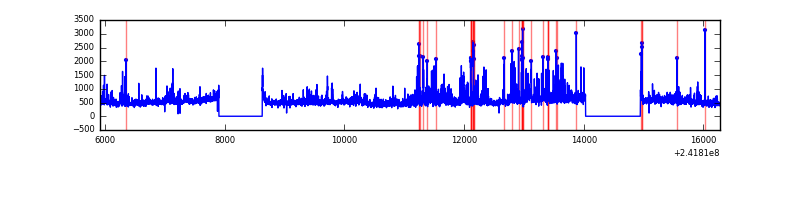 |
Top three noisy pixels from each quadrant. If the there are fewer than three noisy pixels in the level2.evt file, extra rows are filled as -1
| Pixel properties | Quadrant properties | ||||||
|---|---|---|---|---|---|---|---|
| Quadrant | DetID | PixID | Counts | Sigma | Mean | Median | Sigma |
| A | 15 | 174 | 18163 | 80.61 | 1033 | 1007 | 212.8 |
| A | 0 | 226 | 9430 | 39.58 | 1033 | 1007 | 212.8 |
| A | 12 | 194 | 8209 | 33.84 | 1033 | 1007 | 212.8 |
| B | 4 | 239 | 283599 | 1433.7 | 1030 | 1007 | 197.1 |
| B | 0 | 219 | 145480 | 732.97 | 1030 | 1007 | 197.1 |
| B | 11 | 51 | 94564 | 474.65 | 1030 | 1007 | 197.1 |
| C | 14 | 234 | 36879 | 154.1 | 1005 | 1012 | 232.7 |
| C | 8 | 128 | 11343 | 44.39 | 1005 | 1012 | 232.7 |
| C | 13 | 61 | 7563 | 28.15 | 1005 | 1012 | 232.7 |
| D | 1 | 20 | 351941 | 1465.07 | 998 | 971 | 239.6 |
| D | 8 | 195 | 298979 | 1243.99 | 998 | 971 | 239.6 |
| D | 13 | 122 | 267980 | 1114.59 | 998 | 971 | 239.6 |
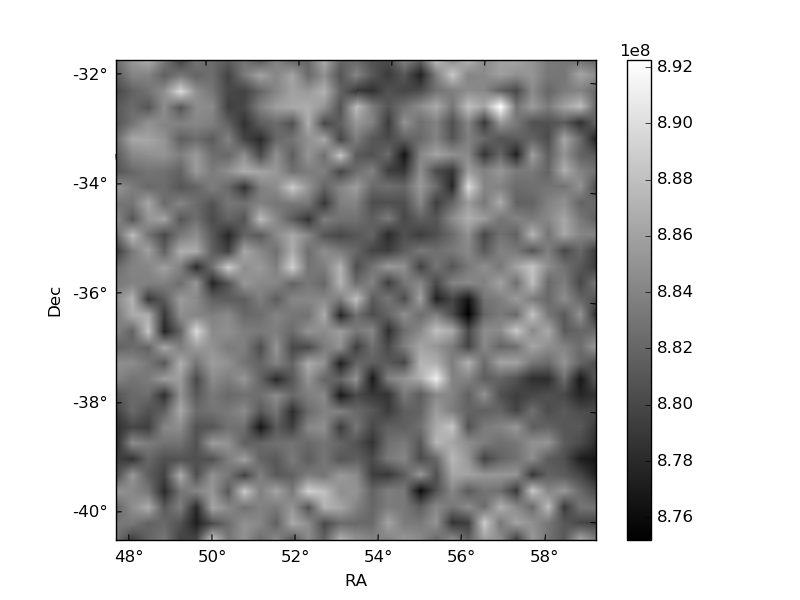
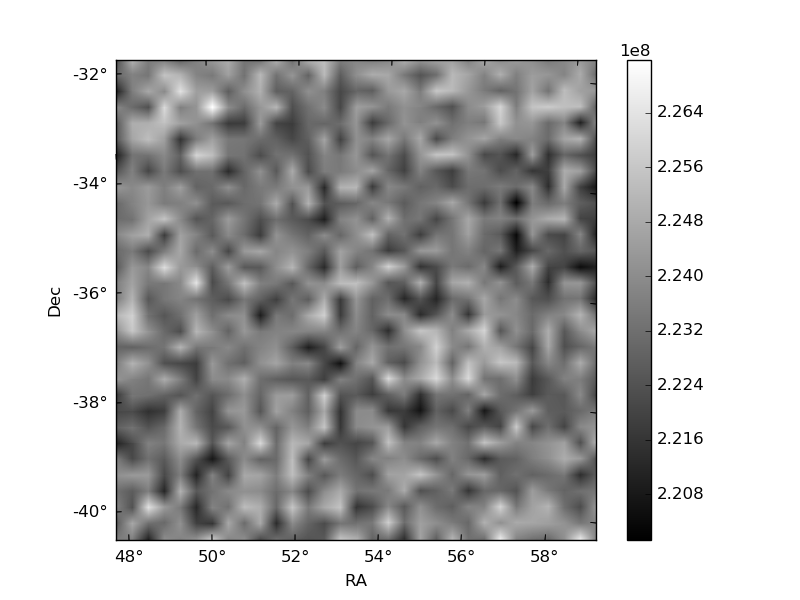
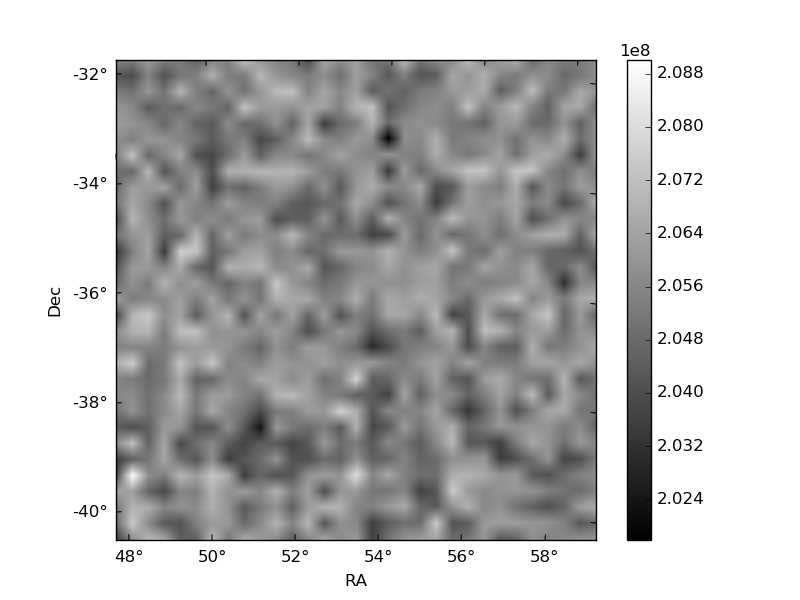
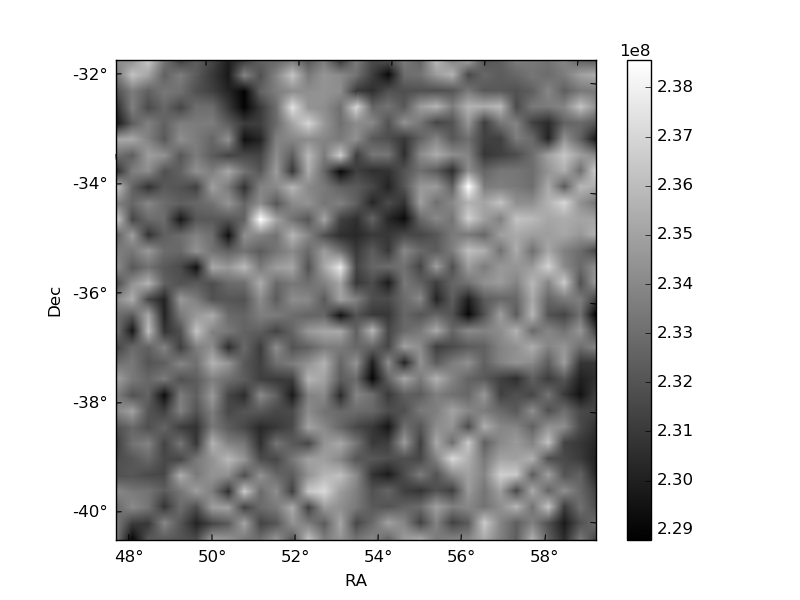
Histogram calculated using DETX and DETY for each event in the final _common_clean file
| Quadrant A | 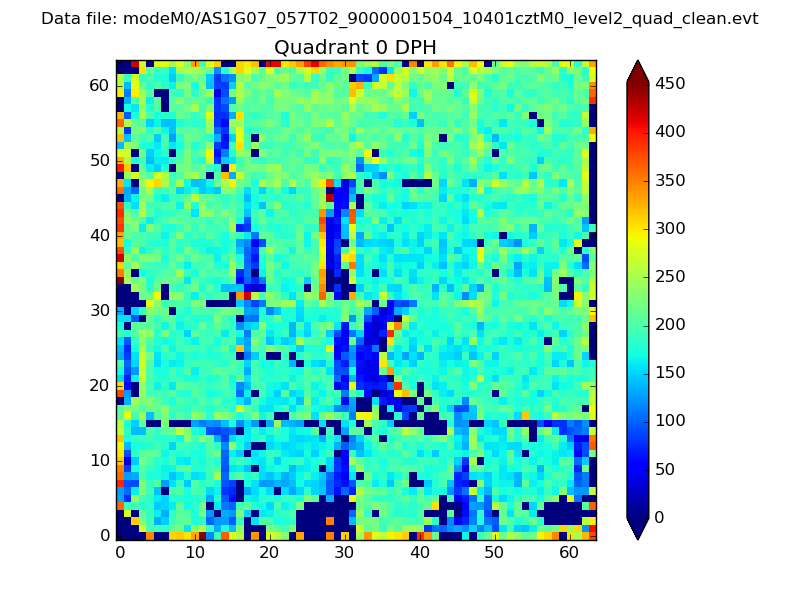 |
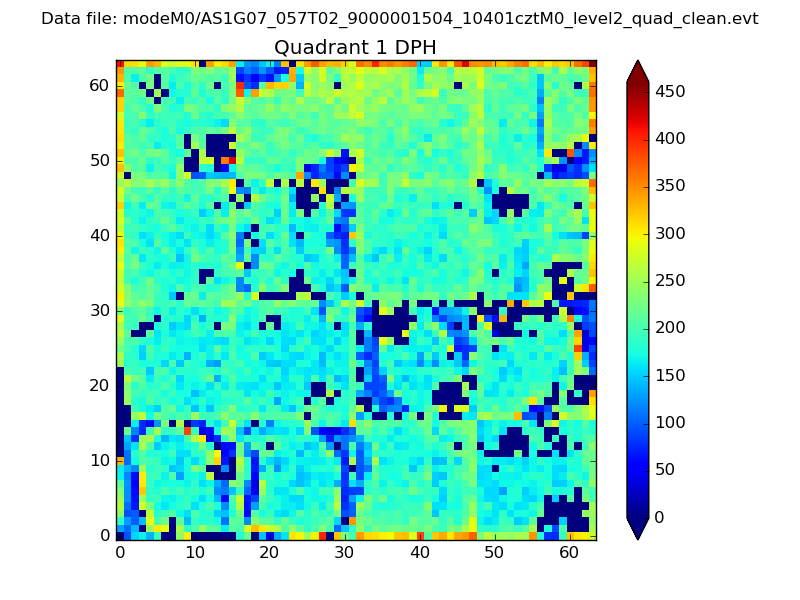 |
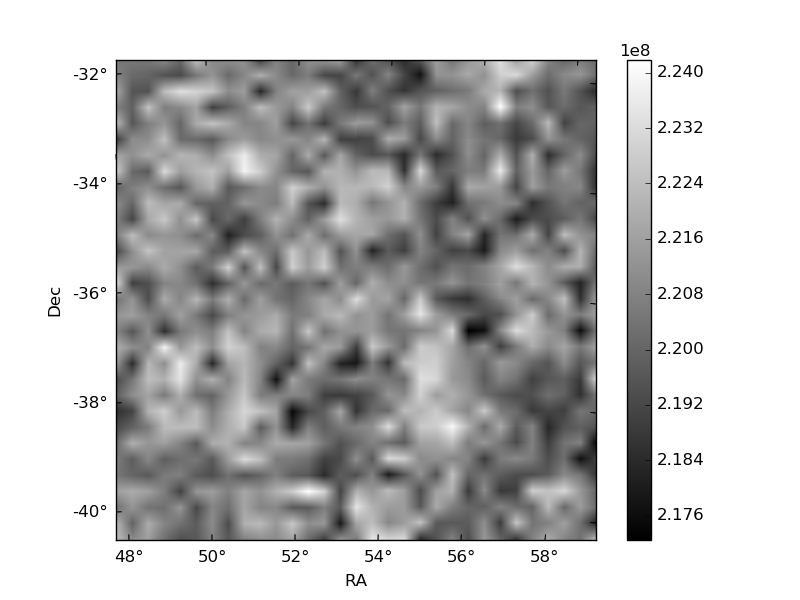
Quadrant B |
|---|---|---|---|
| Quadrant D | 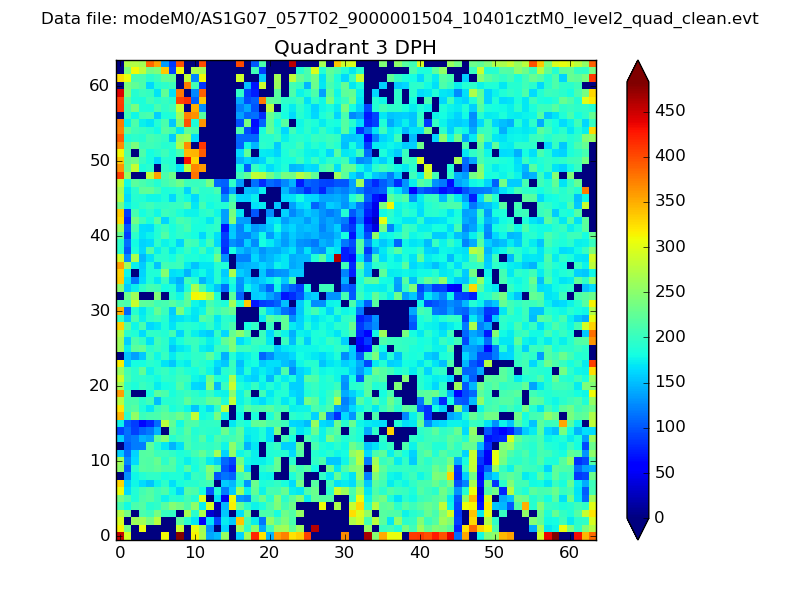 |
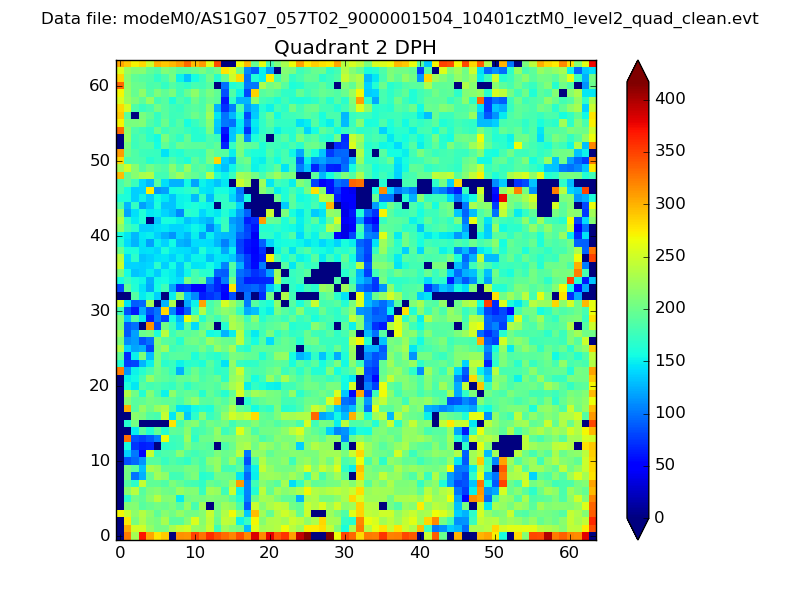 |
Quadrant C |
| Plot type | Count rate plots | Images |
|---|---|---|
| Comparison with Poisson distribution Blue bars denote a histogram of data divided into 1 sec bins. Red curve is a Poisson curve with rate = median count rate of data. |
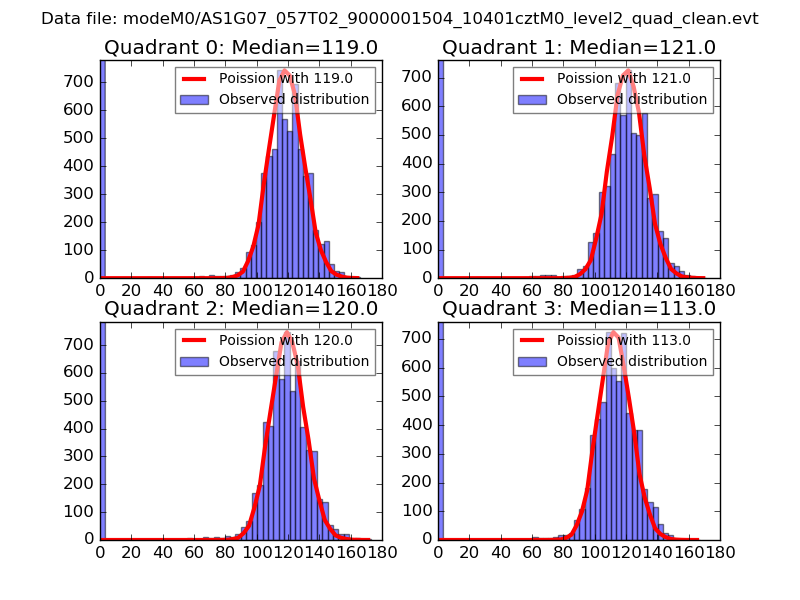 |
 |
| Quadrant-wise count rates Data is divided into 100 sec bins |
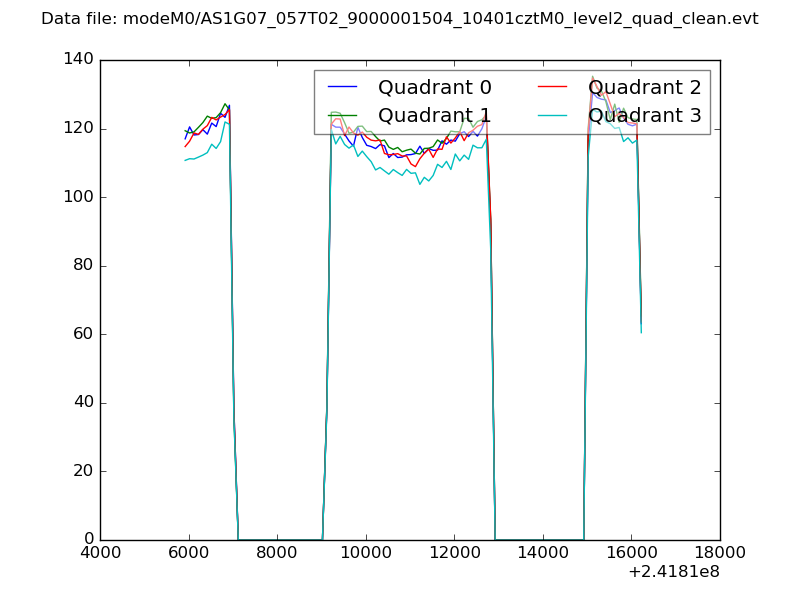 |
|
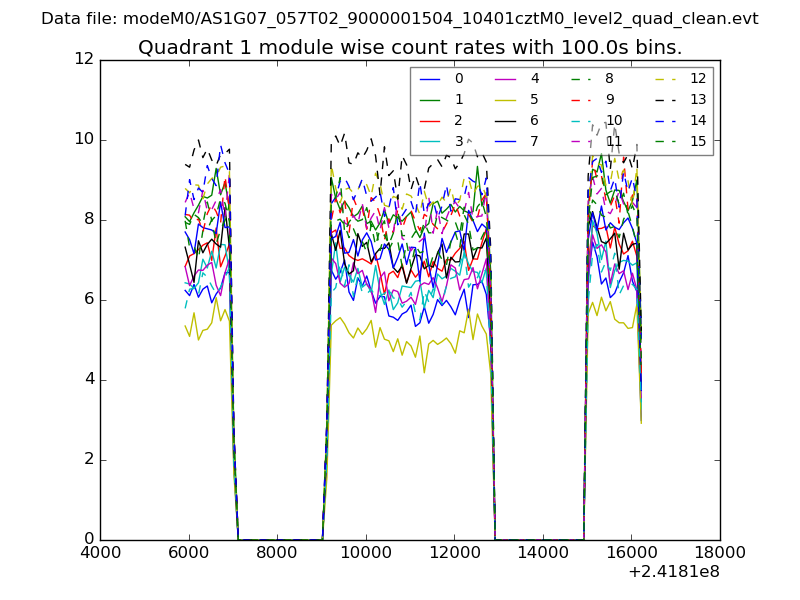
| Module-wise count rates for Quadrant A Data is divided into 100 sec bins |
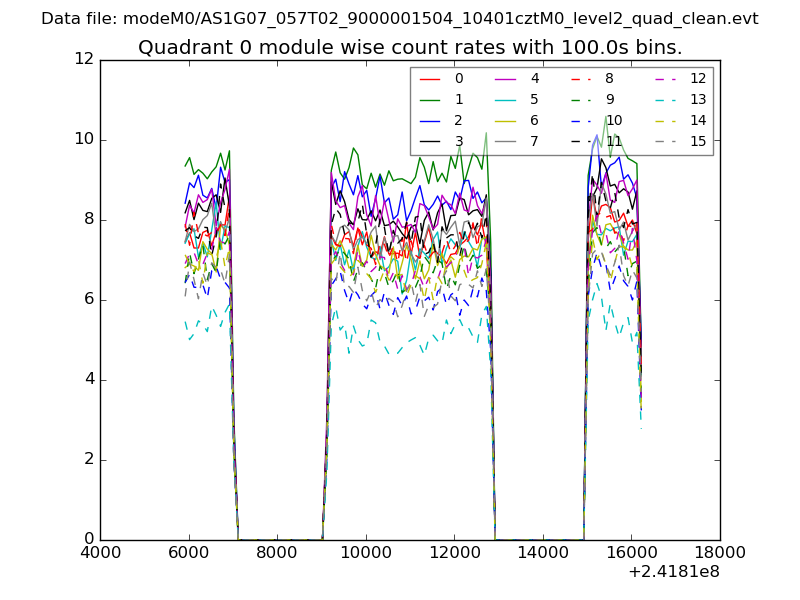 |
 |
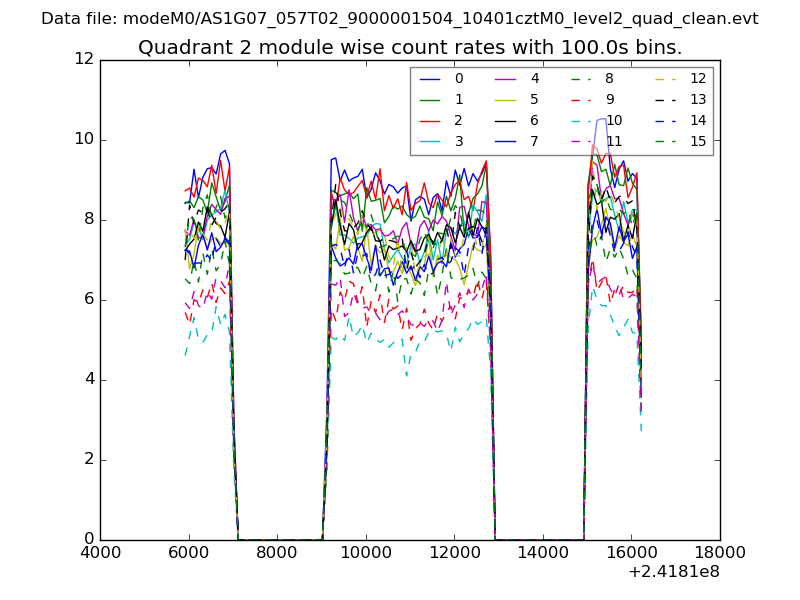
| Module-wise count rates for Quadrant B Data is divided into 100 sec bins |
 |
 |
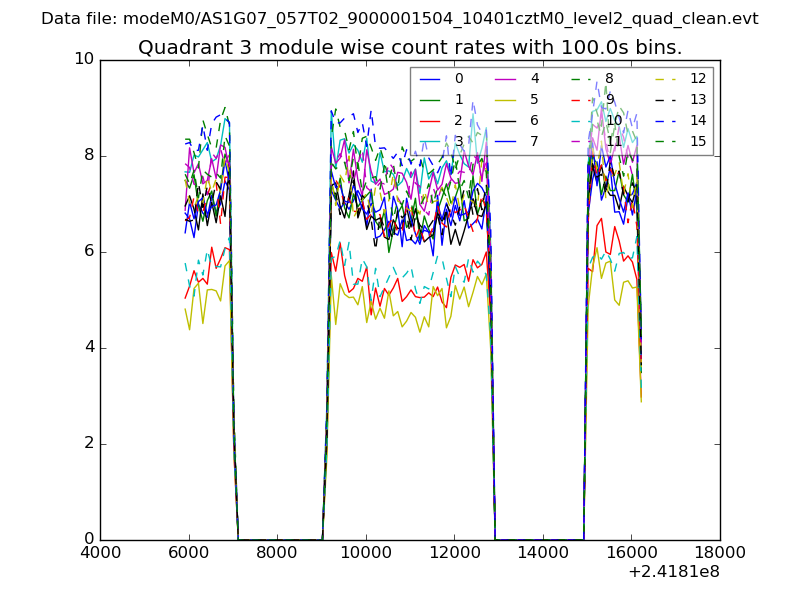
| Module-wise count rates for Quadrant C Data is divided into 100 sec bins |
 |
 |
| Module-wise count rates for Quadrant D Data is divided into 100 sec bins |
 |
 |
| Parameter | Plot |
|---|---|
| CZT HV Monitor | 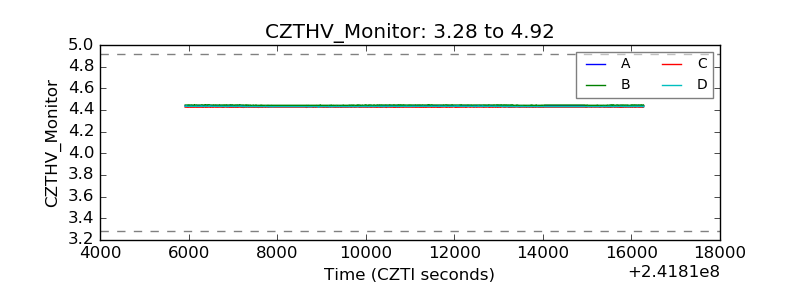 |
| D_VDD | 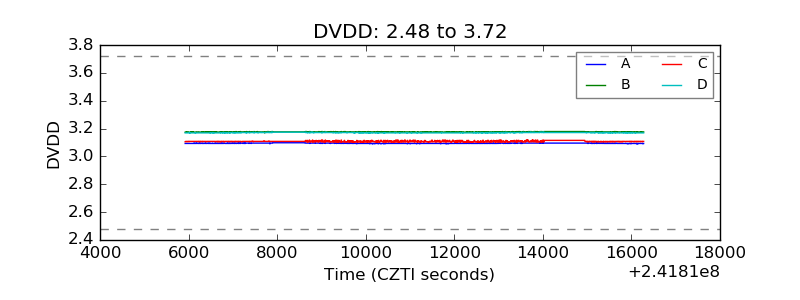 |
| Temperature 1 | 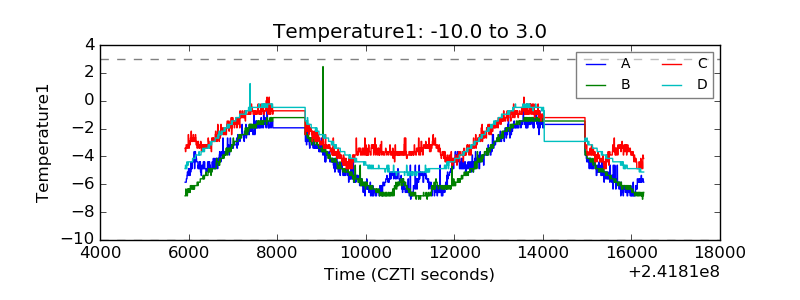 |
| Veto HV Monitor | 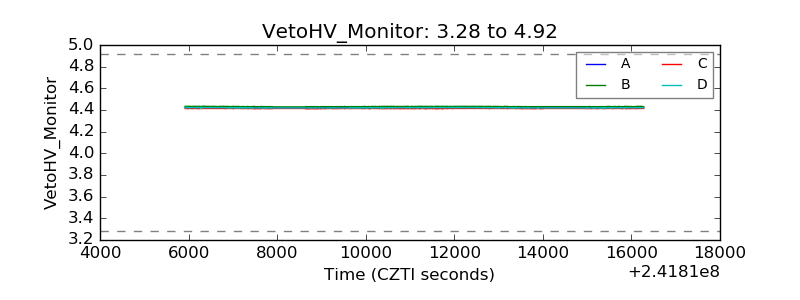 |
| Veto LLD | 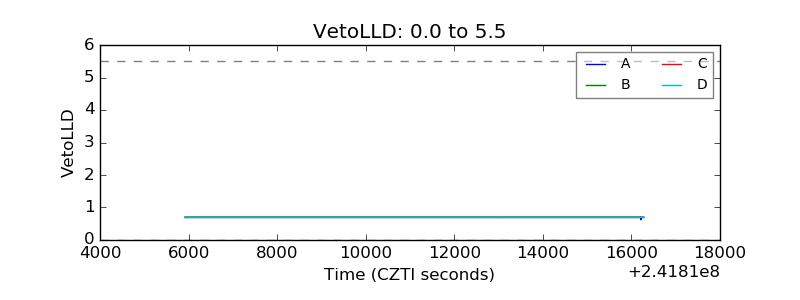 |
| Alpha Counter | 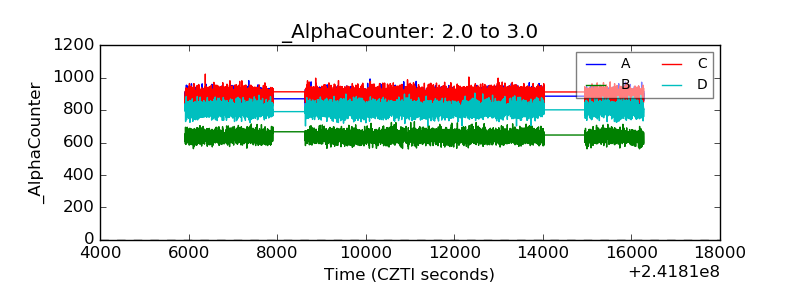 |
| _CPM_Rate | 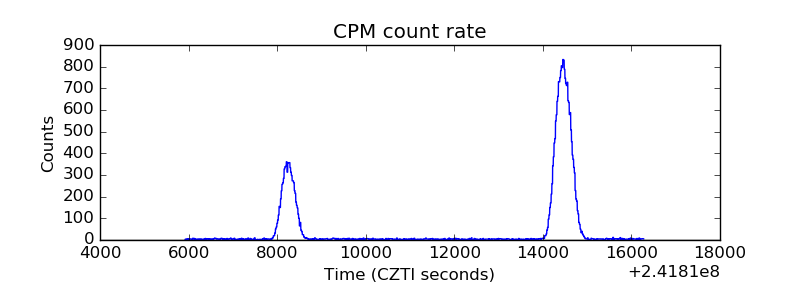 |
| CZT Counter | 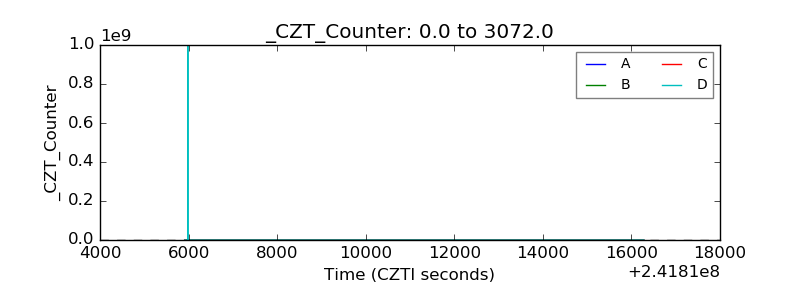 |
| +2.5 Volts monitor | 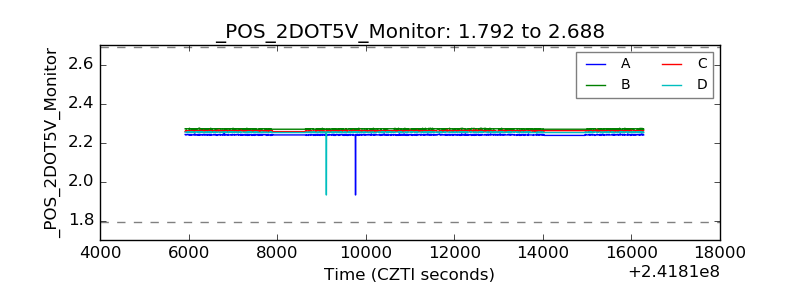 |
| +5 Volts monitor |  |
| _ROLL_ROT | 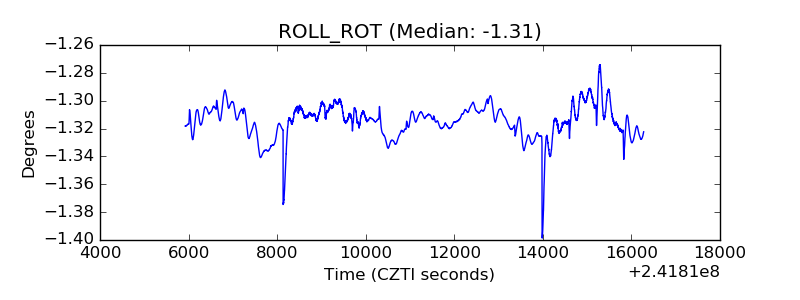 |
| _Roll_DEC | 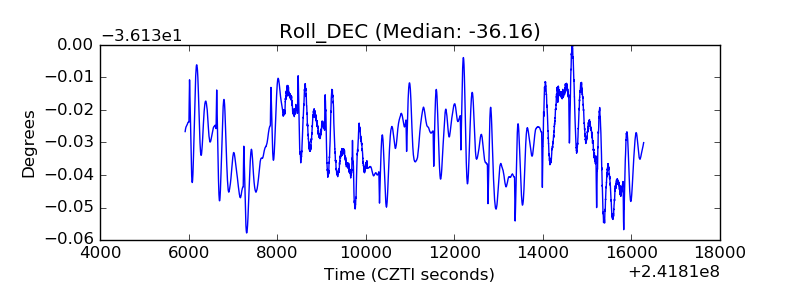 |
| _Roll_RA | 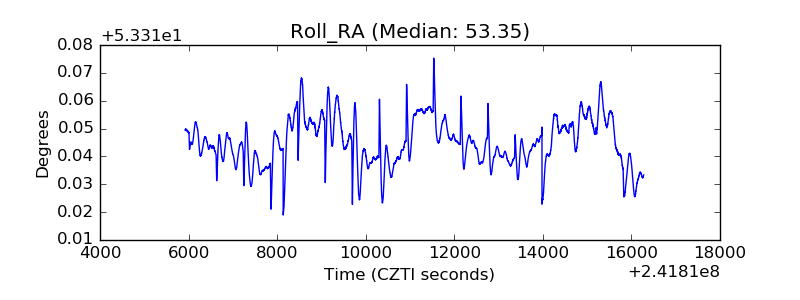 |
| Veto Counter | 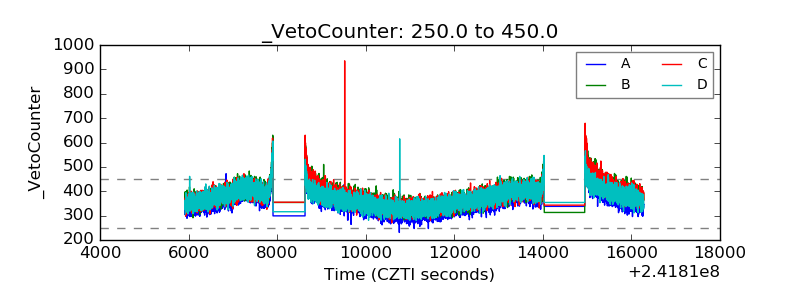 |