| Param | Original file | Final file |
|---|---|---|
| Filename | modeM0/AS1G07_057T02_9000001504_10402cztM0_level2.evt | modeM0/AS1G07_057T02_9000001504_10402cztM0_level2_quad_clean.evt |
| Size (bytes) | 470,249,280 | 95,880,960 |
| Size | 448.5 MB | 91.4 MB |
| Events in quadrant A | 3,029,802 | 617,904 |
| Events in quadrant B | 3,679,444 | 626,867 |
| Events in quadrant C | 3,014,637 | 622,957 |
| Events in quadrant D | 4,073,243 | 579,737 |
| Mode M0 | |||
|---|---|---|---|
| Quadrant | BADHDUFLAG | Total packets | Discarded packets |
| A | 0 | 13492 | 33 |
| B | 0 | 15369 | 35 |
| C | 0 | 13417 | 47 |
| D | 0 | 16441 | 33 |
| Mode M9 | |||
|---|---|---|---|
| Quadrant | BADHDUFLAG | Total packets | Discarded packets |
| A | 0 | 16 | 0 |
| B | 0 | 16 | 0 |
| C | 0 | 16 | 0 |
| D | 0 | 17 | 0 |
| Mode SS | |||
|---|---|---|---|
| Quadrant | BADHDUFLAG | Total packets | Discarded packets |
| A | 0 | 132 | 0 |
| B | 0 | 132 | 0 |
| C | 0 | 132 | 0 |
| D | 0 | 132 | 2 |
| Quadrant | Total seconds | Saturated seconds | Saturation percentage |
|---|---|---|---|
| A | 6546 | 20 | 0.305530% |
| B | 6550 | 168 | 2.564885% |
| C | 6541 | 24 | 0.366916% |
| D | 6547 | 159 | 2.428593% |
Noise dominated data is calculated using 1-second bins in cleaned event files. If a bin has >2000 counts, and if more than 50% of those come from <1% of pixels, then it is considered to be noise-dominated and hence unusable.
| Quadrant | # 1 sec bins | Bins with >0 counts | Bins with >2000 counts | High rate bins dominated by noise | Noise dominated (total time) | Noise dominated (detector-on time) | Marked lightcurve |
|---|---|---|---|---|---|---|---|
| A | 7586 | 6562 | 2 | 2 | 0.03% | 0.03% | 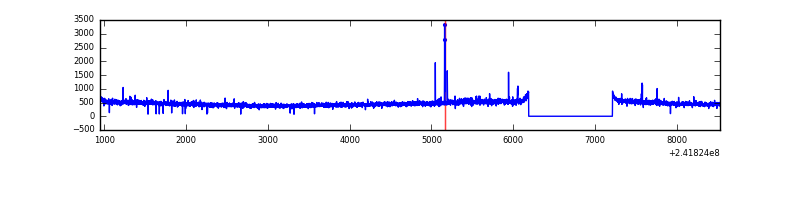 |
| B | 7586 | 6561 | 68 | 68 | 0.90% | 1.04% | 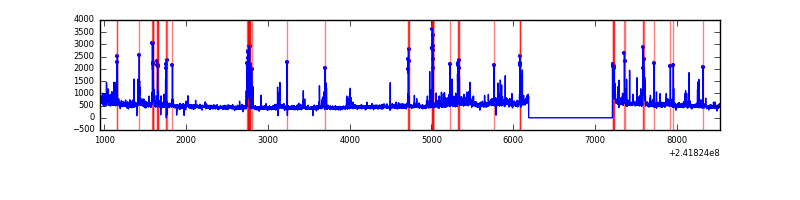 |
| C | 7586 | 6562 | 11 | 11 | 0.15% | 0.17% | 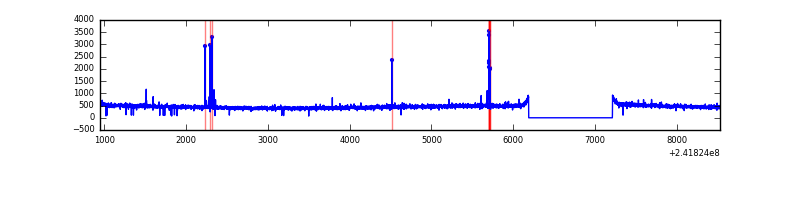 |
| D | 7586 | 6562 | 146 | 146 | 1.92% | 2.22% | 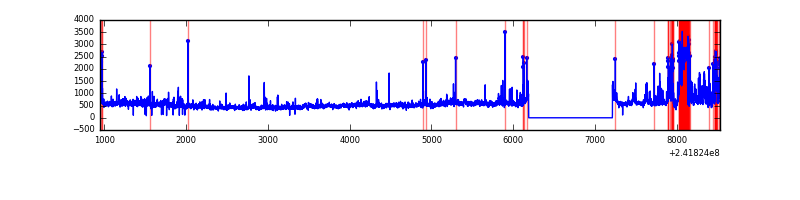 |
Top three noisy pixels from each quadrant. If the there are fewer than three noisy pixels in the level2.evt file, extra rows are filled as -1
| Pixel properties | Quadrant properties | ||||||
|---|---|---|---|---|---|---|---|
| Quadrant | DetID | PixID | Counts | Sigma | Mean | Median | Sigma |
| A | 8 | 15 | 24439 | 149.91 | 770 | 752 | 158.0 |
| A | 13 | 248 | 10568 | 62.12 | 770 | 752 | 158.0 |
| A | 15 | 174 | 10249 | 60.1 | 770 | 752 | 158.0 |
| B | 4 | 239 | 317200 | 2139.28 | 776 | 758 | 147.9 |
| B | 0 | 219 | 160690 | 1081.21 | 776 | 758 | 147.9 |
| B | 11 | 51 | 85193 | 570.82 | 776 | 758 | 147.9 |
| C | 14 | 234 | 52561 | 293.76 | 759 | 765 | 176.3 |
| C | 13 | 61 | 5594 | 27.39 | 759 | 765 | 176.3 |
| C | 14 | 67 | 2092 | 7.53 | 759 | 765 | 176.3 |
| D | 1 | 52 | 439279 | 2453.94 | 740 | 720 | 178.7 |
| D | 12 | 233 | 337360 | 1883.65 | 740 | 720 | 178.7 |
| D | 8 | 195 | 335167 | 1871.38 | 740 | 720 | 178.7 |
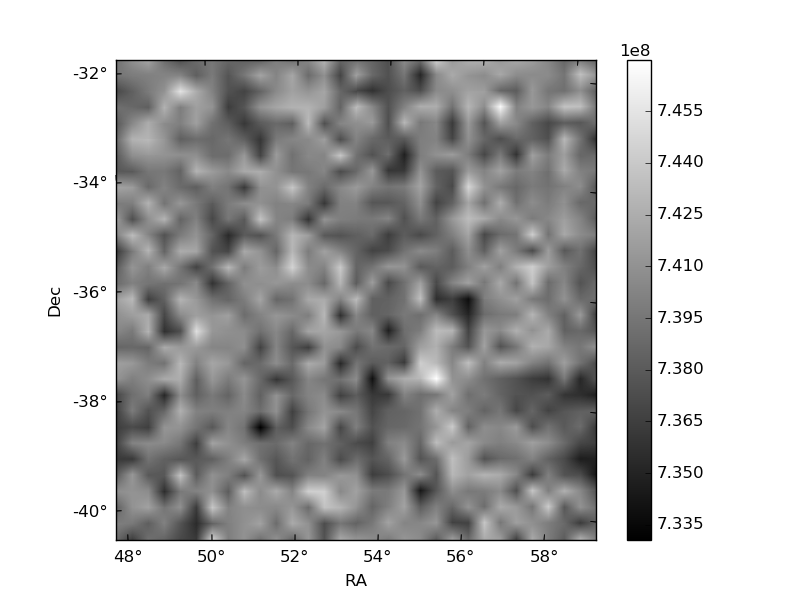
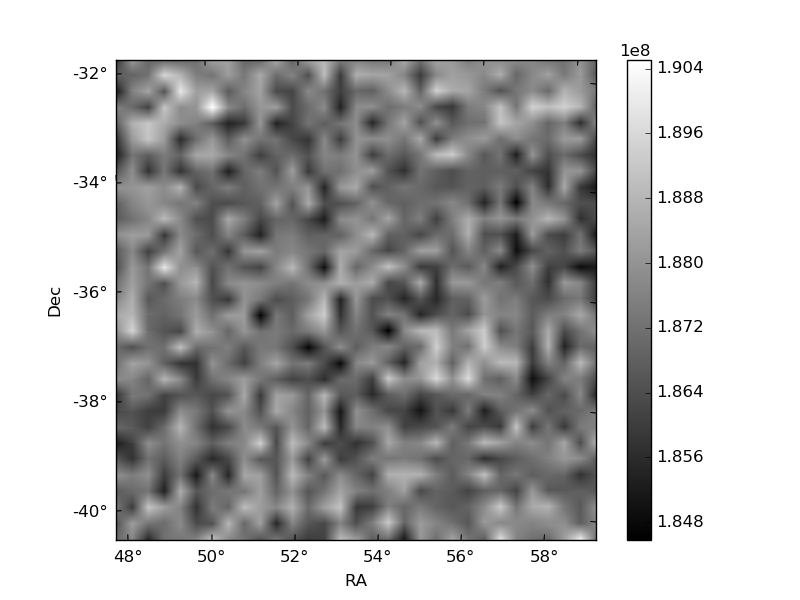
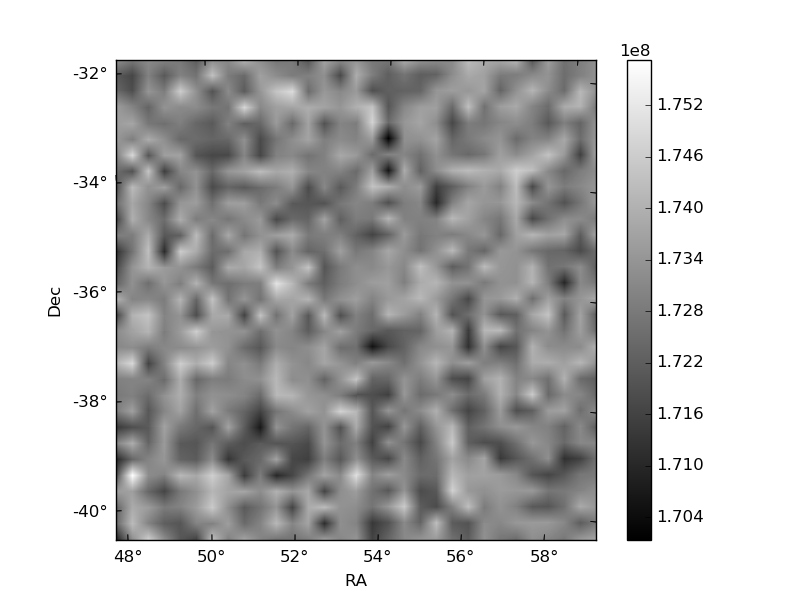
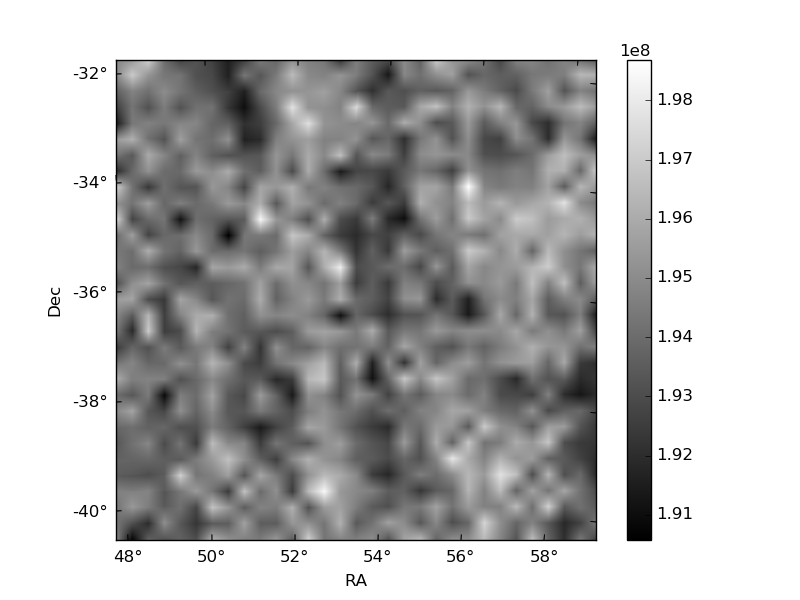
Histogram calculated using DETX and DETY for each event in the final _common_clean file
| Quadrant A | 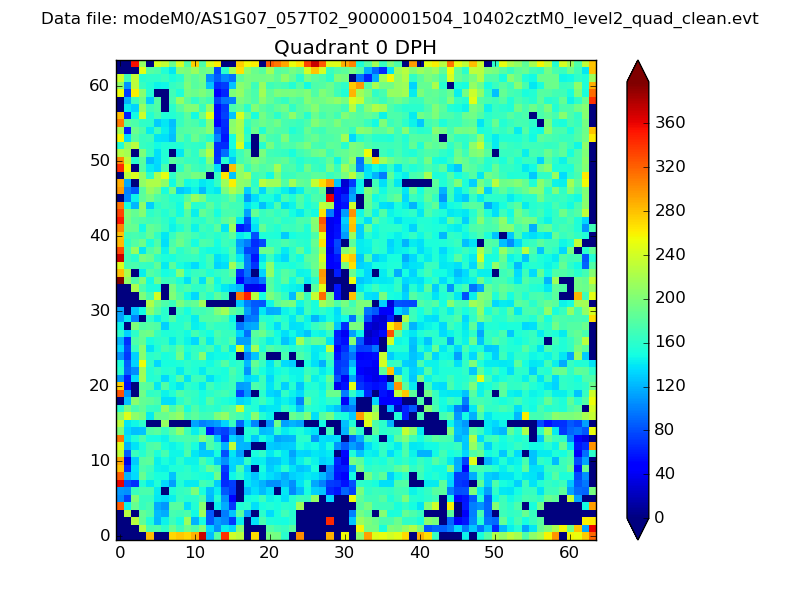 |
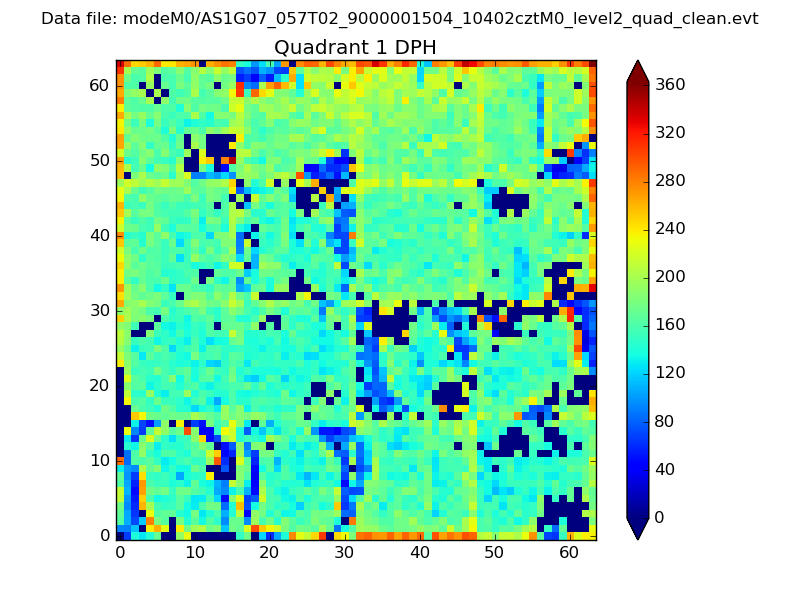 |
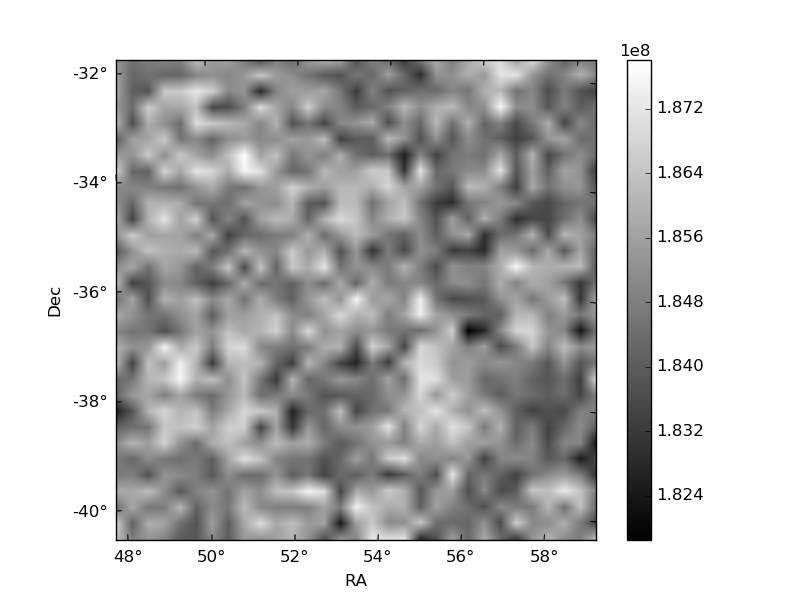
Quadrant B |
|---|---|---|---|
| Quadrant D | 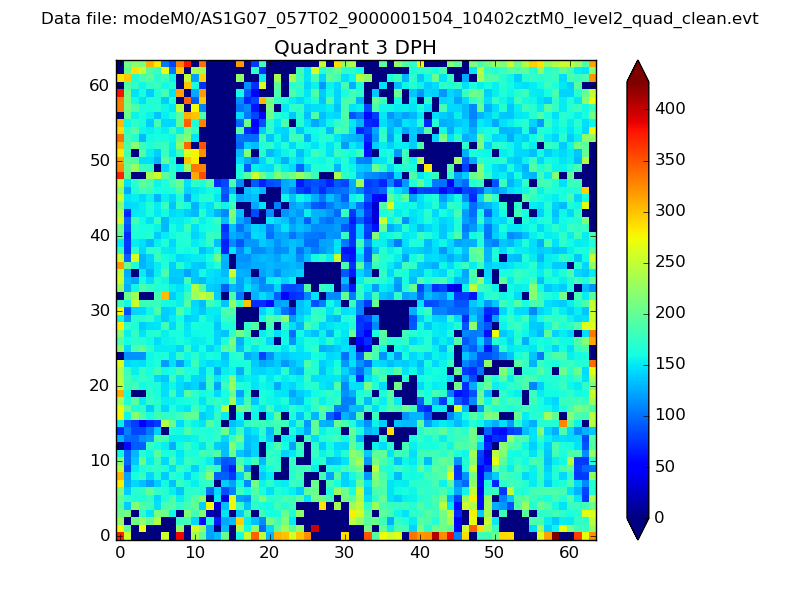 |
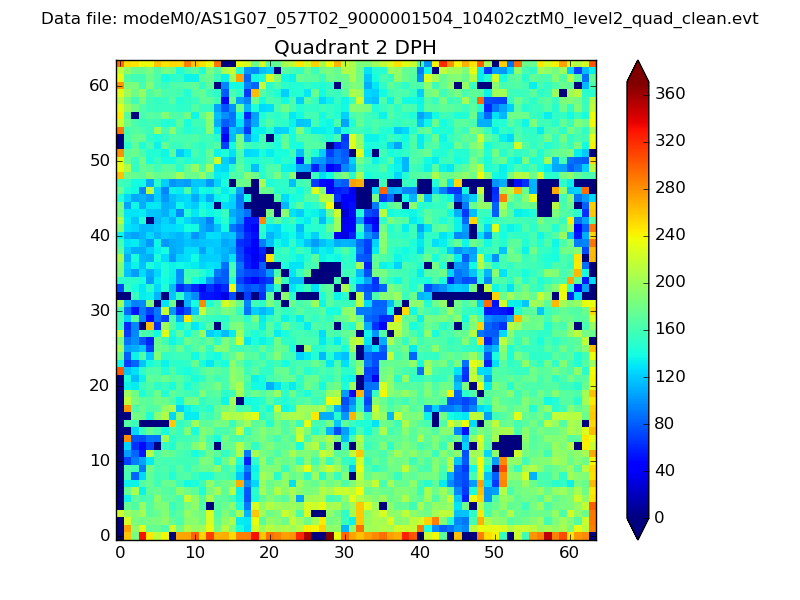 |
Quadrant C |
| Plot type | Count rate plots | Images |
|---|---|---|
| Comparison with Poisson distribution Blue bars denote a histogram of data divided into 1 sec bins. Red curve is a Poisson curve with rate = median count rate of data. |
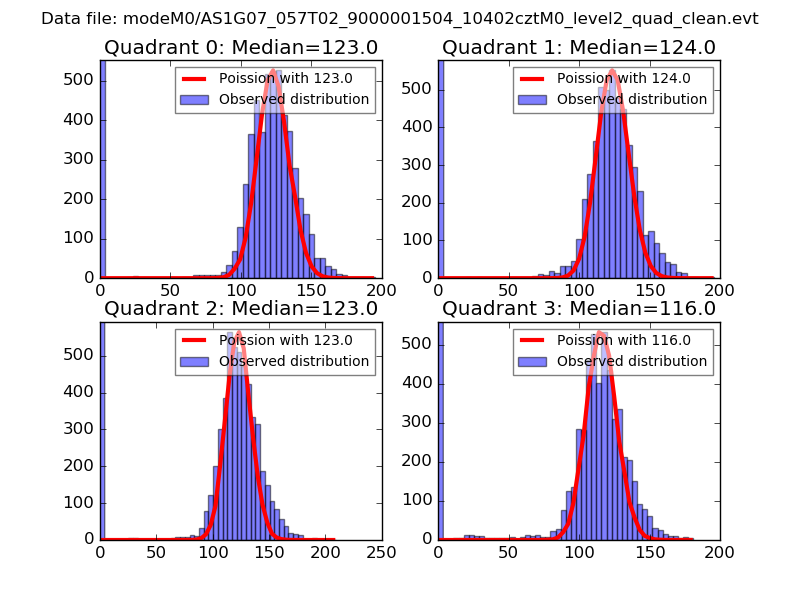 |
 |
| Quadrant-wise count rates Data is divided into 100 sec bins |
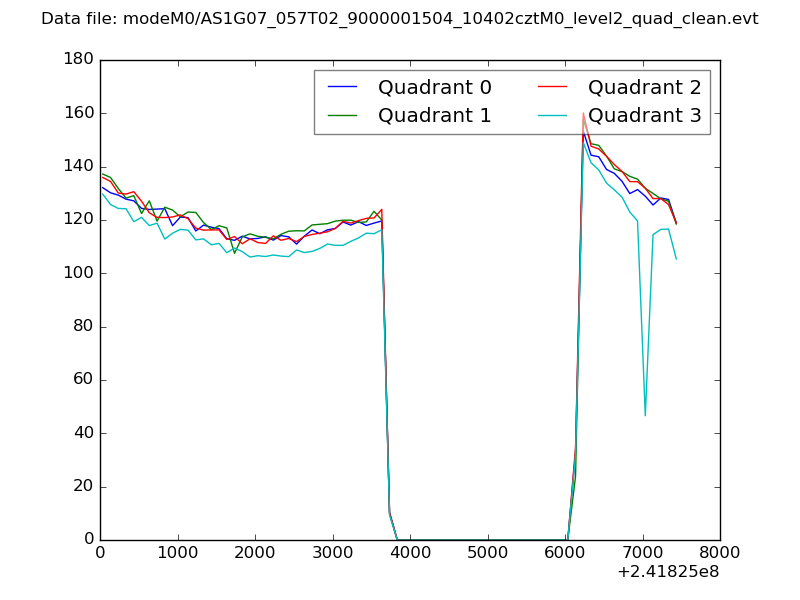 |
|
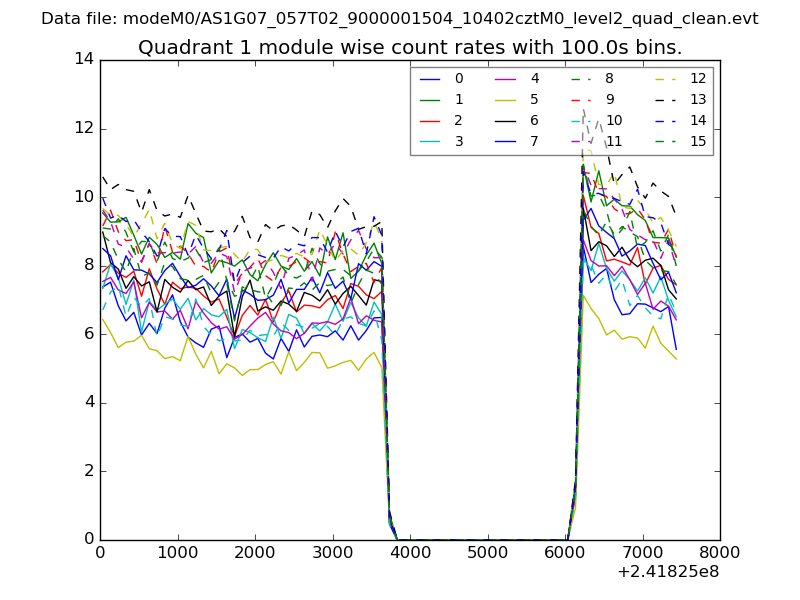
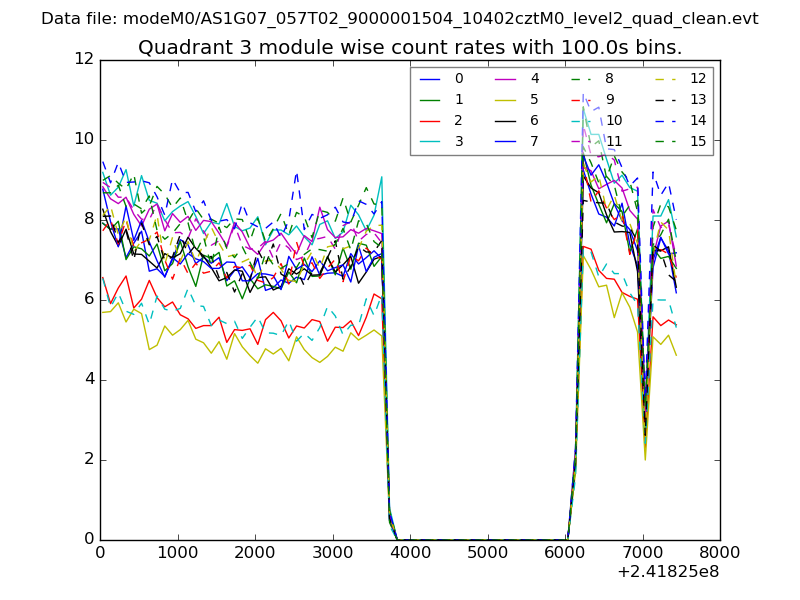
| Module-wise count rates for Quadrant A Data is divided into 100 sec bins |
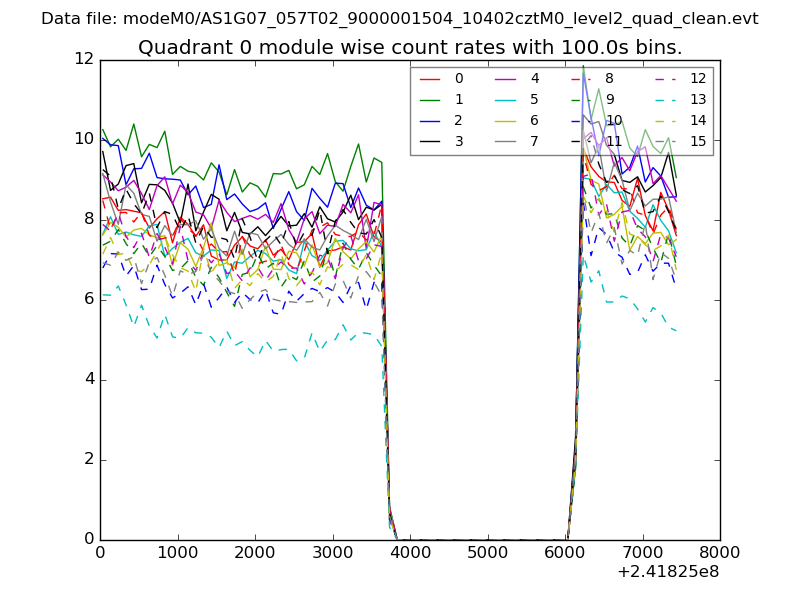 |
 |
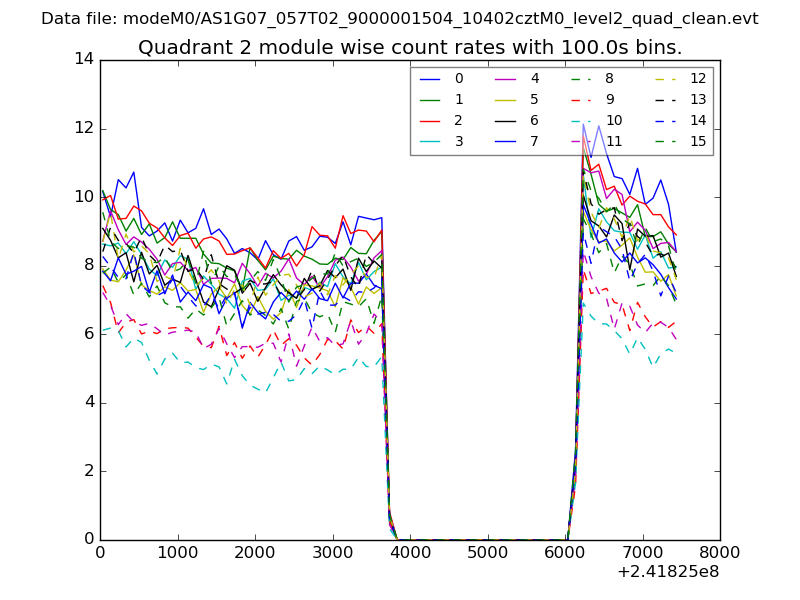
| Module-wise count rates for Quadrant B Data is divided into 100 sec bins |
 |
 |
| Module-wise count rates for Quadrant C Data is divided into 100 sec bins |
 |
 |
| Module-wise count rates for Quadrant D Data is divided into 100 sec bins |
 |
 |
| Parameter | Plot |
|---|---|
| CZT HV Monitor | 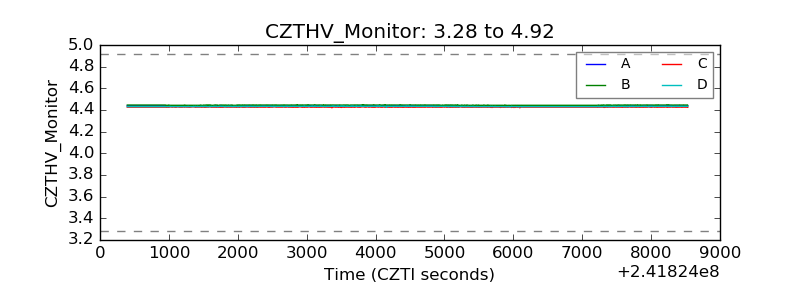 |
| D_VDD | 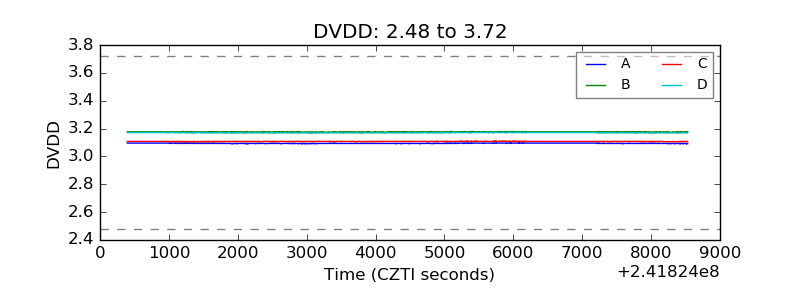 |
| Temperature 1 | 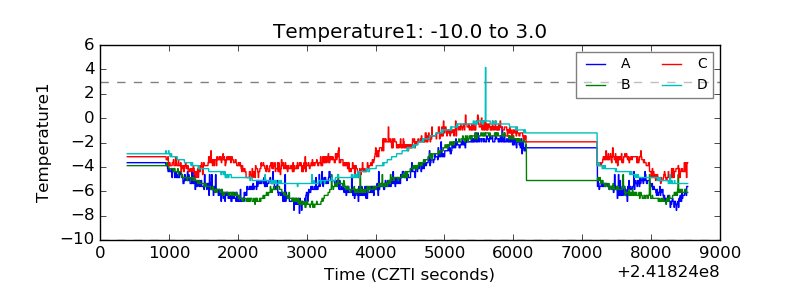 |
| Veto HV Monitor | 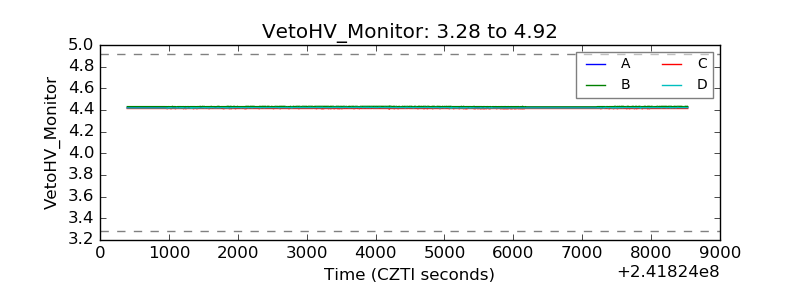 |
| Veto LLD | 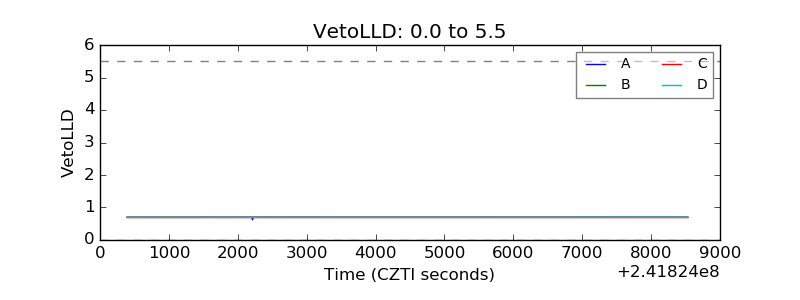 |
| Alpha Counter | 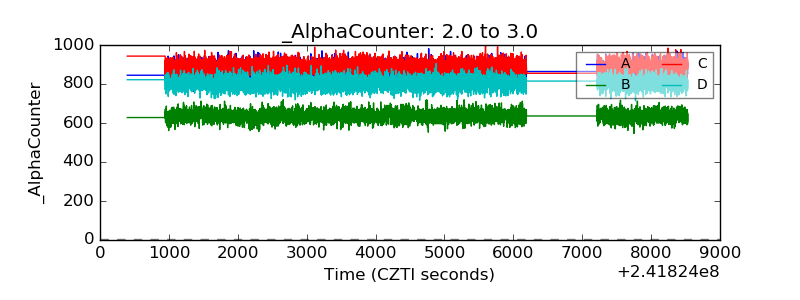 |
| _CPM_Rate | 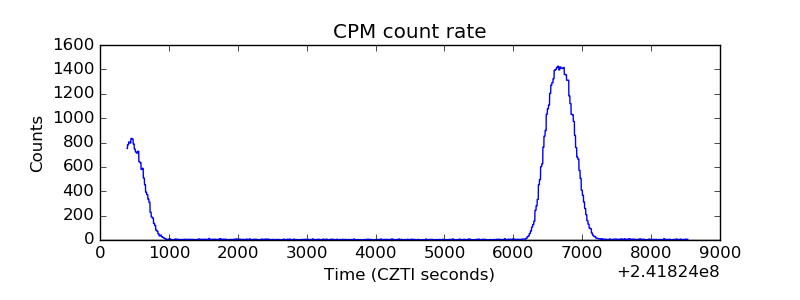 |
| CZT Counter | 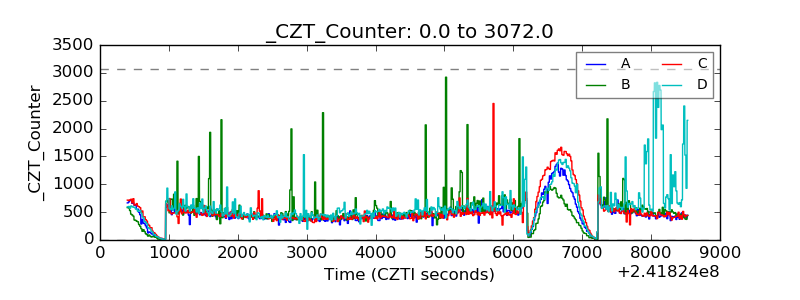 |
| +2.5 Volts monitor |  |
| +5 Volts monitor | 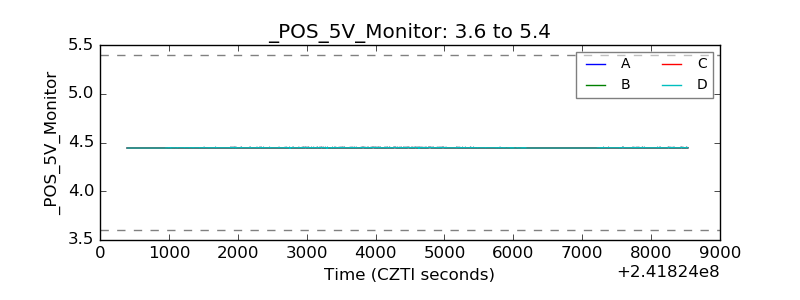 |
| _ROLL_ROT | 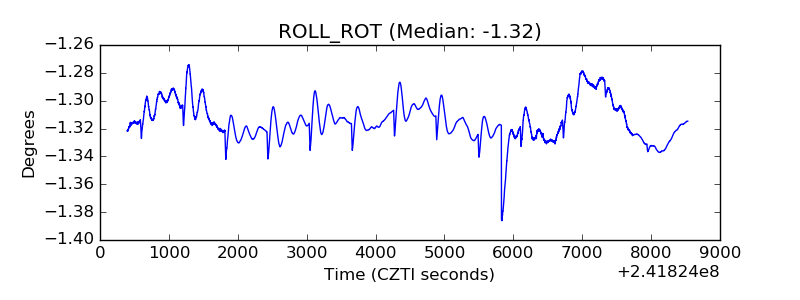 |
| _Roll_DEC | 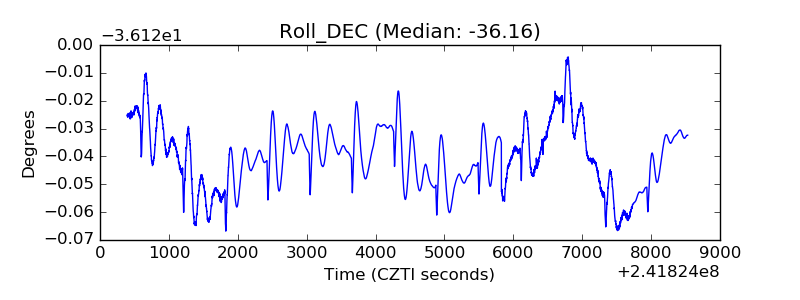 |
| _Roll_RA | 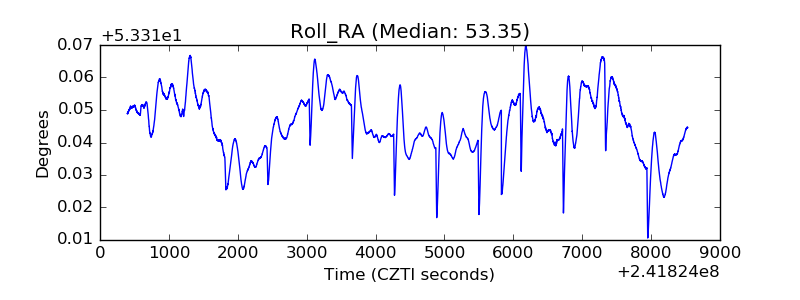 |
| Veto Counter | 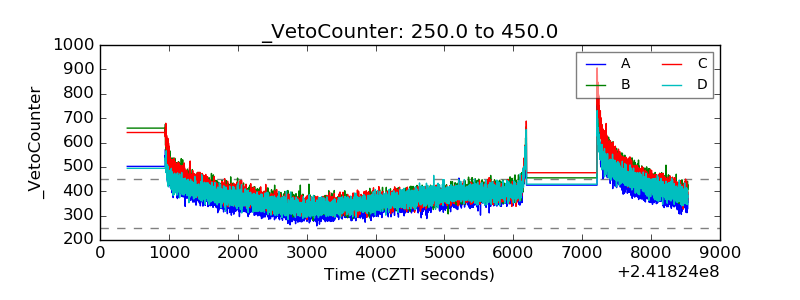 |