| Param | Original file | Final file |
|---|---|---|
| Filename | modeM0/AS1G07_057T02_9000001504_10405cztM0_level2.evt | modeM0/AS1G07_057T02_9000001504_10405cztM0_level2_quad_clean.evt |
| Size (bytes) | 477,429,120 | 98,616,960 |
| Size | 455.3 MB | 94.0 MB |
| Events in quadrant A | 3,252,623 | 630,743 |
| Events in quadrant B | 3,837,744 | 644,051 |
| Events in quadrant C | 3,186,216 | 645,943 |
| Events in quadrant D | 3,734,169 | 605,644 |
| Mode M0 | |||
|---|---|---|---|
| Quadrant | BADHDUFLAG | Total packets | Discarded packets |
| A | 0 | 13874 | 3 |
| B | 0 | 15640 | 2 |
| C | 0 | 13685 | 2 |
| D | 0 | 15167 | 2 |
| Mode M9 | |||
|---|---|---|---|
| Quadrant | BADHDUFLAG | Total packets | Discarded packets |
| A | 0 | 20 | 0 |
| B | 0 | 20 | 0 |
| C | 0 | 20 | 0 |
| D | 0 | 21 | 0 |
| Mode SS | |||
|---|---|---|---|
| Quadrant | BADHDUFLAG | Total packets | Discarded packets |
| A | 0 | 134 | 0 |
| B | 0 | 134 | 0 |
| C | 0 | 134 | 0 |
| D | 0 | 134 | 0 |
| Quadrant | Total seconds | Saturated seconds | Saturation percentage |
|---|---|---|---|
| A | 6601 | 29 | 0.439327% |
| B | 6601 | 149 | 2.257234% |
| C | 6601 | 25 | 0.378730% |
| D | 6601 | 28 | 0.424178% |
Noise dominated data is calculated using 1-second bins in cleaned event files. If a bin has >2000 counts, and if more than 50% of those come from <1% of pixels, then it is considered to be noise-dominated and hence unusable.
| Quadrant | # 1 sec bins | Bins with >0 counts | Bins with >2000 counts | High rate bins dominated by noise | Noise dominated (total time) | Noise dominated (detector-on time) | Marked lightcurve |
|---|---|---|---|---|---|---|---|
| A | 7831 | 6602 | 6 | 6 | 0.08% | 0.09% | 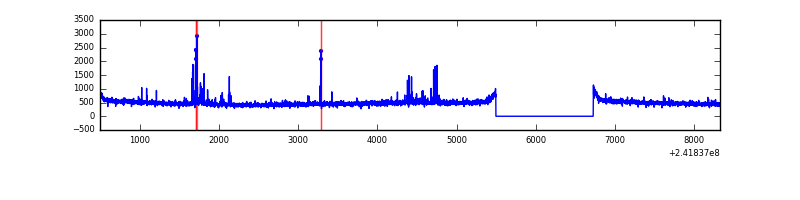 |
| B | 7831 | 6601 | 65 | 65 | 0.83% | 0.98% | 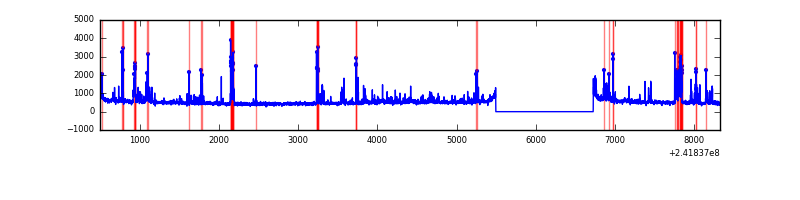 |
| C | 7831 | 6602 | 0 | 0 | 0.00% | 0.00% |  |
| D | 7831 | 6602 | 9 | 9 | 0.11% | 0.14% | 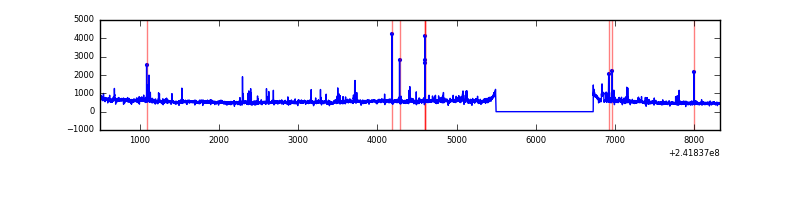 |
Top three noisy pixels from each quadrant. If the there are fewer than three noisy pixels in the level2.evt file, extra rows are filled as -1
| Pixel properties | Quadrant properties | ||||||
|---|---|---|---|---|---|---|---|
| Quadrant | DetID | PixID | Counts | Sigma | Mean | Median | Sigma |
| A | 4 | 2 | 96288 | 580.01 | 816 | 798 | 164.6 |
| A | 0 | 226 | 7408 | 40.15 | 816 | 798 | 164.6 |
| A | 3 | 1 | 7309 | 39.55 | 816 | 798 | 164.6 |
| B | 4 | 239 | 439246 | 2871.67 | 817 | 798 | 152.7 |
| B | 0 | 219 | 73342 | 475.14 | 817 | 798 | 152.7 |
| B | 11 | 51 | 58203 | 375.98 | 817 | 798 | 152.7 |
| C | 14 | 234 | 7886 | 37.82 | 814 | 821 | 186.8 |
| C | 13 | 61 | 6157 | 28.56 | 814 | 821 | 186.8 |
| C | 14 | 67 | 3556 | 14.64 | 814 | 821 | 186.8 |
| D | 8 | 195 | 443397 | 2319.09 | 801 | 781 | 190.9 |
| D | 1 | 52 | 112843 | 587.15 | 801 | 781 | 190.9 |
| D | 1 | 20 | 111302 | 579.07 | 801 | 781 | 190.9 |
Histogram calculated using DETX and DETY for each event in the final _common_clean file
| Quadrant A |  |
 |
Quadrant B |
|---|---|---|---|
| Quadrant D |  |
 |
Quadrant C |
| Plot type | Count rate plots | Images |
|---|---|---|
| Comparison with Poisson distribution Blue bars denote a histogram of data divided into 1 sec bins. Red curve is a Poisson curve with rate = median count rate of data. |
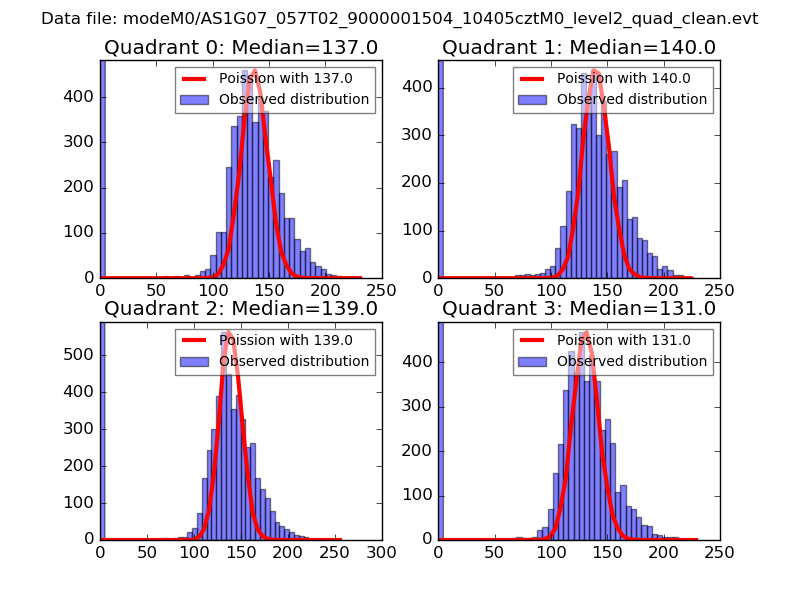 |
 |
| Quadrant-wise count rates Data is divided into 100 sec bins |
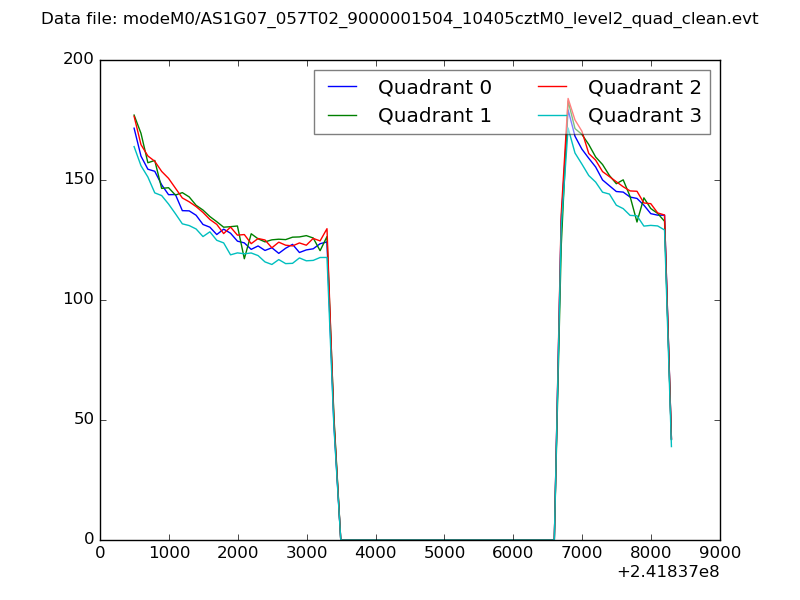 |
|
| Module-wise count rates for Quadrant A Data is divided into 100 sec bins |
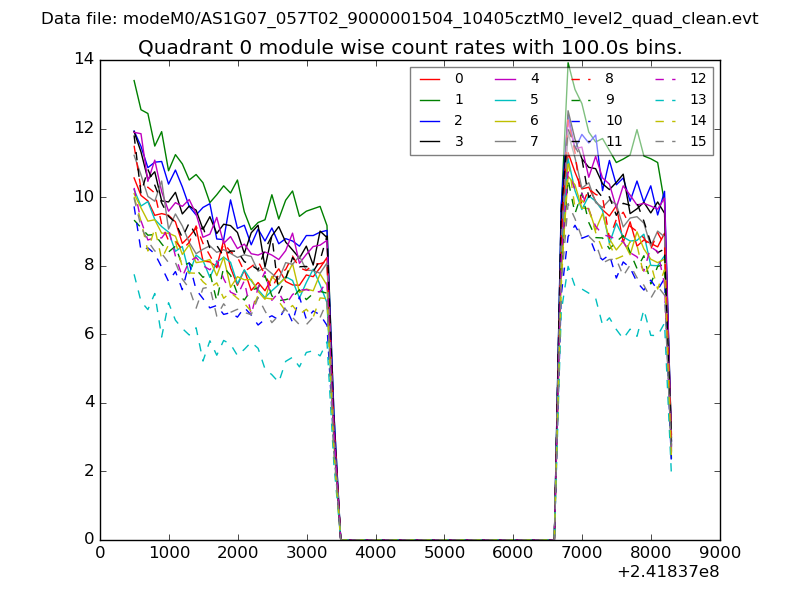 |
 |
| Module-wise count rates for Quadrant B Data is divided into 100 sec bins |
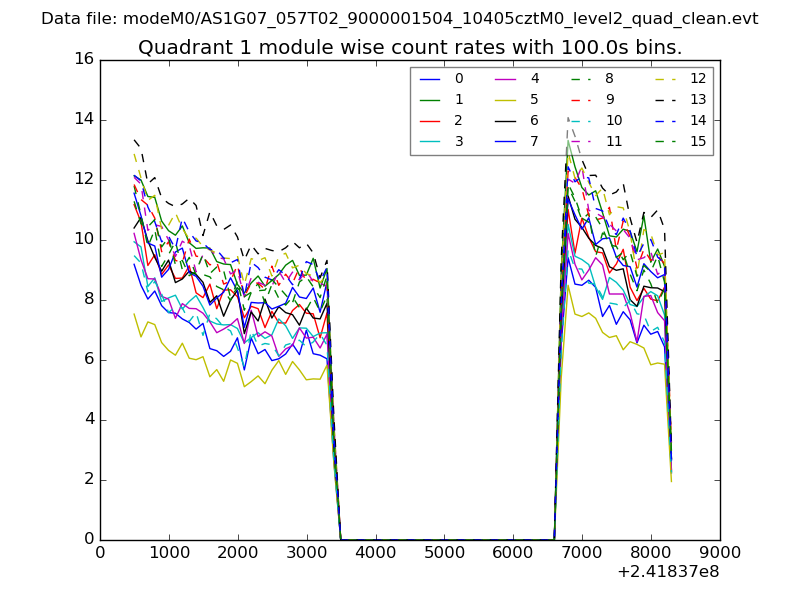 |
 |
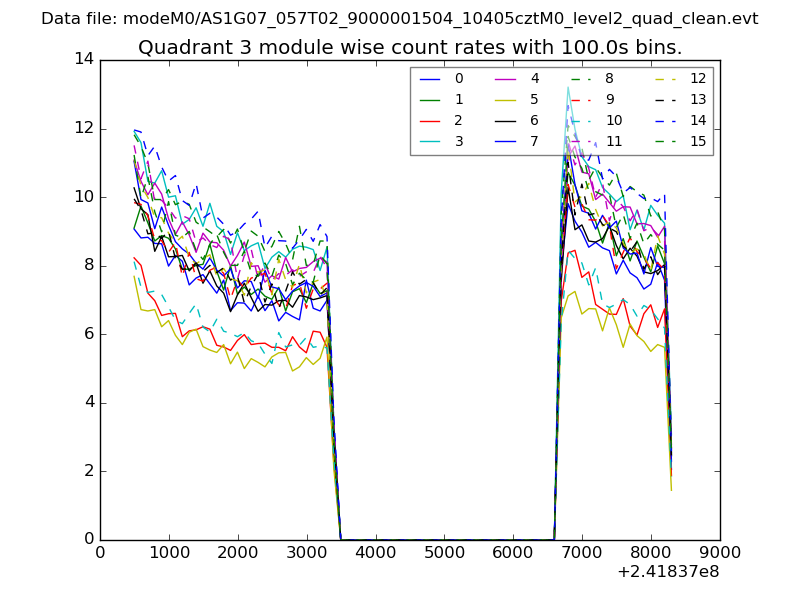
| Module-wise count rates for Quadrant C Data is divided into 100 sec bins |
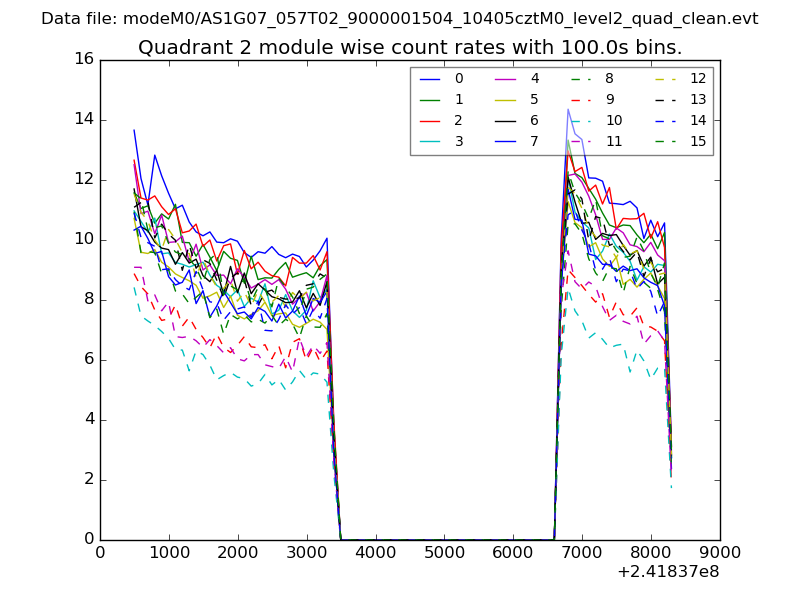 |
 |
| Module-wise count rates for Quadrant D Data is divided into 100 sec bins |
 |
 |
| Parameter | Plot |
|---|---|
| CZT HV Monitor | 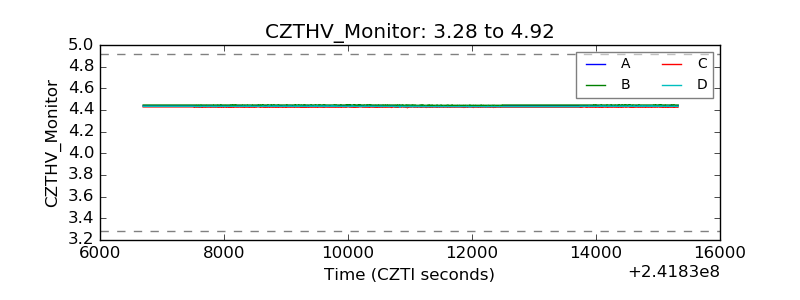 |
| D_VDD |  |
| Temperature 1 |  |
| Veto HV Monitor |  |
| Veto LLD |  |
| Alpha Counter | 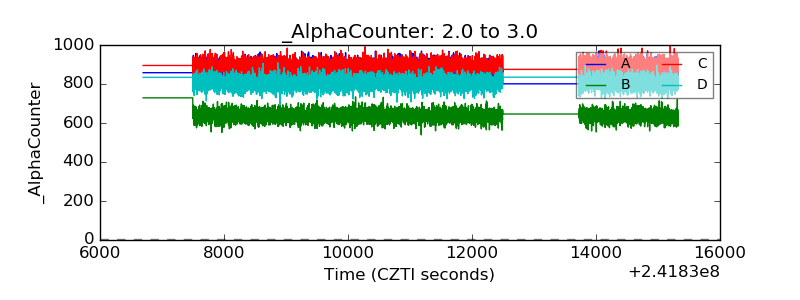 |
| _CPM_Rate | 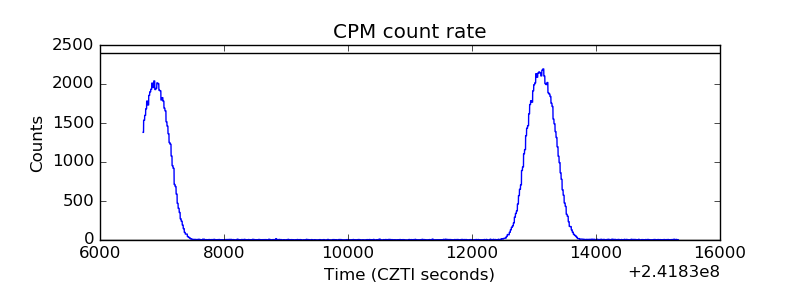 |
| CZT Counter |  |
| +2.5 Volts monitor |  |
| +5 Volts monitor |  |
| _ROLL_ROT | 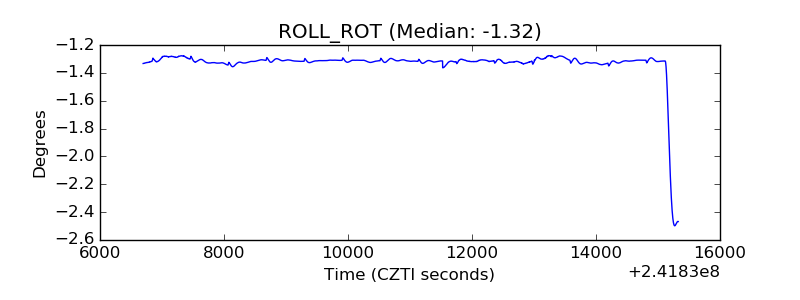 |
| _Roll_DEC |  |
| _Roll_RA |  |
| Veto Counter | 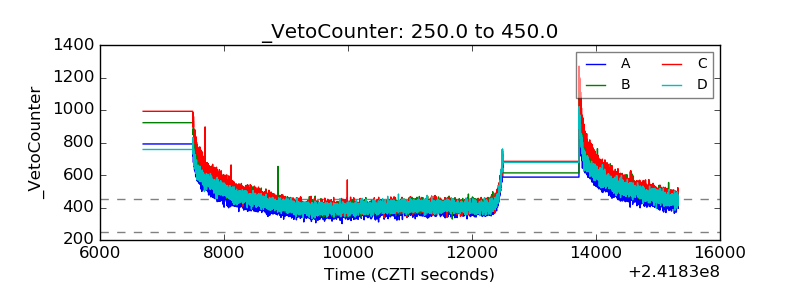 |