| Param | Original file | Final file |
|---|---|---|
| Filename | modeM0/AS1G07_057T02_9000001504_10406cztM0_level2.evt | modeM0/AS1G07_057T02_9000001504_10406cztM0_level2_quad_clean.evt |
| Size (bytes) | 90,682,560 | 21,317,760 |
| Size | 86.5 MB | 20.3 MB |
| Events in quadrant A | 634,136 | 131,511 |
| Events in quadrant B | 665,688 | 138,703 |
| Events in quadrant C | 661,838 | 142,445 |
| Events in quadrant D | 695,469 | 137,772 |
| Mode M0 | |||
|---|---|---|---|
| Quadrant | BADHDUFLAG | Total packets | Discarded packets |
| A | 0 | 19900 | 17290 |
| B | 0 | 23384 | 20684 |
| C | 0 | 20793 | 18063 |
| D | 0 | 25856 | 23102 |
| Mode M9 | |||
|---|---|---|---|
| Quadrant | BADHDUFLAG | Total packets | Discarded packets |
| A | 0 | 26 | 17 |
| B | 0 | 29 | 22 |
| C | 0 | 28 | 16 |
| D | 0 | 25 | 17 |
| Mode SS | |||
|---|---|---|---|
| Quadrant | BADHDUFLAG | Total packets | Discarded packets |
| A | 0 | 206 | 181 |
| B | 0 | 206 | 183 |
| C | 0 | 207 | 185 |
| D | 0 | 192 | 165 |
| Quadrant | Total seconds | Saturated seconds | Saturation percentage |
|---|---|---|---|
| A | 1272 | 2 | 0.157233% |
| B | 1252 | 2 | 0.159744% |
| C | 1322 | 1 | 0.075643% |
| D | 1213 | 4 | 0.329761% |
Noise dominated data is calculated using 1-second bins in cleaned event files. If a bin has >2000 counts, and if more than 50% of those come from <1% of pixels, then it is considered to be noise-dominated and hence unusable.
| Quadrant | # 1 sec bins | Bins with >0 counts | Bins with >2000 counts | High rate bins dominated by noise | Noise dominated (total time) | Noise dominated (detector-on time) | Marked lightcurve |
|---|---|---|---|---|---|---|---|
| A | 5769 | 1844 | 0 | 0 | 0.00% | 0.00% | 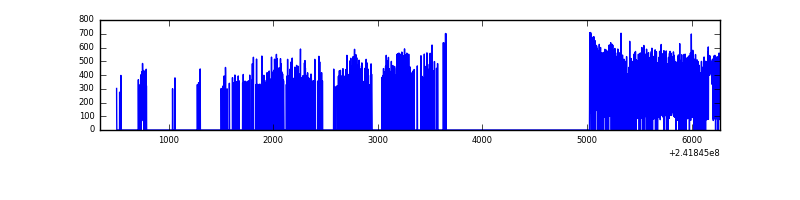 |
| B | 5766 | 1790 | 0 | 0 | 0.00% | 0.00% | 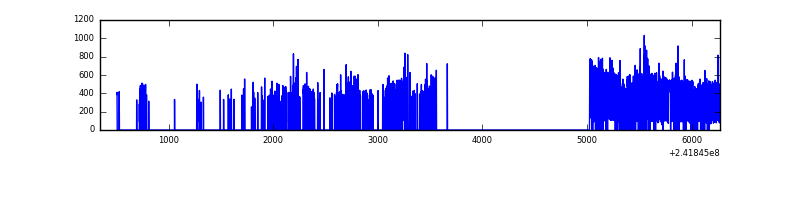 |
| C | 5916 | 1899 | 0 | 0 | 0.00% | 0.00% | 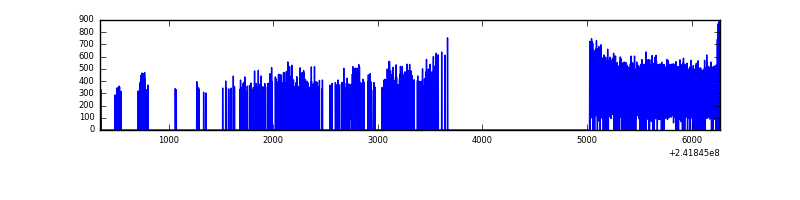 |
| D | 5928 | 1646 | 0 | 0 | 0.00% | 0.00% | 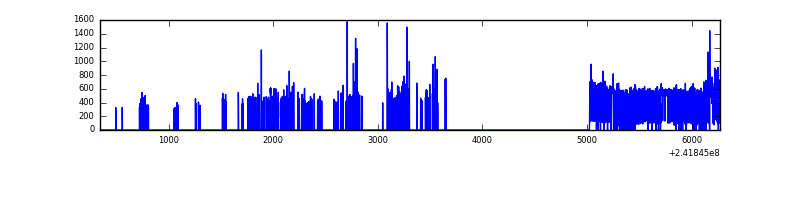 |
Top three noisy pixels from each quadrant. If the there are fewer than three noisy pixels in the level2.evt file, extra rows are filled as -1
| Pixel properties | Quadrant properties | ||||||
|---|---|---|---|---|---|---|---|
| Quadrant | DetID | PixID | Counts | Sigma | Mean | Median | Sigma |
| A | 0 | 226 | 1562 | 40.62 | 163 | 160 | 34.5 |
| A | 12 | 194 | 1303 | 33.12 | 163 | 160 | 34.5 |
| A | 13 | 253 | 1147 | 28.6 | 163 | 160 | 34.5 |
| B | 4 | 239 | 19300 | 593.88 | 161 | 158 | 32.2 |
| B | 0 | 219 | 11216 | 343.07 | 161 | 158 | 32.2 |
| B | 4 | 81 | 4033 | 120.22 | 161 | 158 | 32.2 |
| C | 14 | 234 | 3105 | 74.35 | 168 | 170 | 39.5 |
| C | 13 | 61 | 1251 | 27.39 | 168 | 170 | 39.5 |
| C | 14 | 67 | 524 | 8.97 | 168 | 170 | 39.5 |
| D | 8 | 195 | 73062 | 1934.48 | 153 | 149 | 37.7 |
| D | 1 | 52 | 17432 | 458.54 | 153 | 149 | 37.7 |
| D | 1 | 20 | 15887 | 417.55 | 153 | 149 | 37.7 |
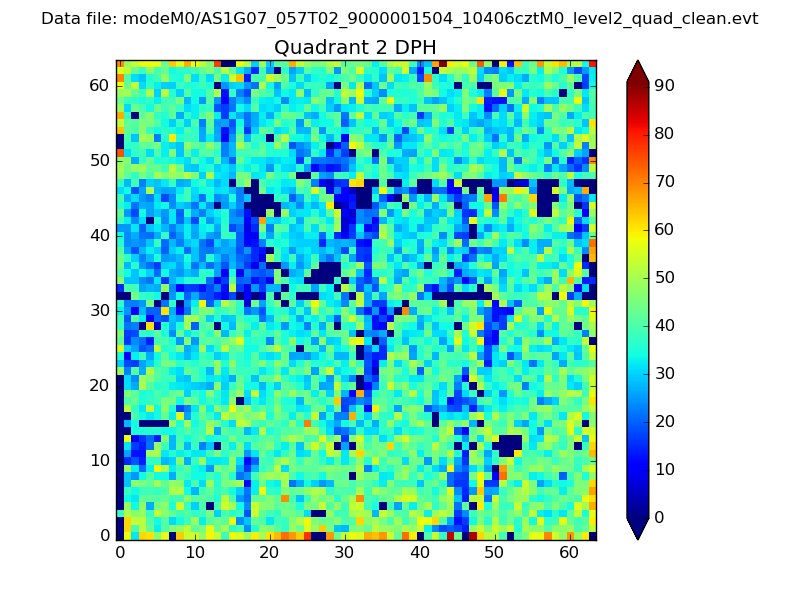
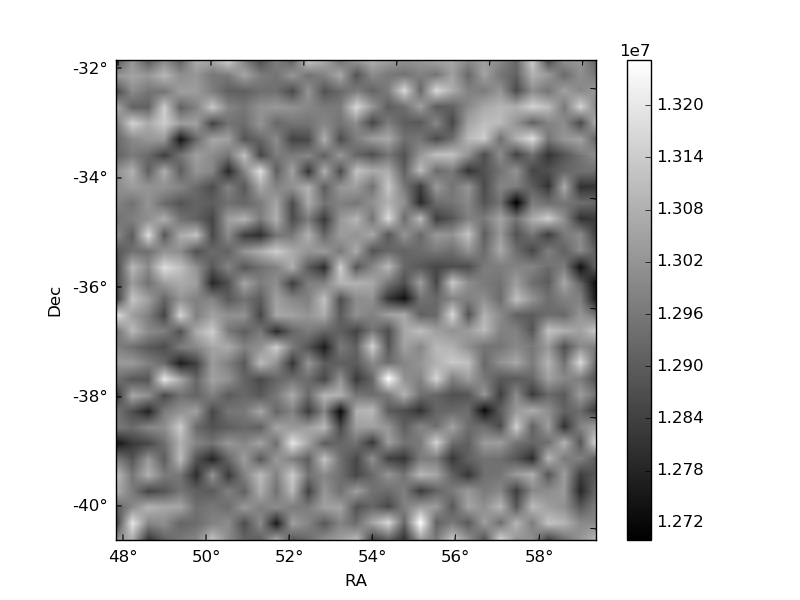
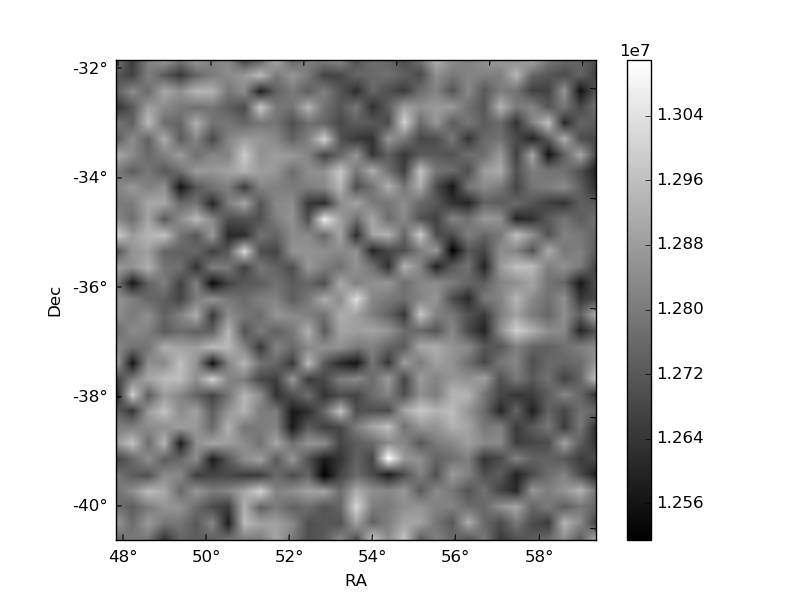
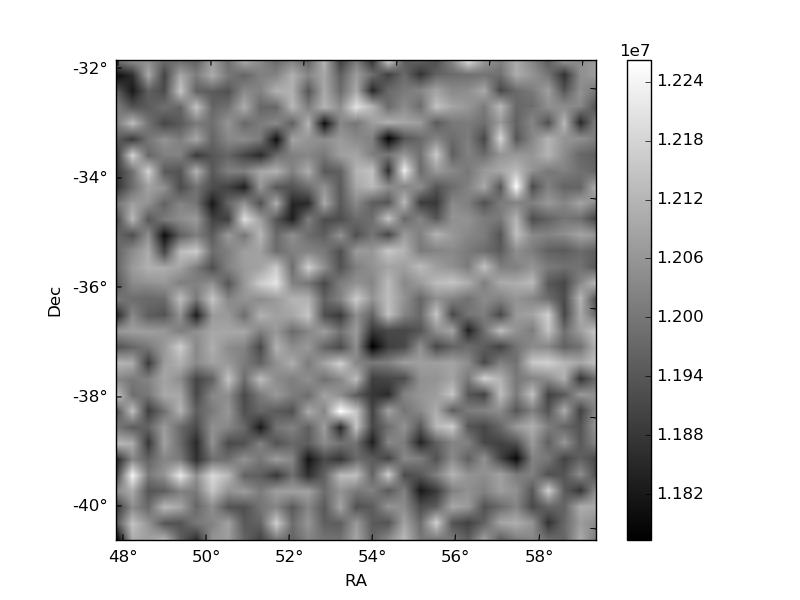
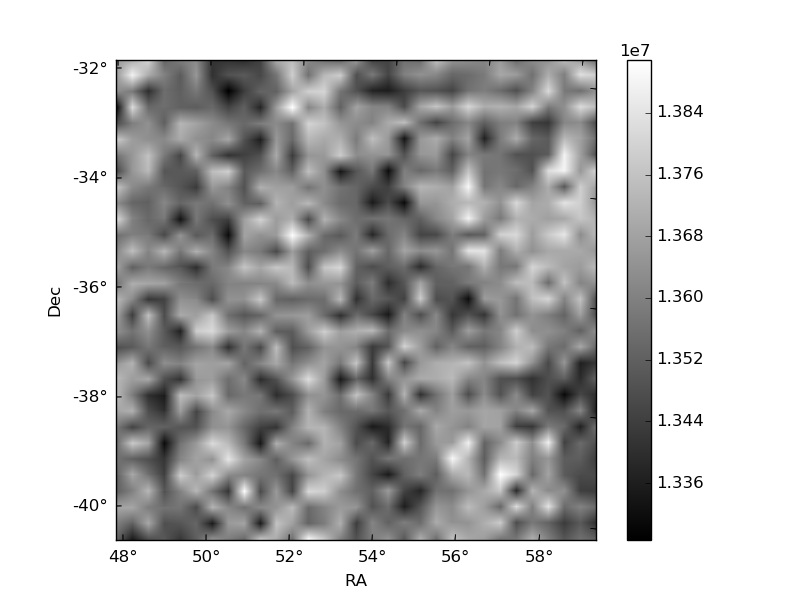
Histogram calculated using DETX and DETY for each event in the final _common_clean file
| Quadrant A | 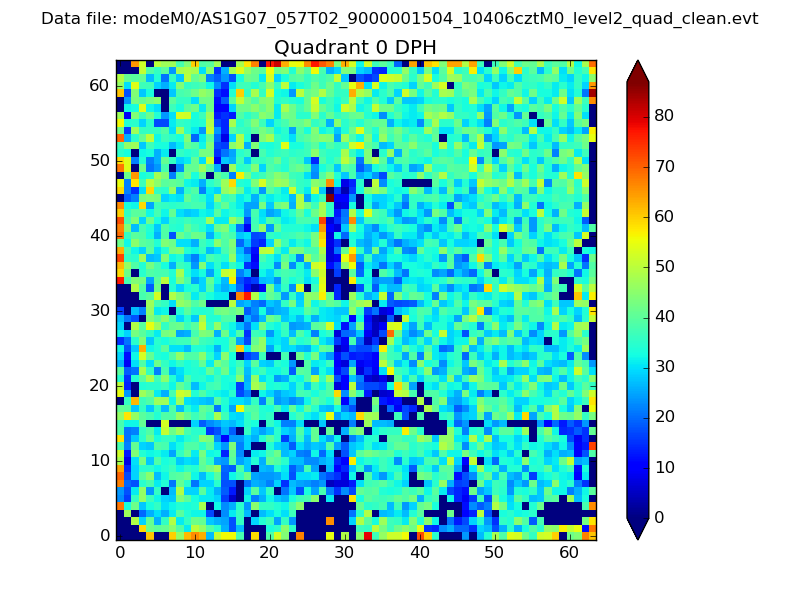 |
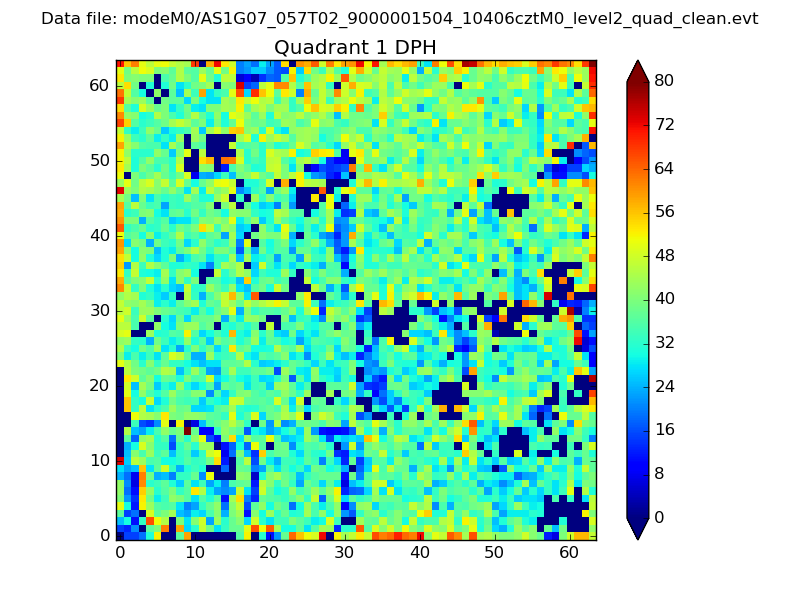 |
Quadrant B |
|---|---|---|---|
| Quadrant D | 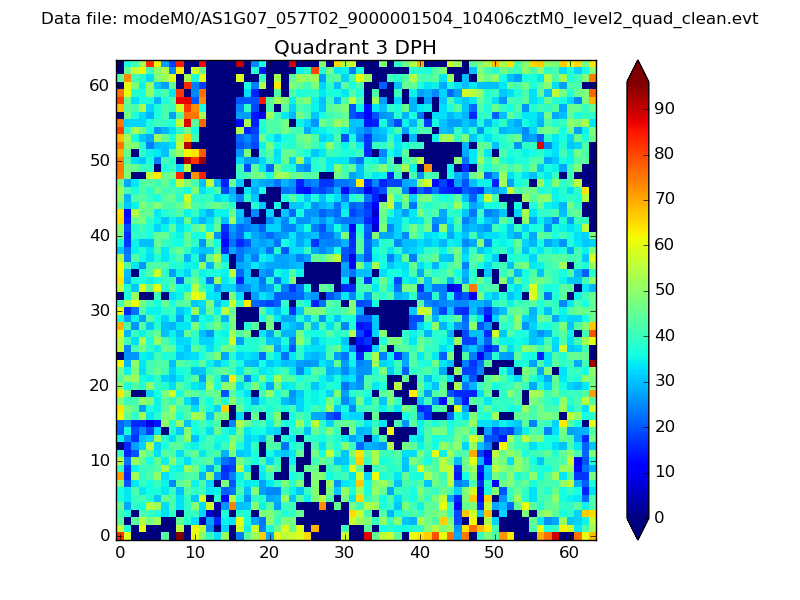 |
 |
Quadrant C |
| Plot type | Count rate plots | Images |
|---|---|---|
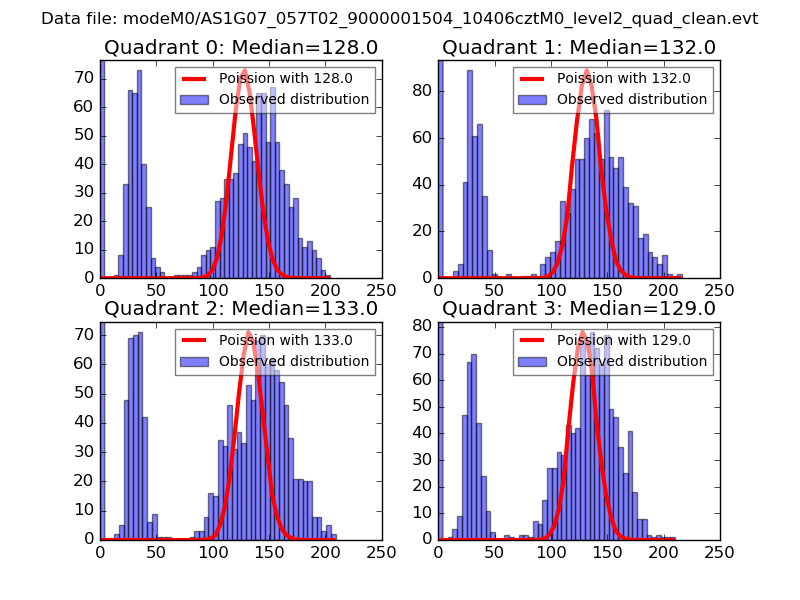
| Comparison with Poisson distribution Blue bars denote a histogram of data divided into 1 sec bins. Red curve is a Poisson curve with rate = median count rate of data. |
 |
 |
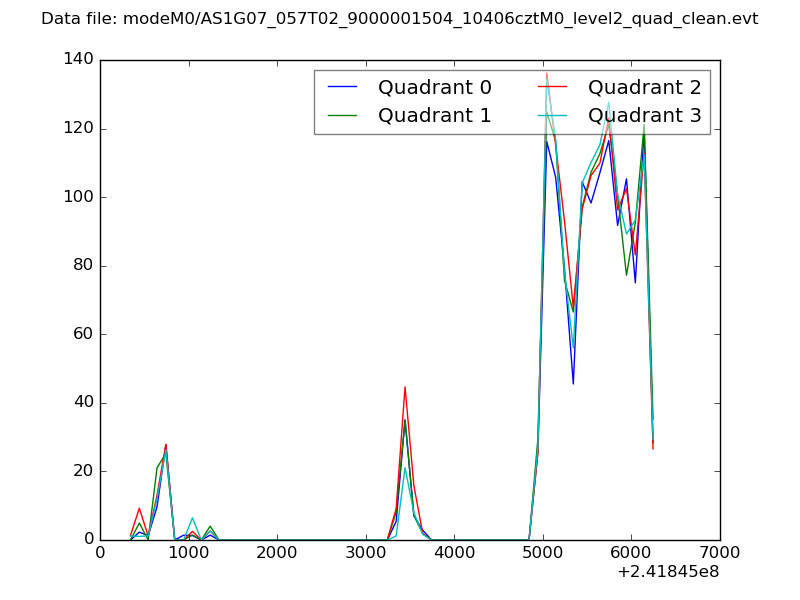
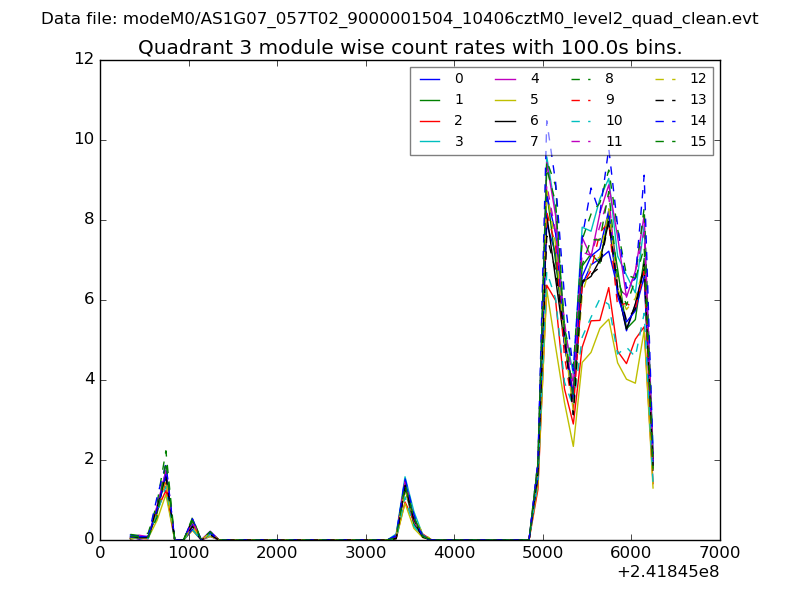
| Quadrant-wise count rates Data is divided into 100 sec bins |
 |
|
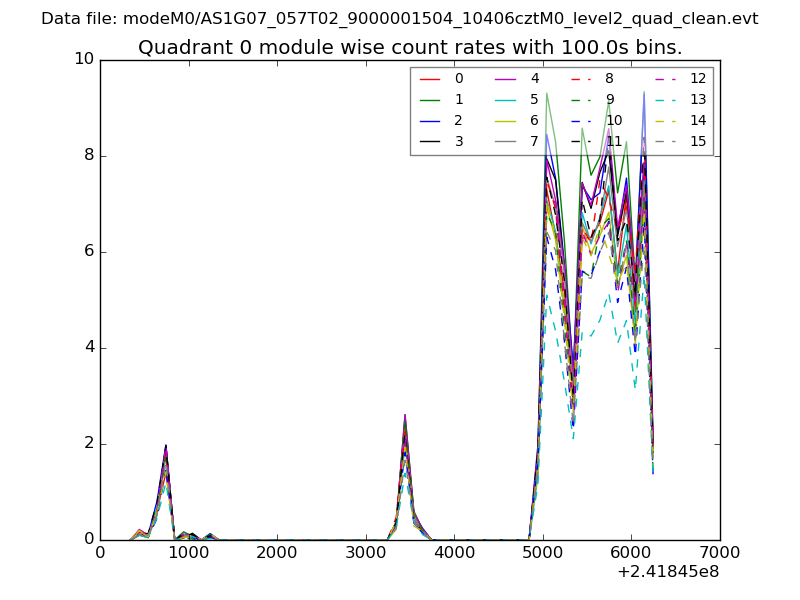
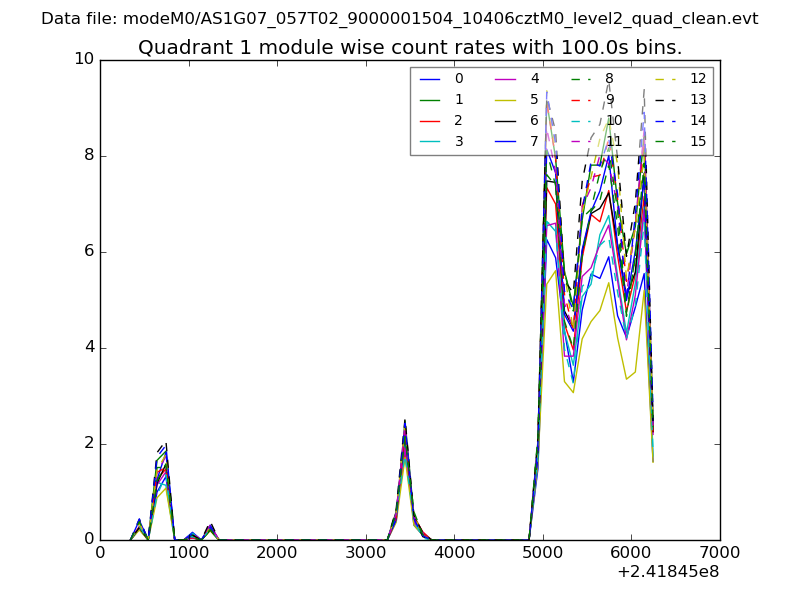
| Module-wise count rates for Quadrant A Data is divided into 100 sec bins |
 |
 |
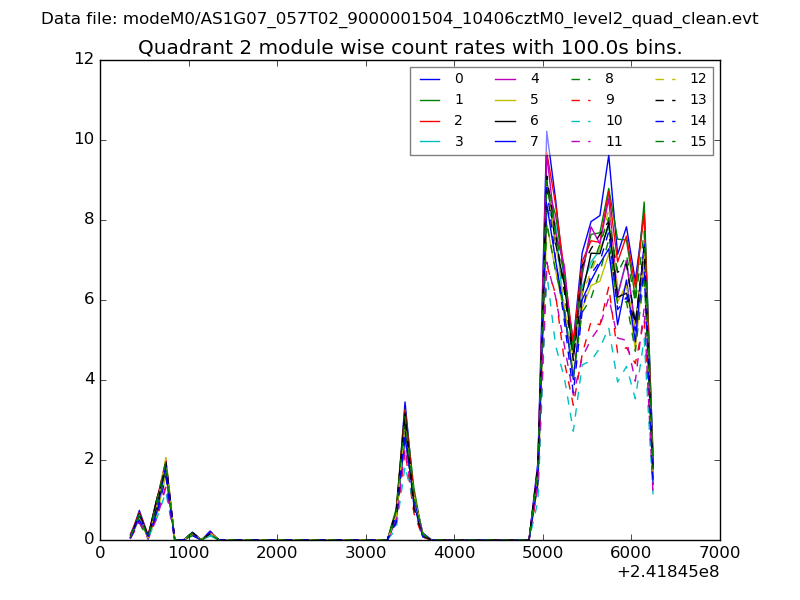
| Module-wise count rates for Quadrant B Data is divided into 100 sec bins |
 |
 |
| Module-wise count rates for Quadrant C Data is divided into 100 sec bins |
 |
 |
| Module-wise count rates for Quadrant D Data is divided into 100 sec bins |
 |
 |
| Parameter | Plot |
|---|---|
| CZT HV Monitor | 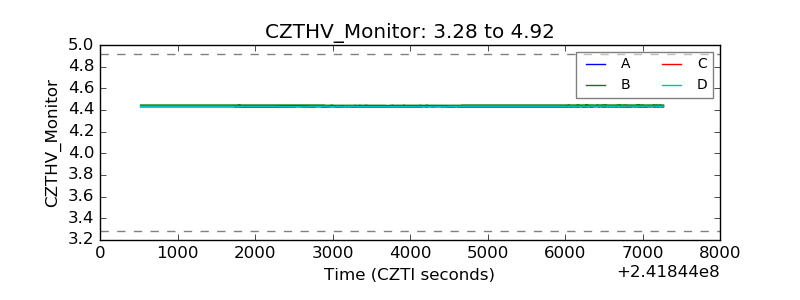 |
| D_VDD |  |
| Temperature 1 | 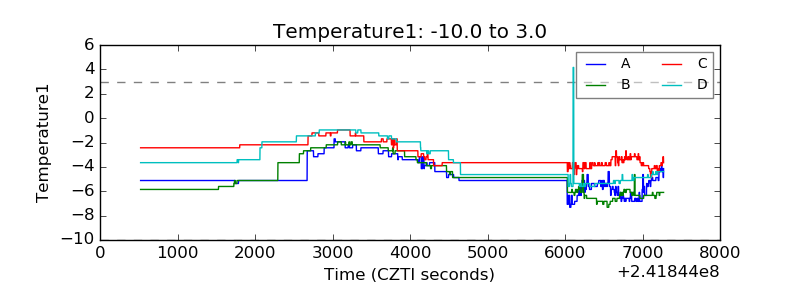 |
| Veto HV Monitor |  |
| Veto LLD | 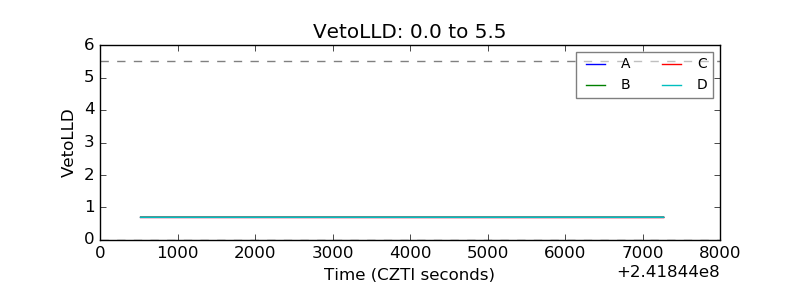 |
| Alpha Counter | 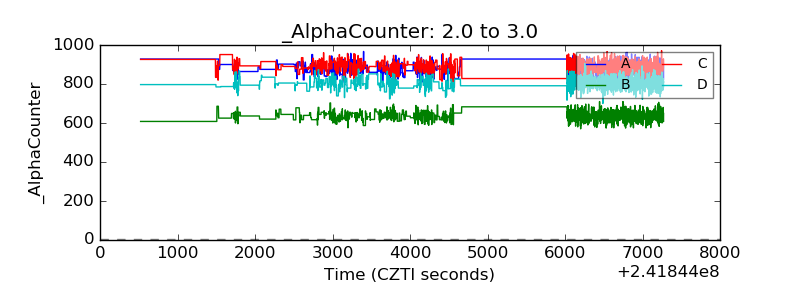 |
| _CPM_Rate | 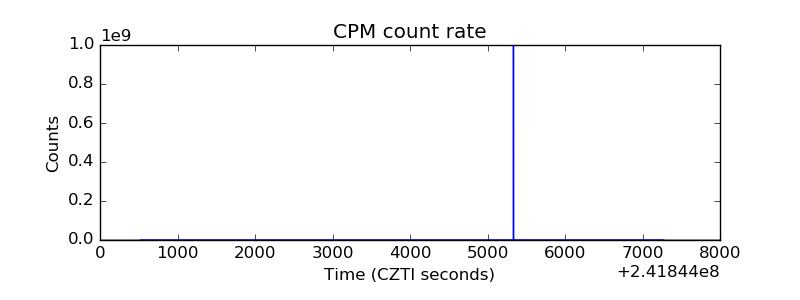 |
| CZT Counter | 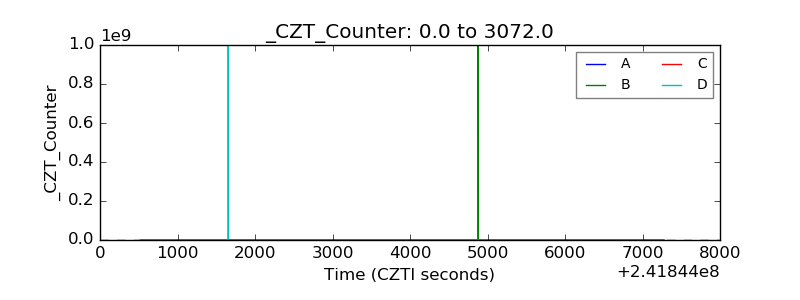 |
| +2.5 Volts monitor |  |
| +5 Volts monitor |  |
| _ROLL_ROT | 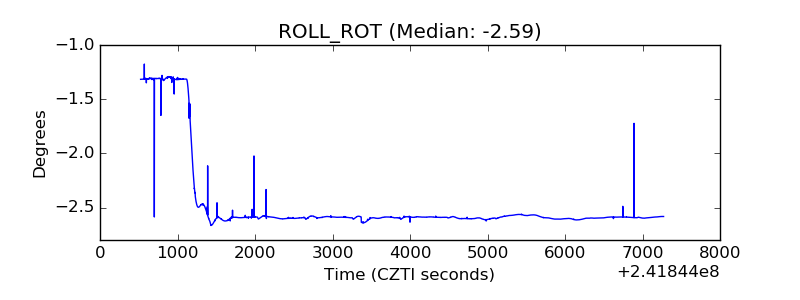 |
| _Roll_DEC | 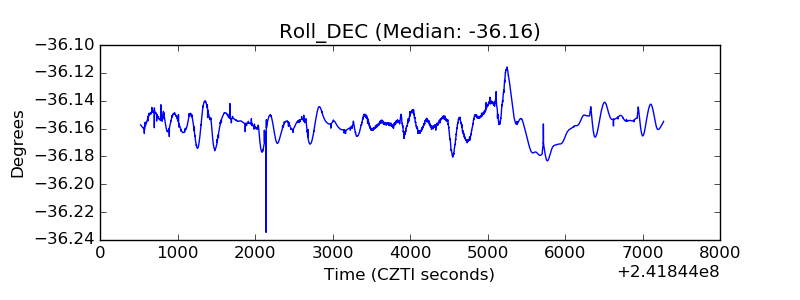 |
| _Roll_RA | 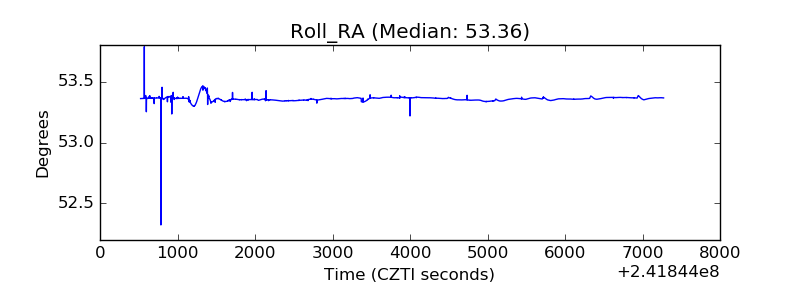 |
| Veto Counter | 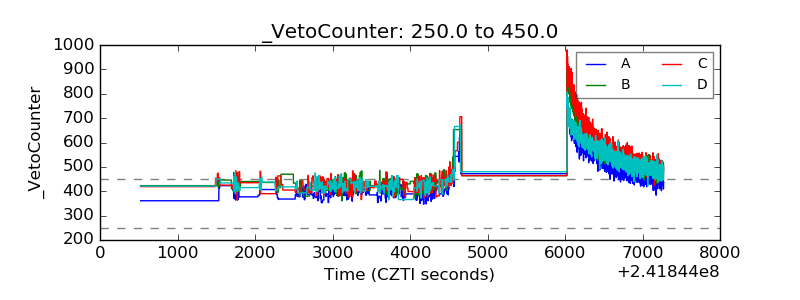 |