| Param | Original file | Final file |
|---|---|---|
| Filename | modeM0/AS1G07_057T02_9000001504_10408cztM0_level2.evt | modeM0/AS1G07_057T02_9000001504_10408cztM0_level2_quad_clean.evt |
| Size (bytes) | 2,522,456,640 | 485,524,800 |
| Size | 2.3 GB | 463.0 MB |
| Events in quadrant A | 16,745,284 | 2,992,340 |
| Events in quadrant B | 17,667,878 | 2,978,961 |
| Events in quadrant C | 16,576,427 | 3,041,396 |
| Events in quadrant D | 22,942,751 | 3,198,510 |
| Mode M0 | |||
|---|---|---|---|
| Quadrant | BADHDUFLAG | Total packets | Discarded packets |
| A | 0 | 177467 | 104030 |
| B | 0 | 210057 | 135559 |
| C | 0 | 182774 | 109315 |
| D | 0 | 224213 | 131323 |
| Mode M9 | |||
|---|---|---|---|
| Quadrant | BADHDUFLAG | Total packets | Discarded packets |
| A | 0 | 151 | 67 |
| B | 0 | 168 | 84 |
| C | 0 | 167 | 84 |
| D | 0 | 151 | 67 |
| Mode SS | |||
|---|---|---|---|
| Quadrant | BADHDUFLAG | Total packets | Discarded packets |
| A | 0 | 1820 | 1027 |
| B | 0 | 1818 | 1018 |
| C | 0 | 1819 | 1015 |
| D | 0 | 1746 | 945 |
| Quadrant | Total seconds | Saturated seconds | Saturation percentage |
|---|---|---|---|
| A | 35856 | 140 | 0.390451% |
| B | 34035 | 257 | 0.755105% |
| C | 36151 | 75 | 0.207463% |
| D | 38997 | 245 | 0.628253% |
Noise dominated data is calculated using 1-second bins in cleaned event files. If a bin has >2000 counts, and if more than 50% of those come from <1% of pixels, then it is considered to be noise-dominated and hence unusable.
| Quadrant | # 1 sec bins | Bins with >0 counts | Bins with >2000 counts | High rate bins dominated by noise | Noise dominated (total time) | Noise dominated (detector-on time) | Marked lightcurve |
|---|---|---|---|---|---|---|---|
| A | 55746 | 42417 | 0 | 0 | 0.00% | 0.00% | 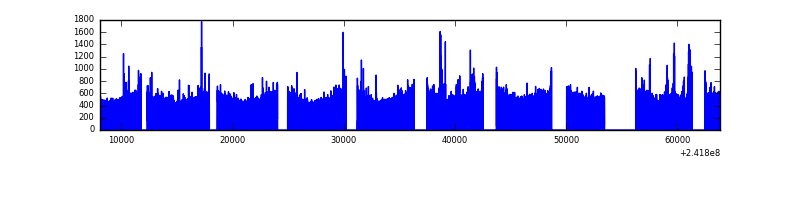 |
| B | 55746 | 40876 | 8 | 8 | 0.01% | 0.02% | 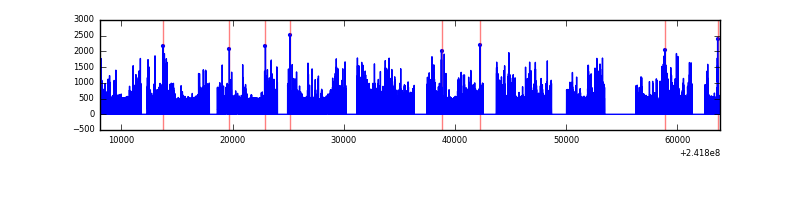 |
| C | 55746 | 42531 | 1 | 1 | 0.00% | 0.00% | 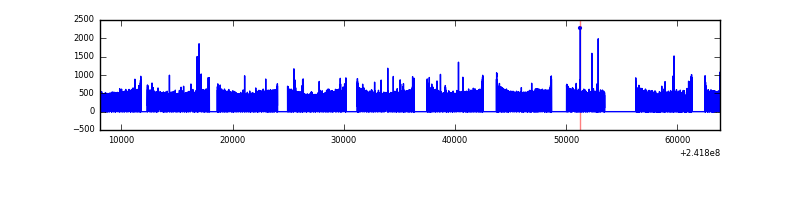 |
| D | 55746 | 42090 | 48 | 48 | 0.09% | 0.11% | 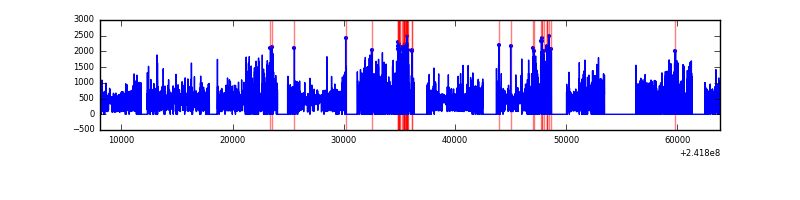 |
Top three noisy pixels from each quadrant. If the there are fewer than three noisy pixels in the level2.evt file, extra rows are filled as -1
| Pixel properties | Quadrant properties | ||||||
|---|---|---|---|---|---|---|---|
| Quadrant | DetID | PixID | Counts | Sigma | Mean | Median | Sigma |
| A | 13 | 251 | 189712 | 216.75 | 4257 | 4157 | 856.1 |
| A | 4 | 2 | 73293 | 80.76 | 4257 | 4157 | 856.1 |
| A | 0 | 226 | 39047 | 40.76 | 4257 | 4157 | 856.1 |
| B | 4 | 239 | 946074 | 1248.16 | 4045 | 3948 | 754.8 |
| B | 0 | 219 | 317056 | 414.81 | 4045 | 3948 | 754.8 |
| B | 11 | 51 | 278649 | 363.93 | 4045 | 3948 | 754.8 |
| C | 14 | 234 | 73456 | 71.35 | 4227 | 4257 | 969.9 |
| C | 13 | 61 | 31656 | 28.25 | 4227 | 4257 | 969.9 |
| C | 14 | 67 | 18081 | 14.25 | 4227 | 4257 | 969.9 |
| D | 8 | 195 | 2358192 | 2199.2 | 4502 | 4380 | 1070.3 |
| D | 1 | 52 | 1663331 | 1549.98 | 4502 | 4380 | 1070.3 |
| D | 1 | 20 | 1261619 | 1174.66 | 4502 | 4380 | 1070.3 |
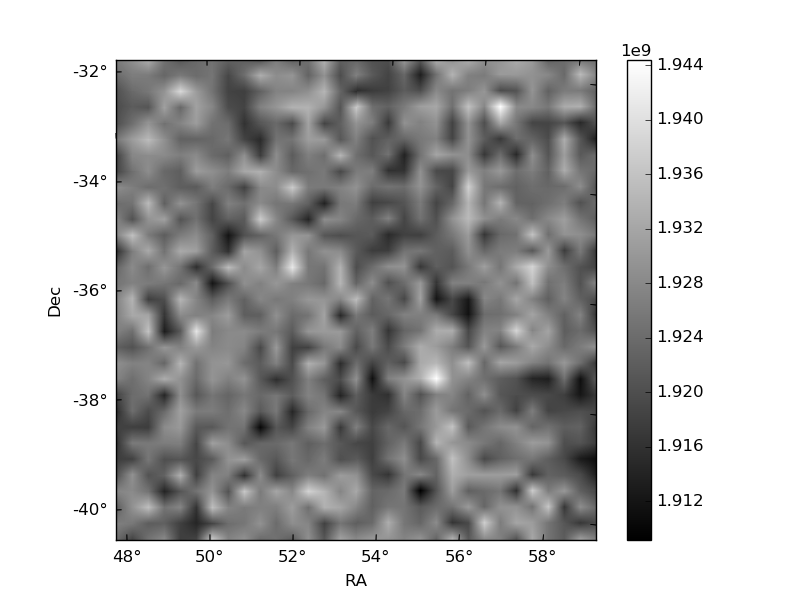
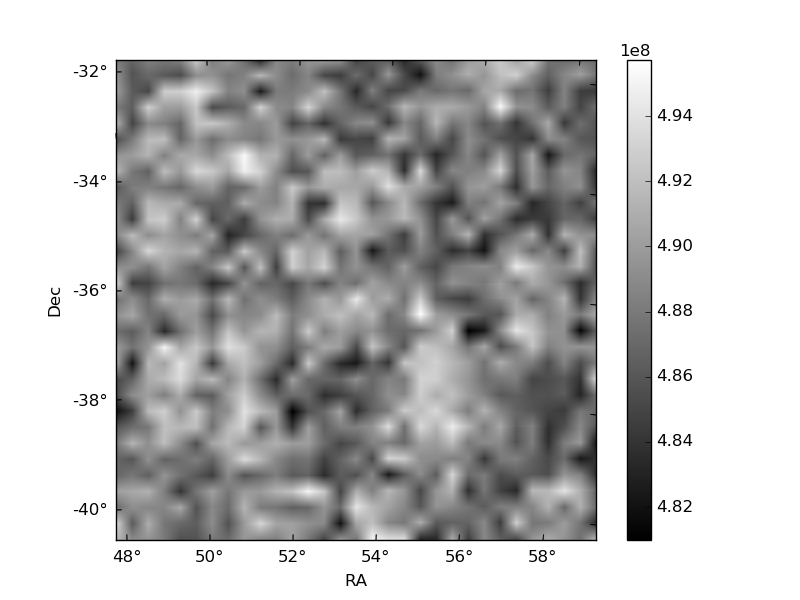
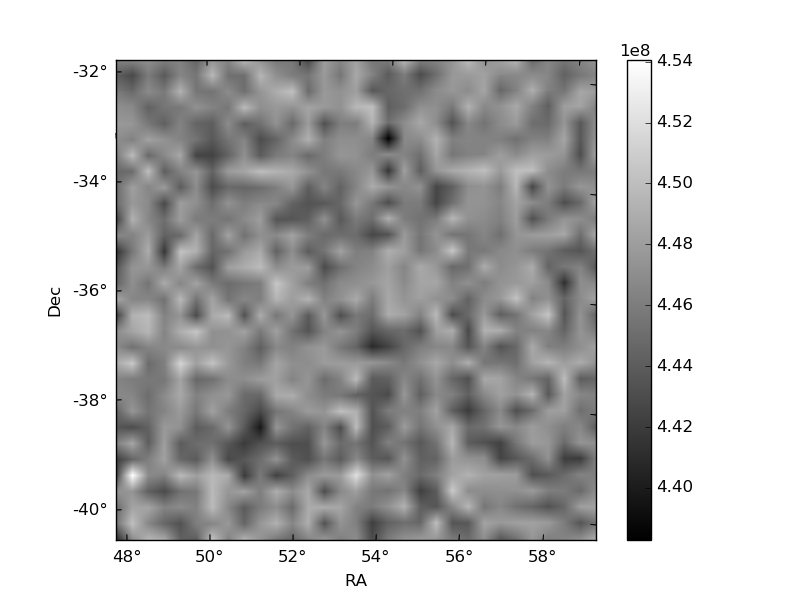
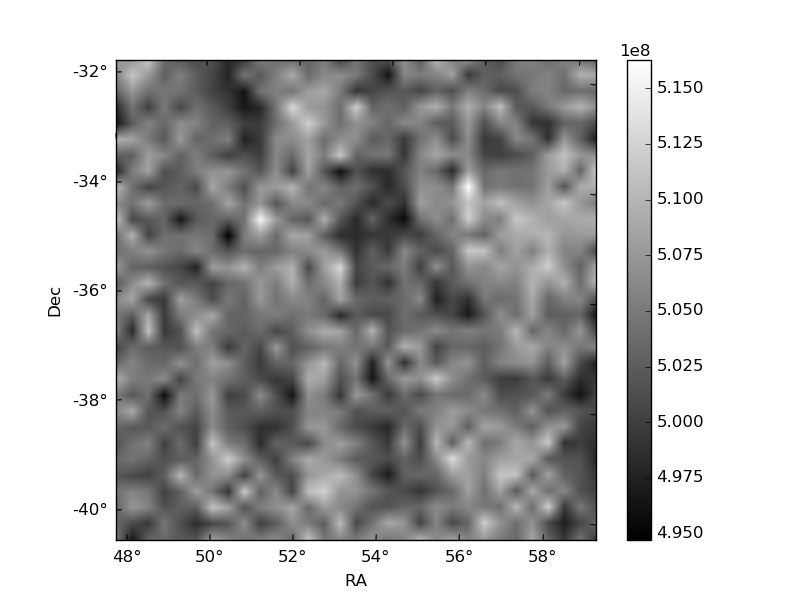
Histogram calculated using DETX and DETY for each event in the final _common_clean file
| Quadrant A | 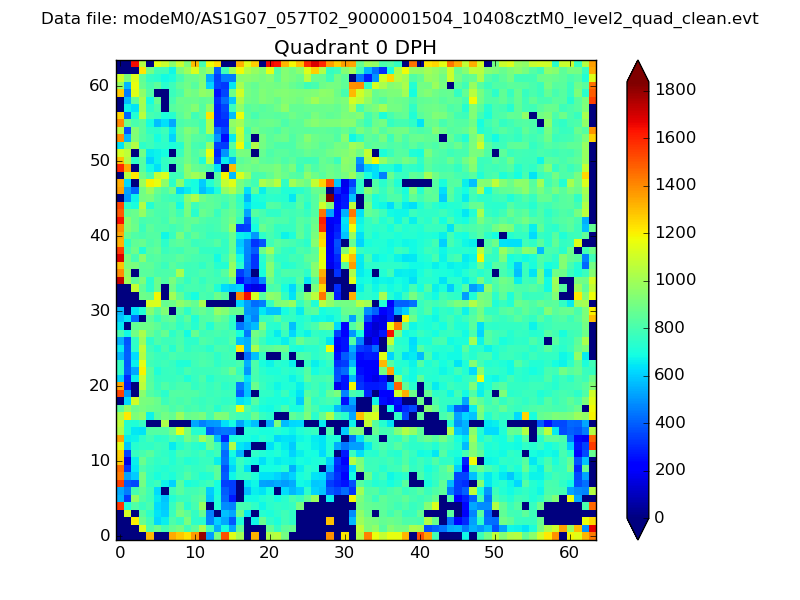 |
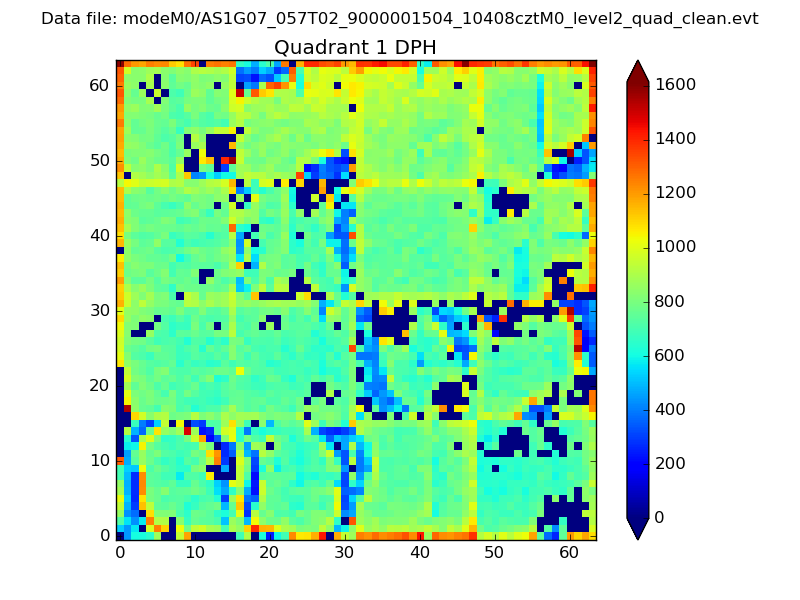 |
Quadrant B |
|---|---|---|---|
| Quadrant D | 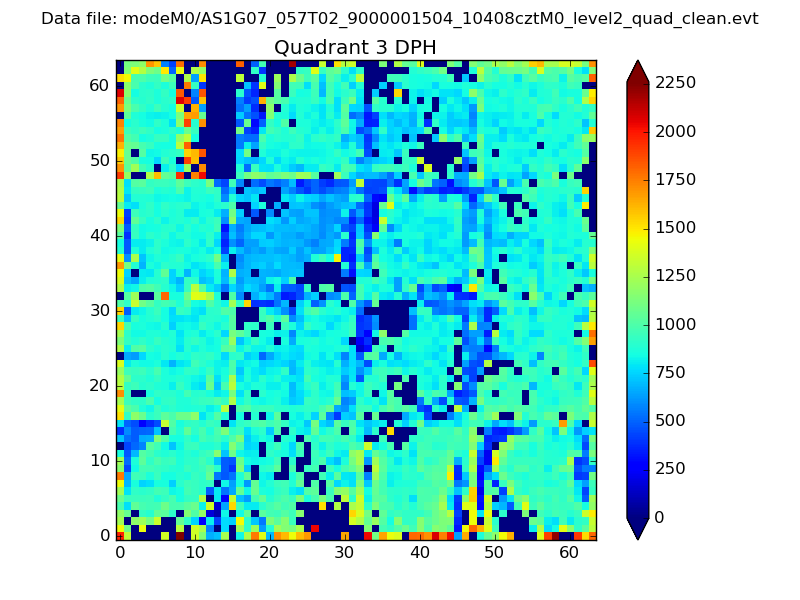 |
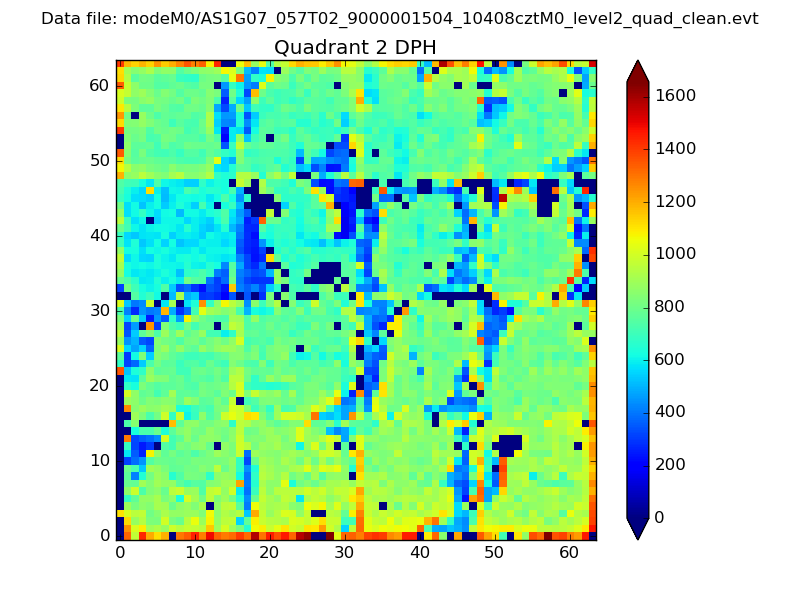 |
Quadrant C |
| Plot type | Count rate plots | Images |
|---|---|---|
| Comparison with Poisson distribution Blue bars denote a histogram of data divided into 1 sec bins. Red curve is a Poisson curve with rate = median count rate of data. |
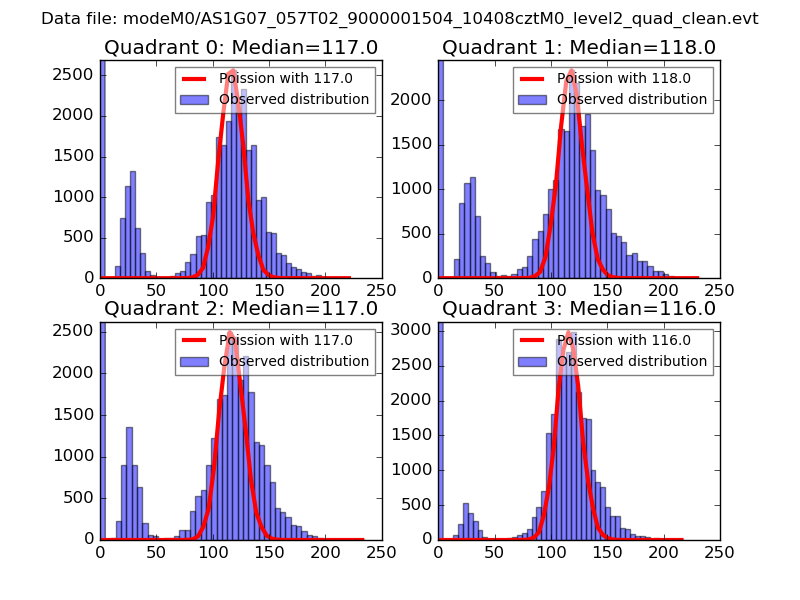 |
 |
| Quadrant-wise count rates Data is divided into 100 sec bins |
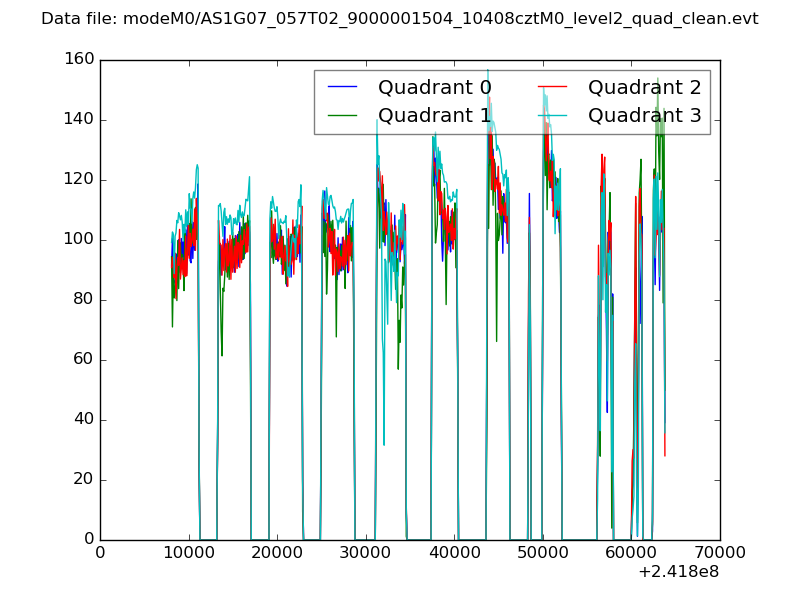 |
|
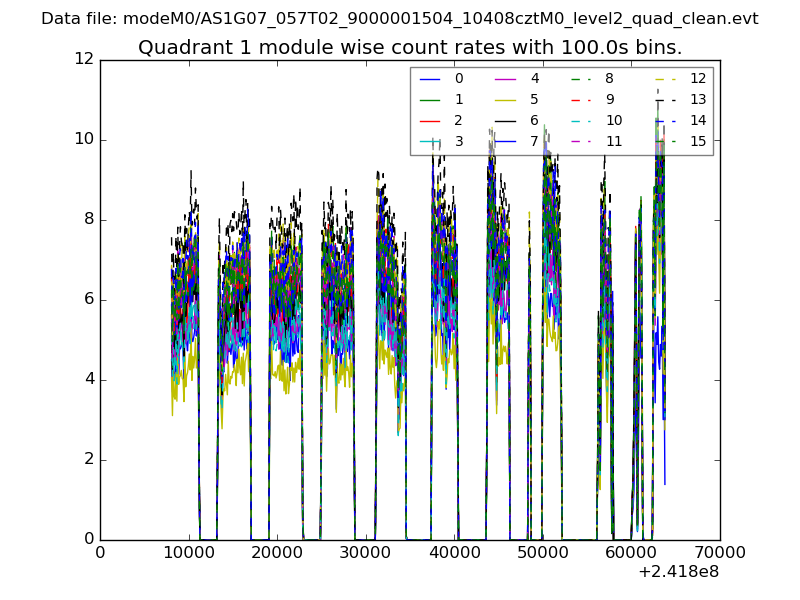
| Module-wise count rates for Quadrant A Data is divided into 100 sec bins |
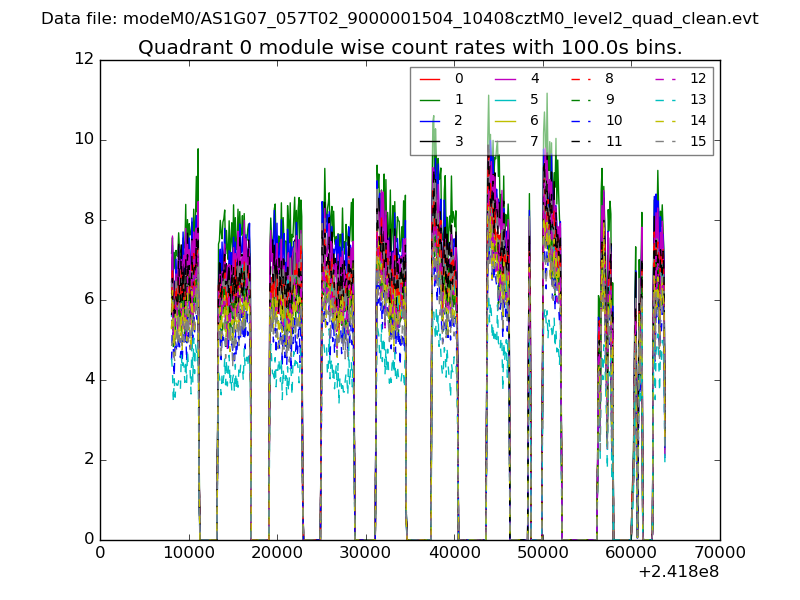 |
 |
| Module-wise count rates for Quadrant B Data is divided into 100 sec bins |
 |
 |
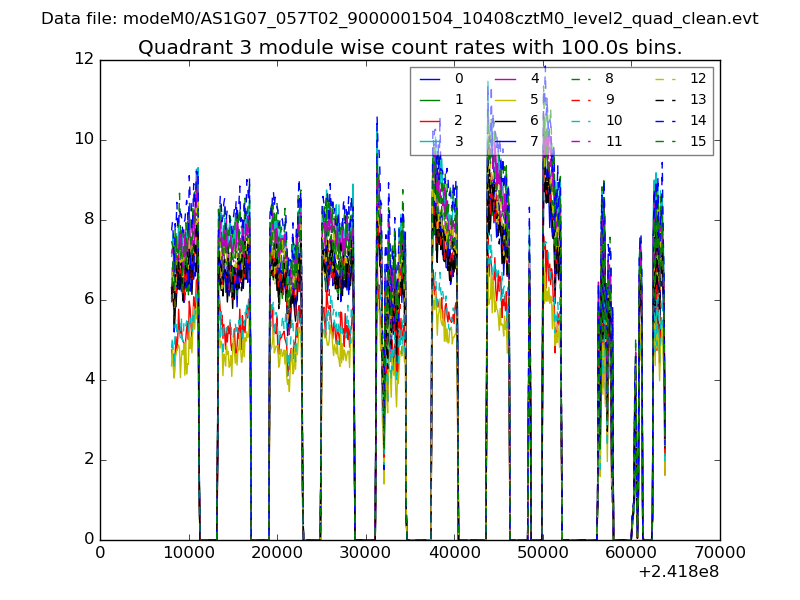
| Module-wise count rates for Quadrant C Data is divided into 100 sec bins |
 |
 |
| Module-wise count rates for Quadrant D Data is divided into 100 sec bins |
 |
 |
| Parameter | Plot |
|---|---|
| CZT HV Monitor | 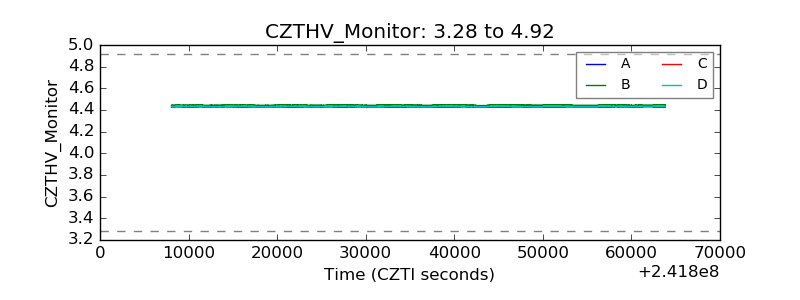 |
| D_VDD | 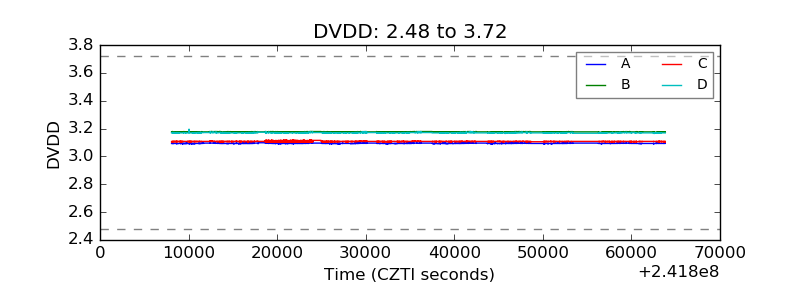 |
| Temperature 1 | 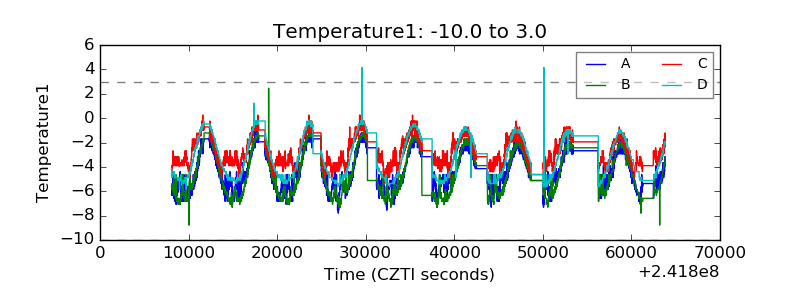 |
| Veto HV Monitor | 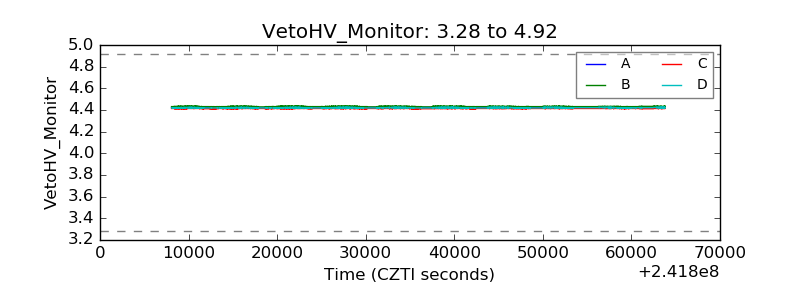 |
| Veto LLD | 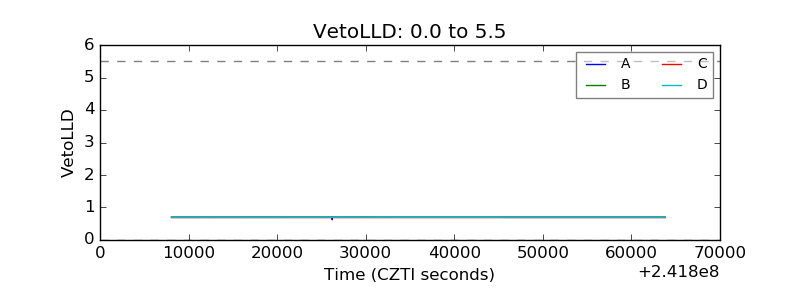 |
| Alpha Counter | 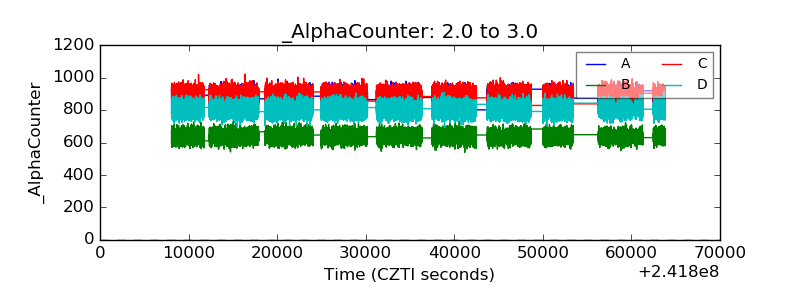 |
| _CPM_Rate | 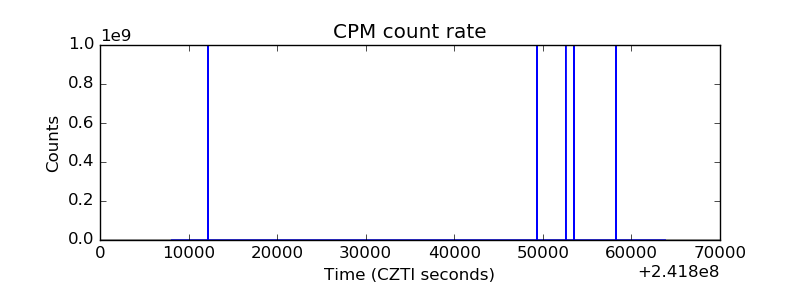 |
| CZT Counter | 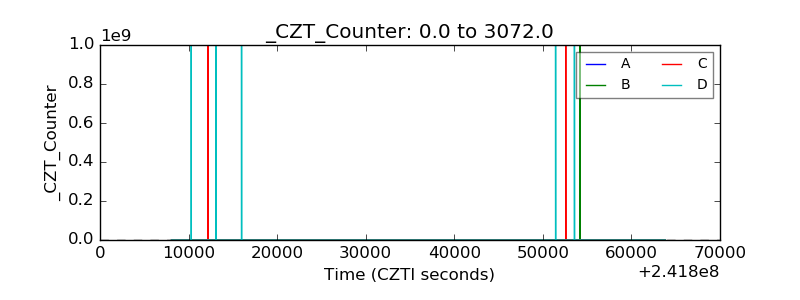 |
| +2.5 Volts monitor |  |
| +5 Volts monitor |  |
| _ROLL_ROT |  |
| _Roll_DEC | 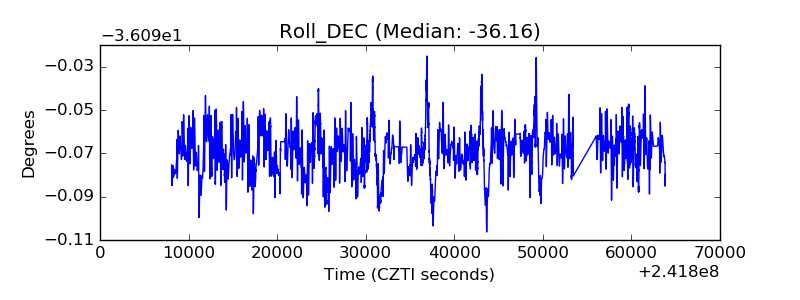 |
| _Roll_RA | 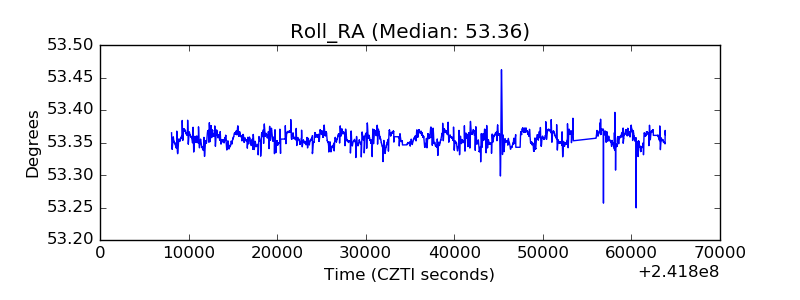 |
| Veto Counter | 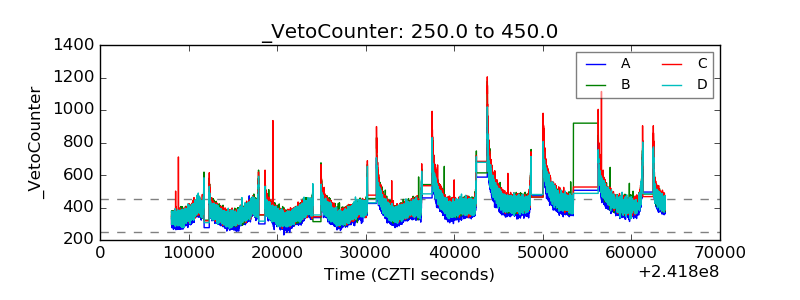 |