| Param | Original file | Final file |
|---|---|---|
| Filename | modeM0/AS1G07_057T02_9000001504_10409cztM0_level2.evt | modeM0/AS1G07_057T02_9000001504_10409cztM0_level2_quad_clean.evt |
| Size (bytes) | 523,800,000 | 77,973,120 |
| Size | 499.5 MB | 74.4 MB |
| Events in quadrant A | 3,531,894 | 487,240 |
| Events in quadrant B | 4,071,526 | 479,091 |
| Events in quadrant C | 3,021,949 | 481,241 |
| Events in quadrant D | 4,796,694 | 459,625 |
| Mode M0 | |||
|---|---|---|---|
| Quadrant | BADHDUFLAG | Total packets | Discarded packets |
| A | 0 | 14401 | 11 |
| B | 0 | 16216 | 3 |
| C | 0 | 13371 | 5 |
| D | 0 | 18637 | 19 |
| Mode M9 | |||
|---|---|---|---|
| Quadrant | BADHDUFLAG | Total packets | Discarded packets |
| A | 0 | 9 | 0 |
| B | 0 | 9 | 0 |
| C | 0 | 9 | 0 |
| D | 0 | 9 | 0 |
| Mode SS | |||
|---|---|---|---|
| Quadrant | BADHDUFLAG | Total packets | Discarded packets |
| A | 0 | 132 | 0 |
| B | 0 | 132 | 0 |
| C | 0 | 132 | 0 |
| D | 0 | 132 | 0 |
| Quadrant | Total seconds | Saturated seconds | Saturation percentage |
|---|---|---|---|
| A | 6504 | 143 | 2.198647% |
| B | 6507 | 332 | 5.102198% |
| C | 6506 | 101 | 1.552413% |
| D | 6503 | 242 | 3.721359% |
Noise dominated data is calculated using 1-second bins in cleaned event files. If a bin has >2000 counts, and if more than 50% of those come from <1% of pixels, then it is considered to be noise-dominated and hence unusable.
| Quadrant | # 1 sec bins | Bins with >0 counts | Bins with >2000 counts | High rate bins dominated by noise | Noise dominated (total time) | Noise dominated (detector-on time) | Marked lightcurve |
|---|---|---|---|---|---|---|---|
| A | 7348 | 6508 | 2 | 2 | 0.03% | 0.03% | 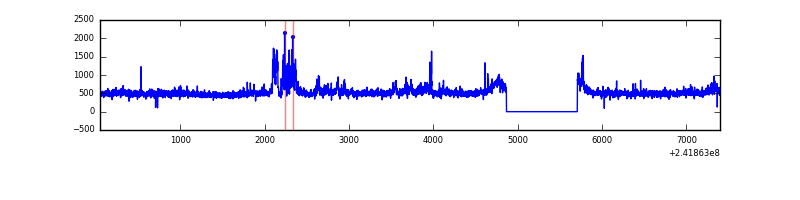 |
| B | 7348 | 6508 | 137 | 137 | 1.86% | 2.11% | 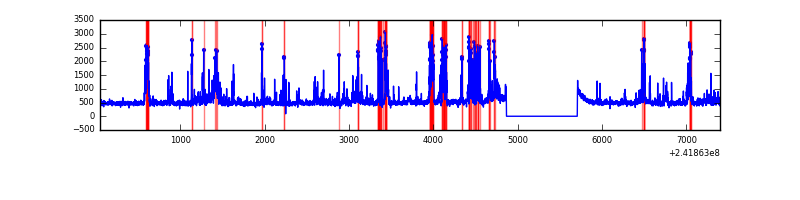 |
| C | 7348 | 6508 | 1 | 1 | 0.01% | 0.02% | 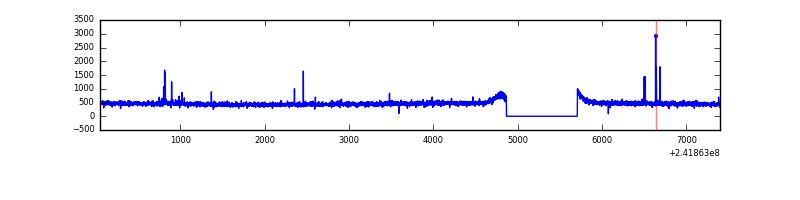 |
| D | 7348 | 6508 | 124 | 124 | 1.69% | 1.91% | 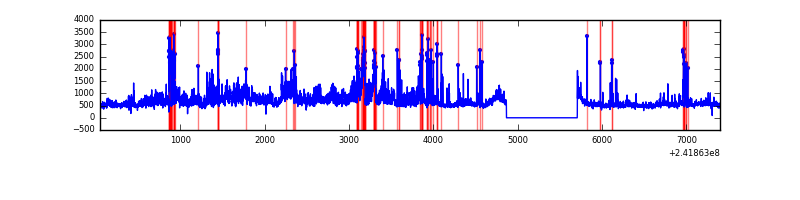 |
Top three noisy pixels from each quadrant. If the there are fewer than three noisy pixels in the level2.evt file, extra rows are filled as -1
| Pixel properties | Quadrant properties | ||||||
|---|---|---|---|---|---|---|---|
| Quadrant | DetID | PixID | Counts | Sigma | Mean | Median | Sigma |
| A | 13 | 251 | 487115 | 3024.39 | 786 | 767 | 160.8 |
| A | 4 | 2 | 10497 | 60.51 | 786 | 767 | 160.8 |
| A | 0 | 226 | 7189 | 39.94 | 786 | 767 | 160.8 |
| B | 4 | 239 | 686116 | 4649.89 | 773 | 752 | 147.4 |
| B | 10 | 245 | 149868 | 1011.69 | 773 | 752 | 147.4 |
| B | 0 | 219 | 85807 | 577.06 | 773 | 752 | 147.4 |
| C | 14 | 234 | 30213 | 165.63 | 767 | 771 | 177.8 |
| C | 13 | 61 | 5636 | 27.37 | 767 | 771 | 177.8 |
| C | 3 | 202 | 1889 | 6.29 | 767 | 771 | 177.8 |
| D | 1 | 20 | 570765 | 3123.33 | 763 | 742 | 182.5 |
| D | 1 | 52 | 492955 | 2696.98 | 763 | 742 | 182.5 |
| D | 12 | 233 | 370495 | 2025.99 | 763 | 742 | 182.5 |
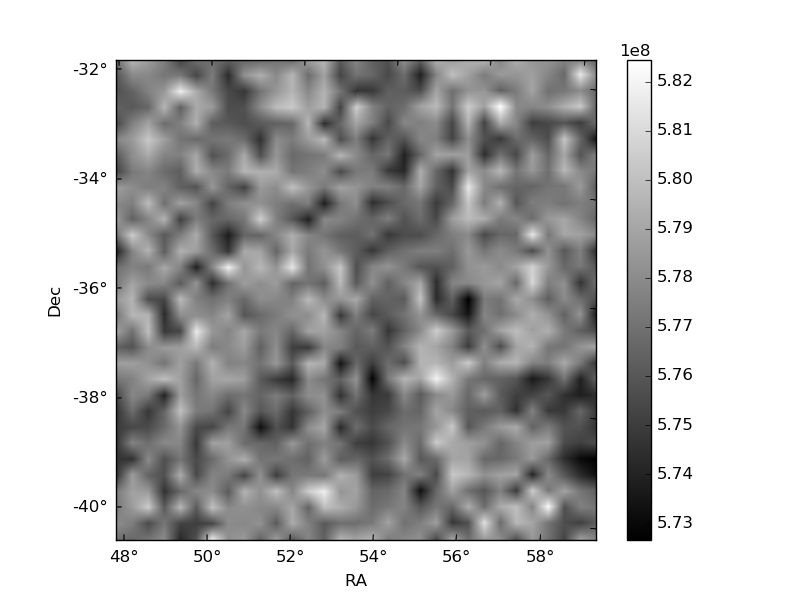
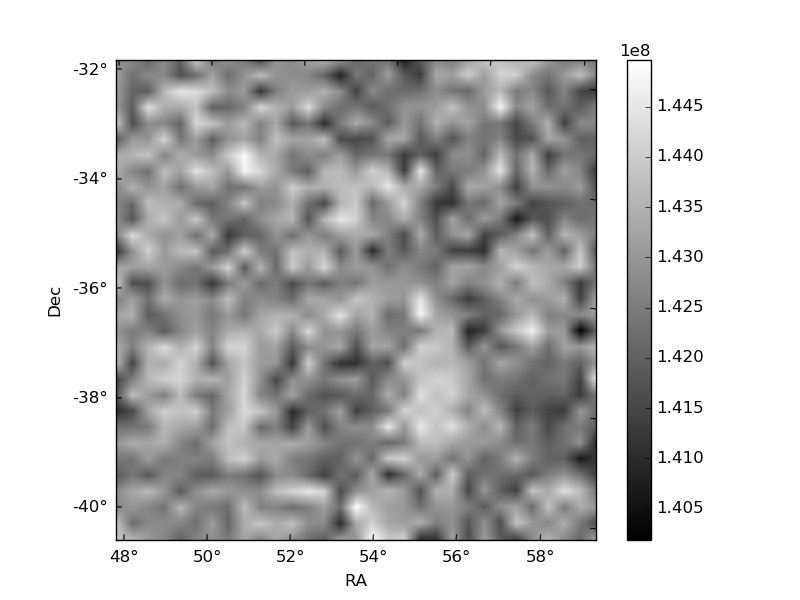
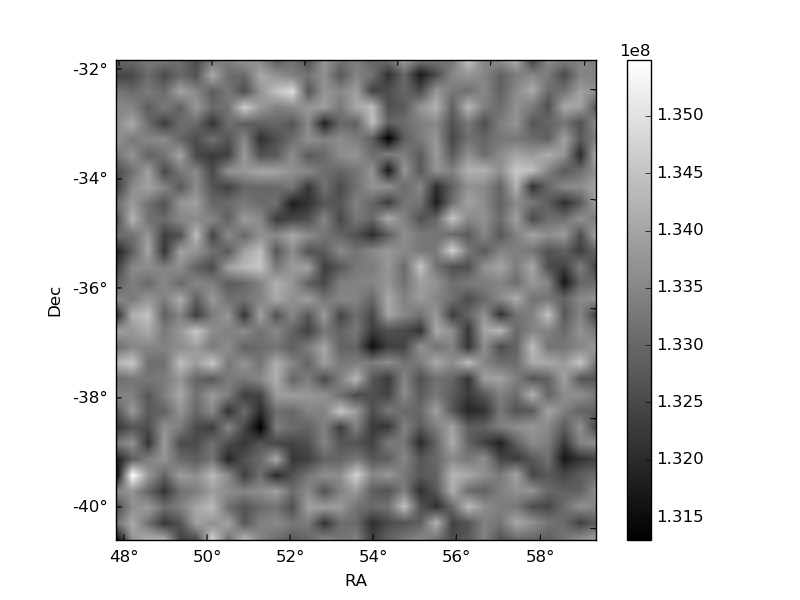
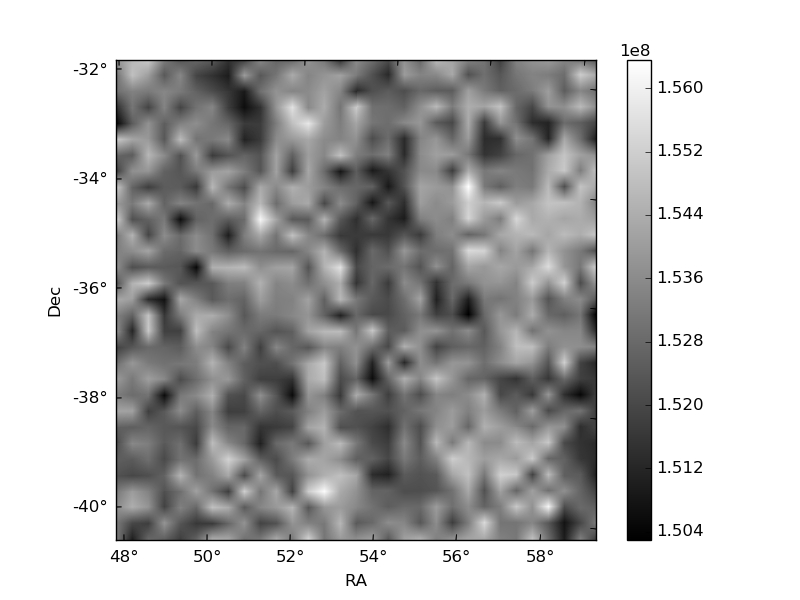
Histogram calculated using DETX and DETY for each event in the final _common_clean file
| Quadrant A | 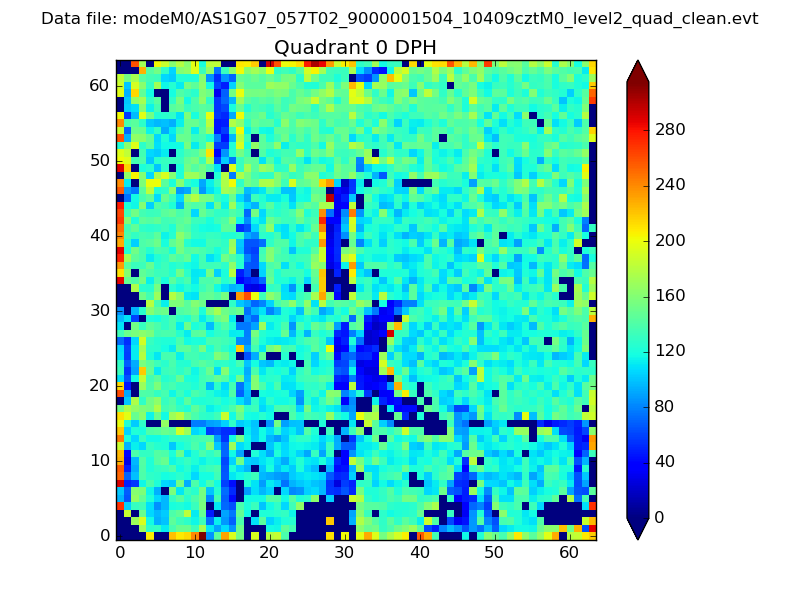 |
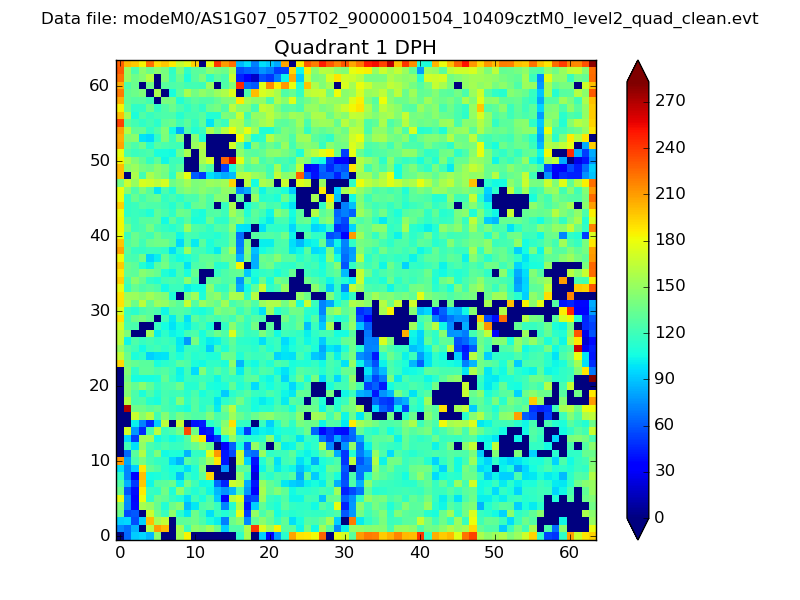 |
Quadrant B |
|---|---|---|---|
| Quadrant D | 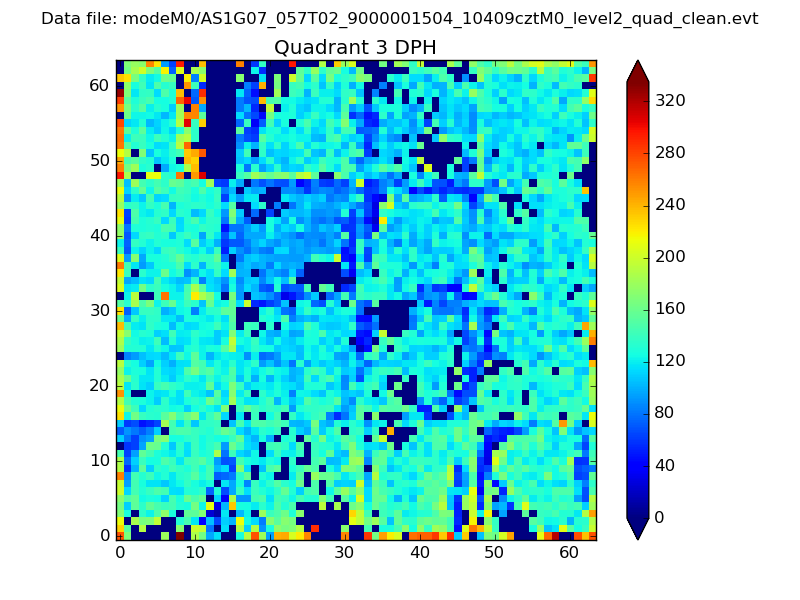 |
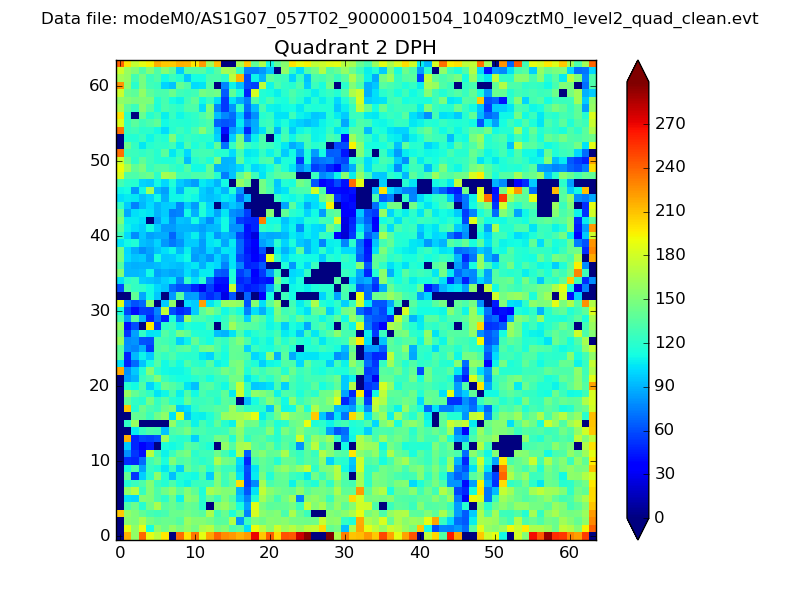 |
Quadrant C |
| Plot type | Count rate plots | Images |
|---|---|---|
| Comparison with Poisson distribution Blue bars denote a histogram of data divided into 1 sec bins. Red curve is a Poisson curve with rate = median count rate of data. |
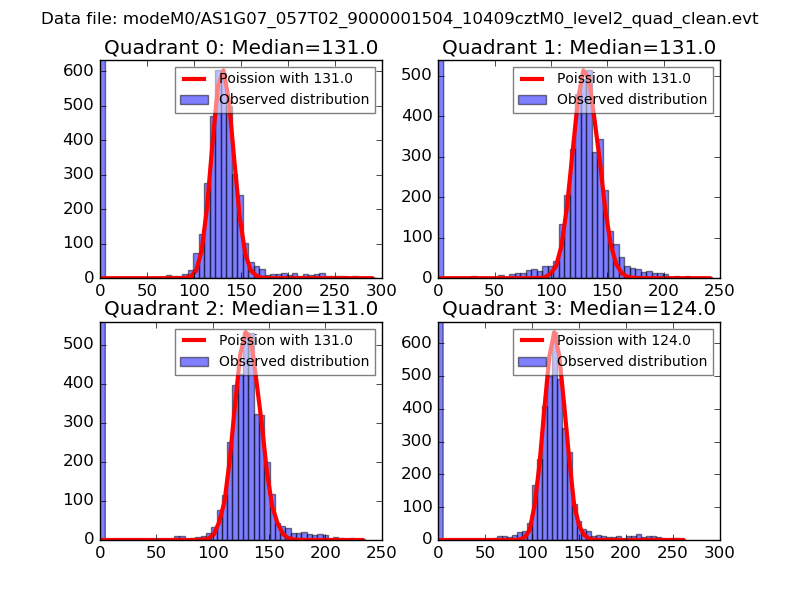 |
 |
| Quadrant-wise count rates Data is divided into 100 sec bins |
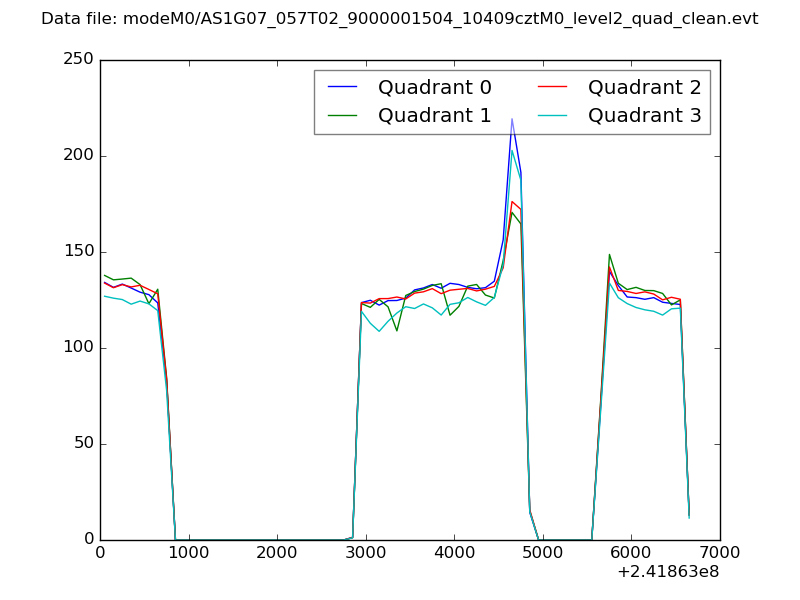 |
|
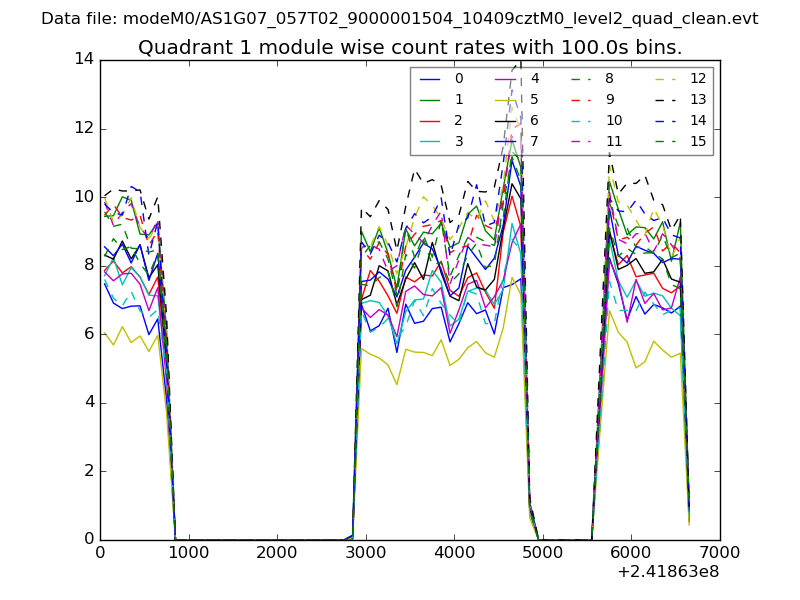
| Module-wise count rates for Quadrant A Data is divided into 100 sec bins |
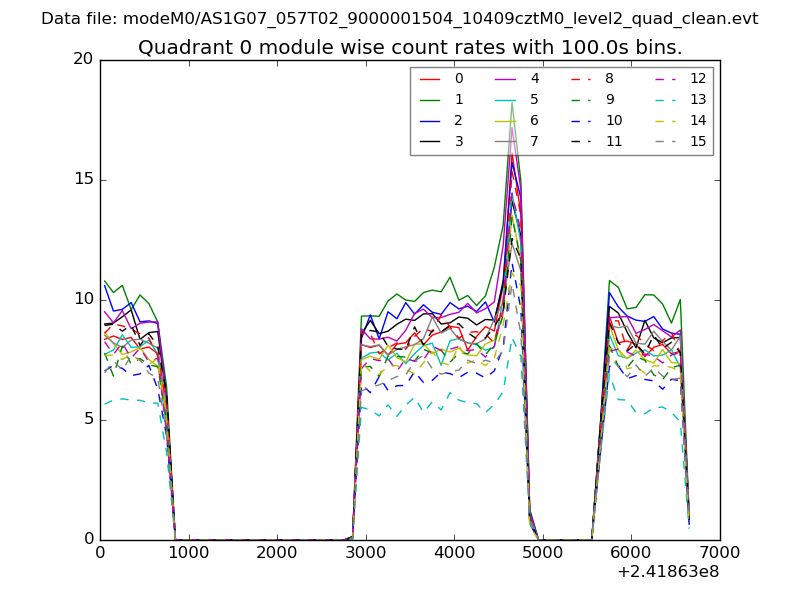 |
 |
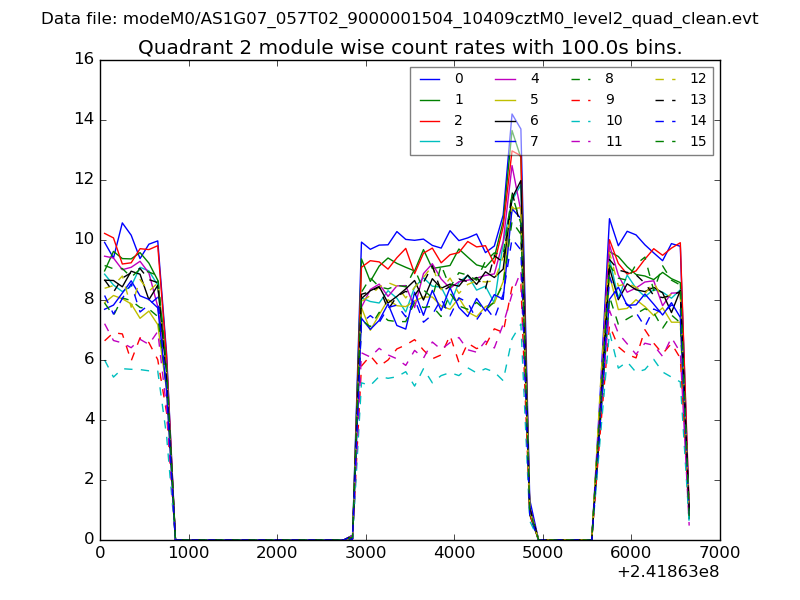
| Module-wise count rates for Quadrant B Data is divided into 100 sec bins |
 |
 |
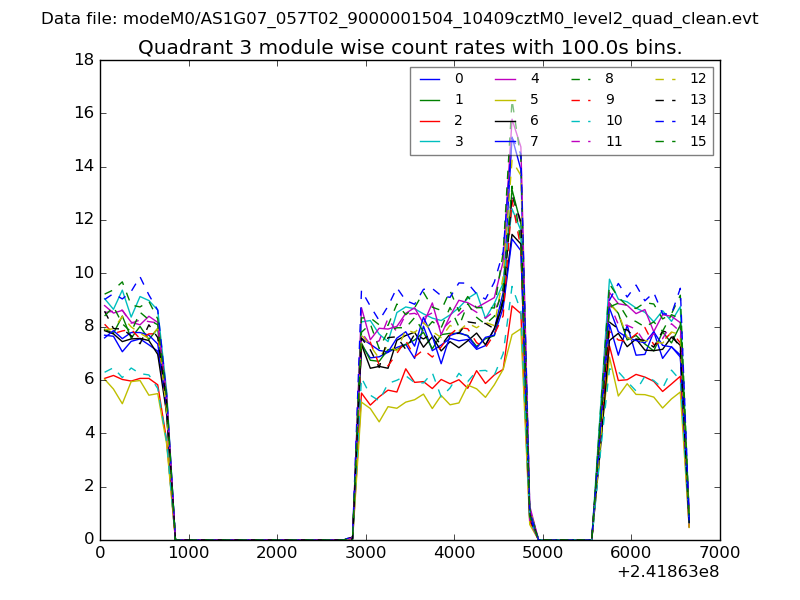
| Module-wise count rates for Quadrant C Data is divided into 100 sec bins |
 |
 |
| Module-wise count rates for Quadrant D Data is divided into 100 sec bins |
 |
 |
| Parameter | Plot |
|---|---|
| CZT HV Monitor | 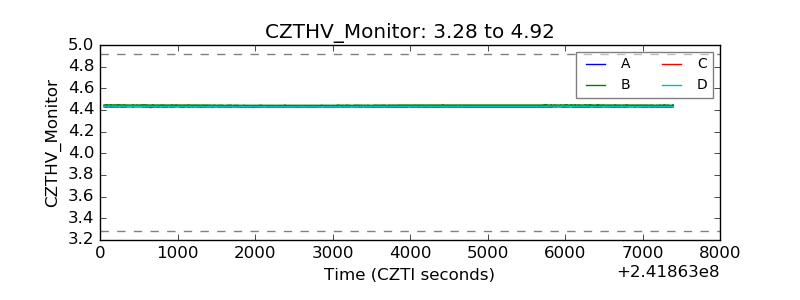 |
| D_VDD |  |
| Temperature 1 | 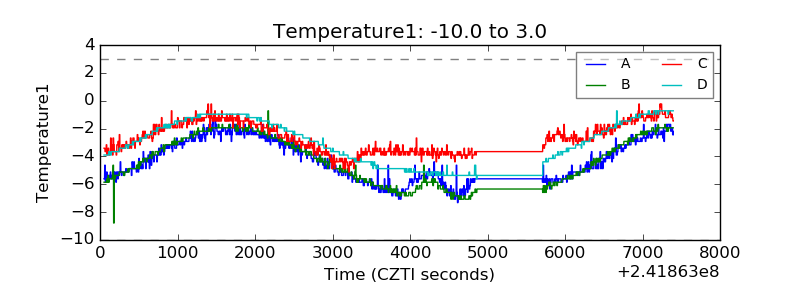 |
| Veto HV Monitor | 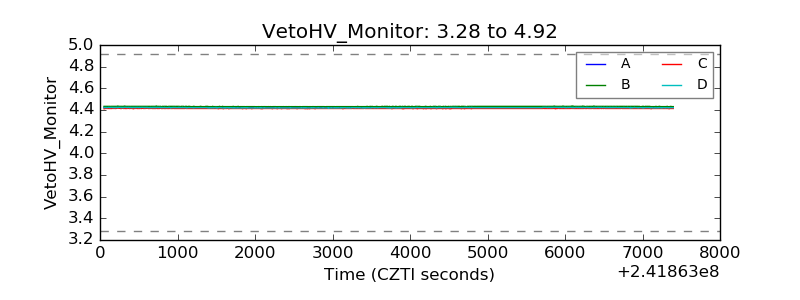 |
| Veto LLD | 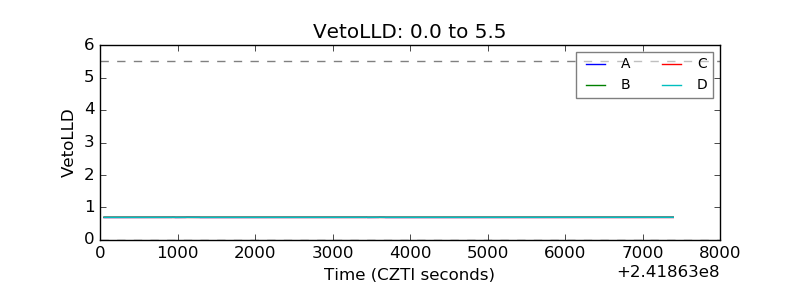 |
| Alpha Counter | 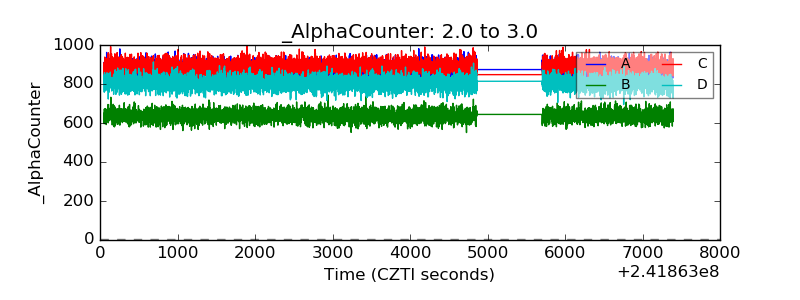 |
| _CPM_Rate | 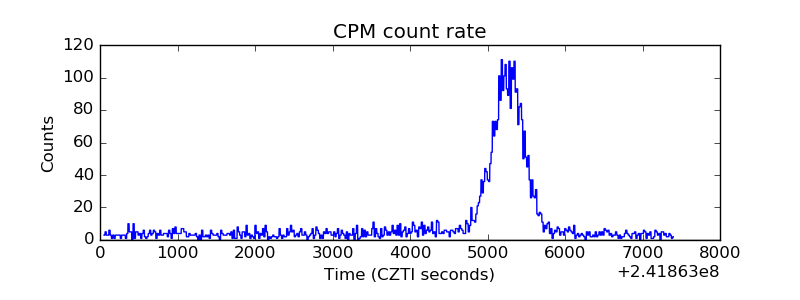 |
| CZT Counter | 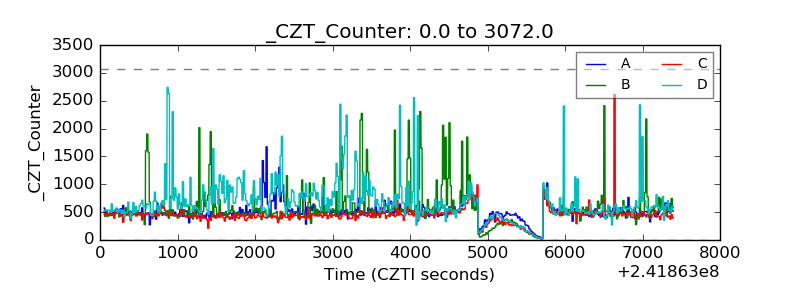 |
| +2.5 Volts monitor |  |
| +5 Volts monitor |  |
| _ROLL_ROT | 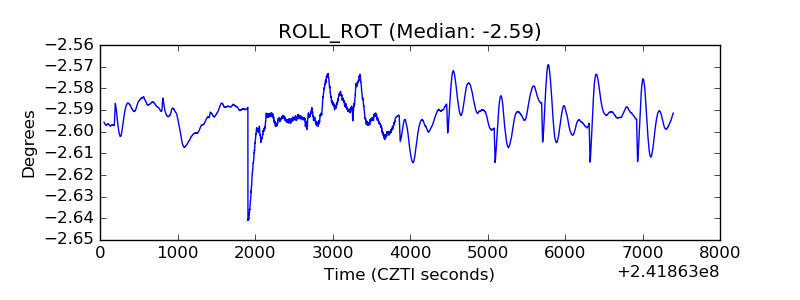 |
| _Roll_DEC | 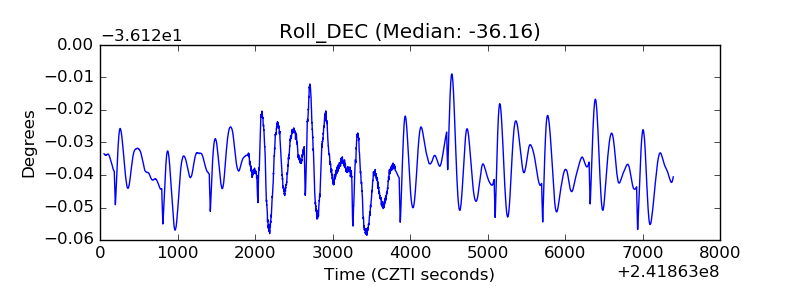 |
| _Roll_RA | 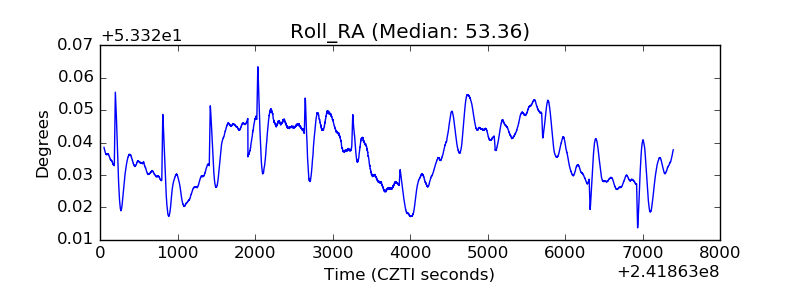 |
| Veto Counter | 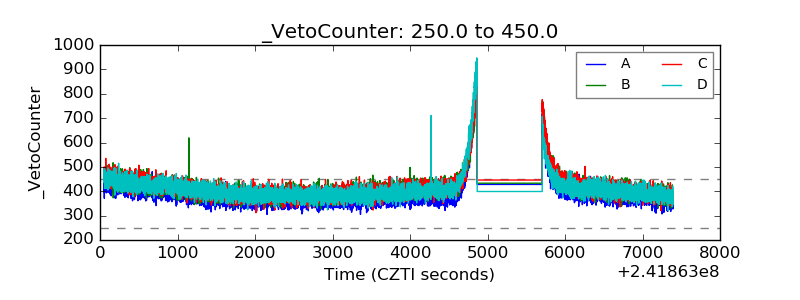 |