| Param | Original file | Final file |
|---|---|---|
| Filename | modeM0/AS1G07_057T02_9000001504_10410cztM0_level2.evt | modeM0/AS1G07_057T02_9000001504_10410cztM0_level2_quad_clean.evt |
| Size (bytes) | 153,368,640 | 12,890,880 |
| Size | 146.3 MB | 12.3 MB |
| Events in quadrant A | 1,096,269 | 60,492 |
| Events in quadrant B | 1,074,533 | 57,229 |
| Events in quadrant C | 949,839 | 60,687 |
| Events in quadrant D | 1,374,652 | 55,410 |
| Mode M0 | |||
|---|---|---|---|
| Quadrant | BADHDUFLAG | Total packets | Discarded packets |
| A | 0 | 12937 | 8419 |
| B | 0 | 15288 | 10808 |
| C | 0 | 12894 | 8456 |
| D | 0 | 16643 | 11153 |
| Mode M9 | |||
|---|---|---|---|
| Quadrant | BADHDUFLAG | Total packets | Discarded packets |
| A | 1 | 273359709408 | 0 |
| B | 1 | -1 | -1 |
| C | 1 | -1 | -1 |
| D | 1 | -1 | -1 |
| Mode SS | |||
|---|---|---|---|
| Quadrant | BADHDUFLAG | Total packets | Discarded packets |
| A | 0 | 127 | 78 |
| B | 0 | 128 | 87 |
| C | 0 | 128 | 89 |
| D | 0 | 125 | 80 |
| Quadrant | Total seconds | Saturated seconds | Saturation percentage |
|---|---|---|---|
| A | 2166 | 0 | 0.000000% |
| B | 2044 | 7 | 0.342466% |
| C | 2216 | 0 | 0.000000% |
| D | 2207 | 3 | 0.135931% |
Noise dominated data is calculated using 1-second bins in cleaned event files. If a bin has >2000 counts, and if more than 50% of those come from <1% of pixels, then it is considered to be noise-dominated and hence unusable.
| Quadrant | # 1 sec bins | Bins with >0 counts | Bins with >2000 counts | High rate bins dominated by noise | Noise dominated (total time) | Noise dominated (detector-on time) | Marked lightcurve |
|---|---|---|---|---|---|---|---|
| A | 3212 | 2708 | 0 | 0 | 0.00% | 0.00% | 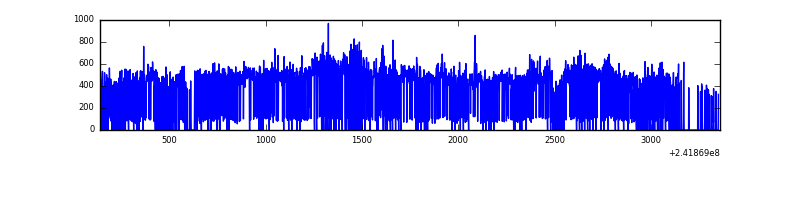 |
| B | 3193 | 2575 | 1 | 1 | 0.03% | 0.04% | 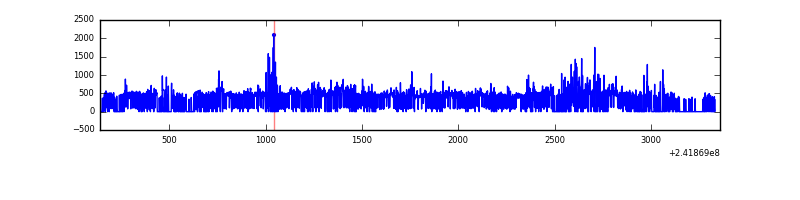 |
| C | 3217 | 2732 | 0 | 0 | 0.00% | 0.00% | 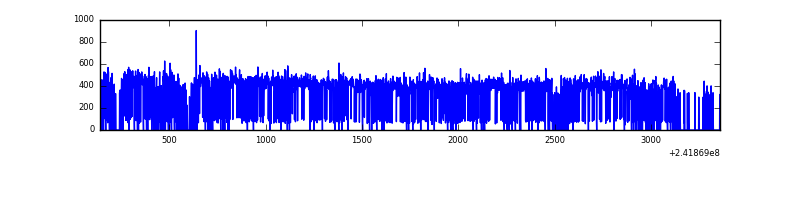 |
| D | 3197 | 2656 | 1 | 1 | 0.03% | 0.04% | 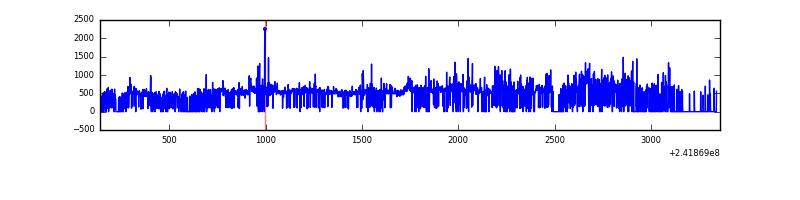 |
Top three noisy pixels from each quadrant. If the there are fewer than three noisy pixels in the level2.evt file, extra rows are filled as -1
| Pixel properties | Quadrant properties | ||||||
|---|---|---|---|---|---|---|---|
| Quadrant | DetID | PixID | Counts | Sigma | Mean | Median | Sigma |
| A | 13 | 251 | 138917 | 2654.58 | 244 | 238 | 52.2 |
| A | 4 | 2 | 14664 | 276.14 | 244 | 238 | 52.2 |
| A | 0 | 226 | 2218 | 37.9 | 244 | 238 | 52.2 |
| B | 4 | 239 | 96855 | 2149.48 | 228 | 222 | 45.0 |
| B | 11 | 51 | 38391 | 849.02 | 228 | 222 | 45.0 |
| B | 0 | 219 | 16793 | 368.6 | 228 | 222 | 45.0 |
| C | 14 | 234 | 3237 | 52.8 | 242 | 244 | 56.7 |
| C | 13 | 61 | 1801 | 27.47 | 242 | 244 | 56.7 |
| C | 14 | 67 | 935 | 12.19 | 242 | 244 | 56.7 |
| D | 8 | 195 | 172893 | 2884.06 | 242 | 235 | 59.9 |
| D | 1 | 52 | 93652 | 1560.43 | 242 | 235 | 59.9 |
| D | 1 | 20 | 85714 | 1427.83 | 242 | 235 | 59.9 |
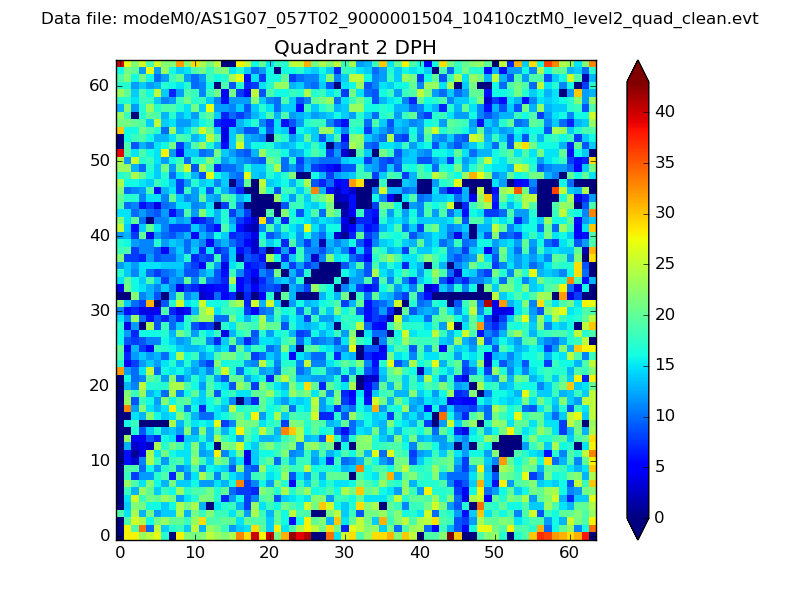
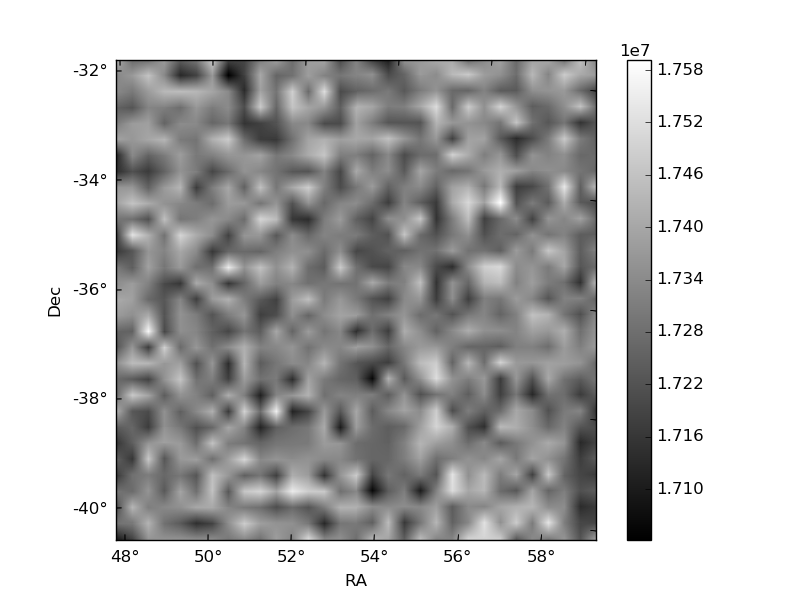
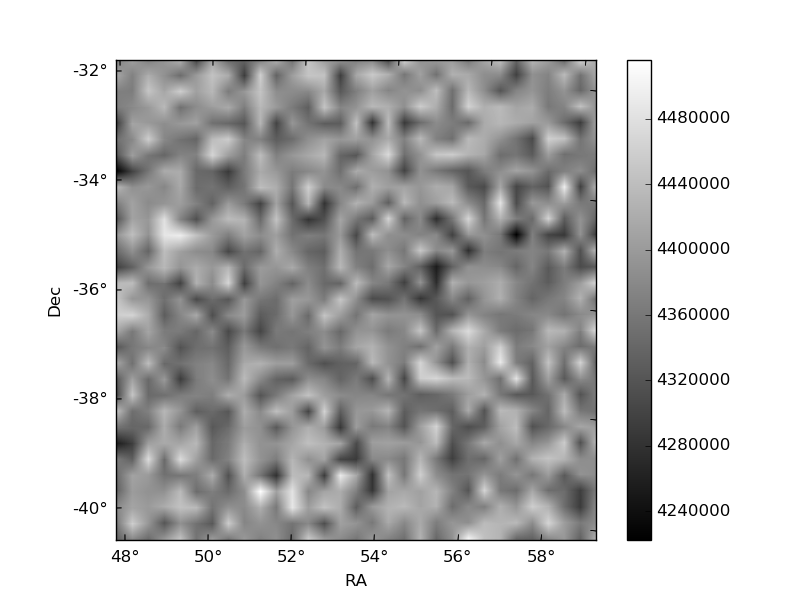
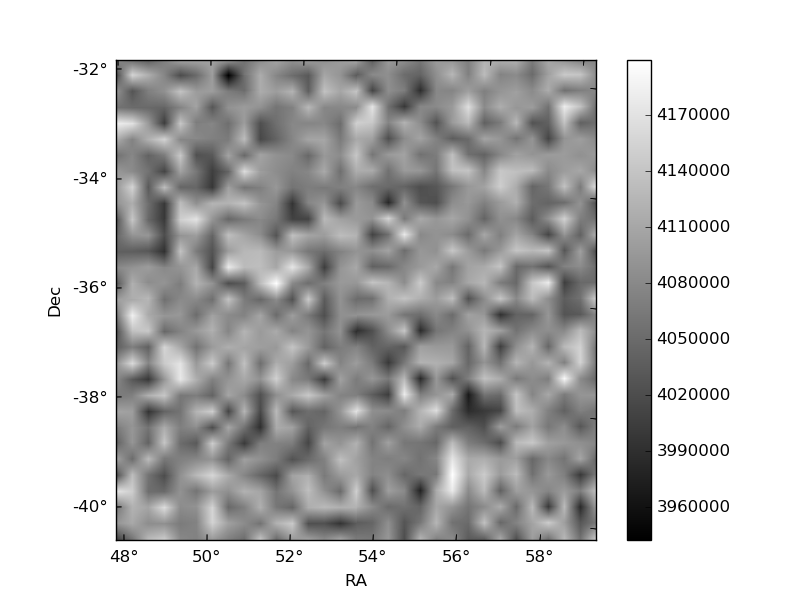
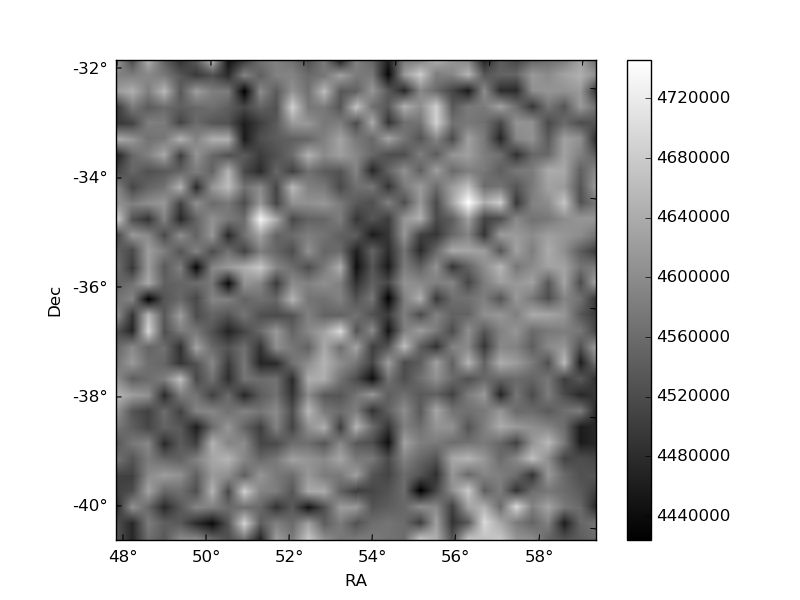
Histogram calculated using DETX and DETY for each event in the final _common_clean file
| Quadrant A | 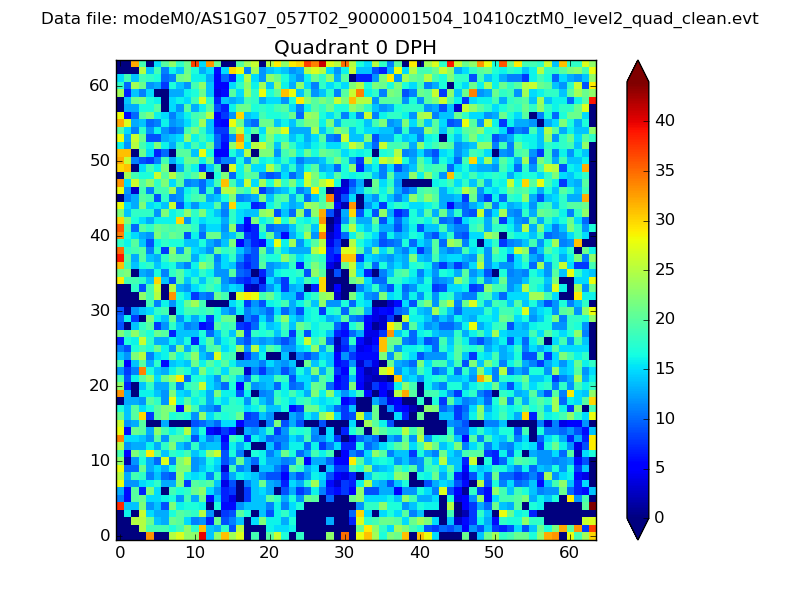 |
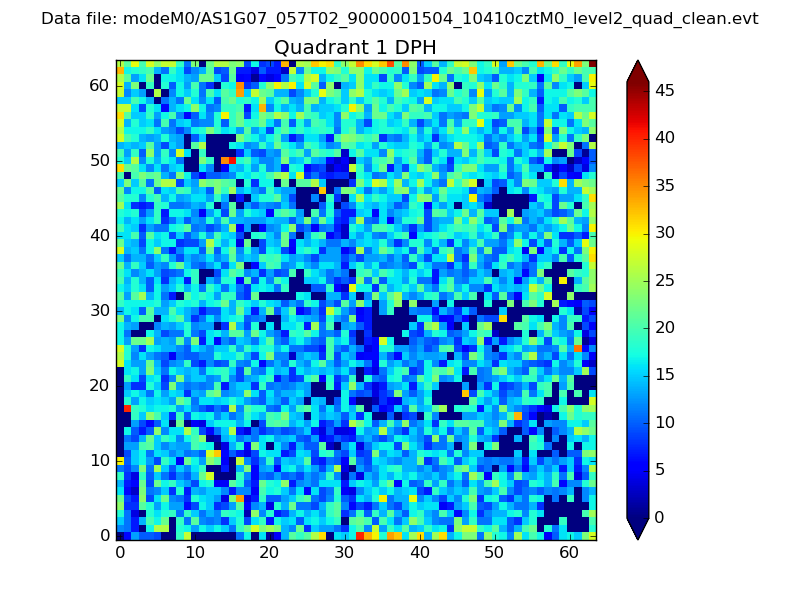 |
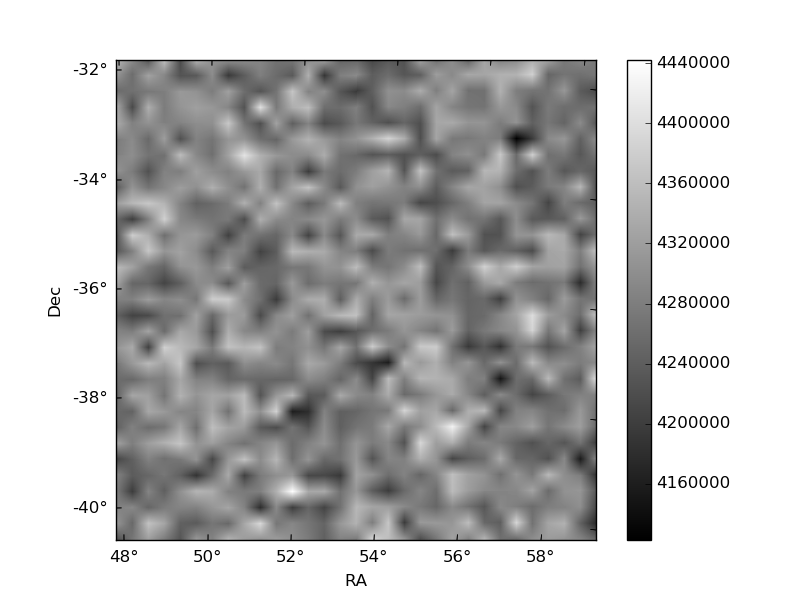
Quadrant B |
|---|---|---|---|
| Quadrant D | 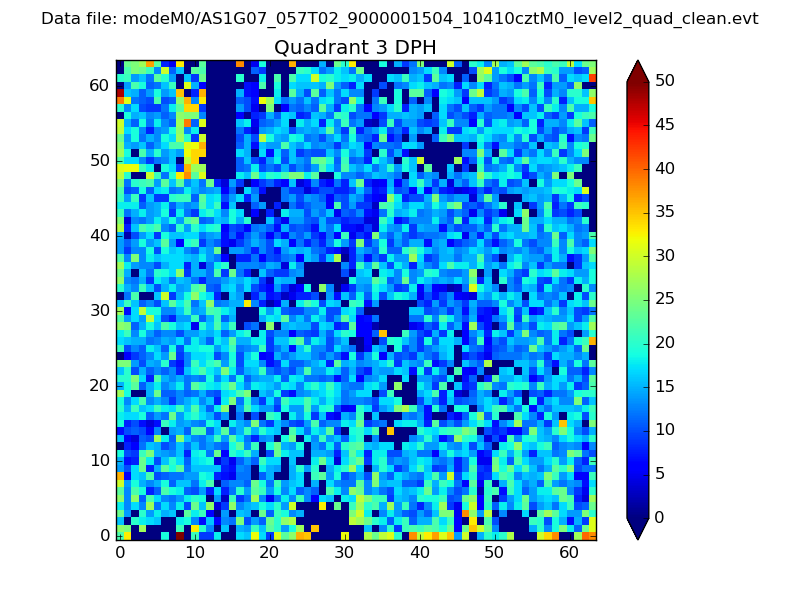 |
 |
Quadrant C |
| Plot type | Count rate plots | Images |
|---|---|---|
| Comparison with Poisson distribution Blue bars denote a histogram of data divided into 1 sec bins. Red curve is a Poisson curve with rate = median count rate of data. |
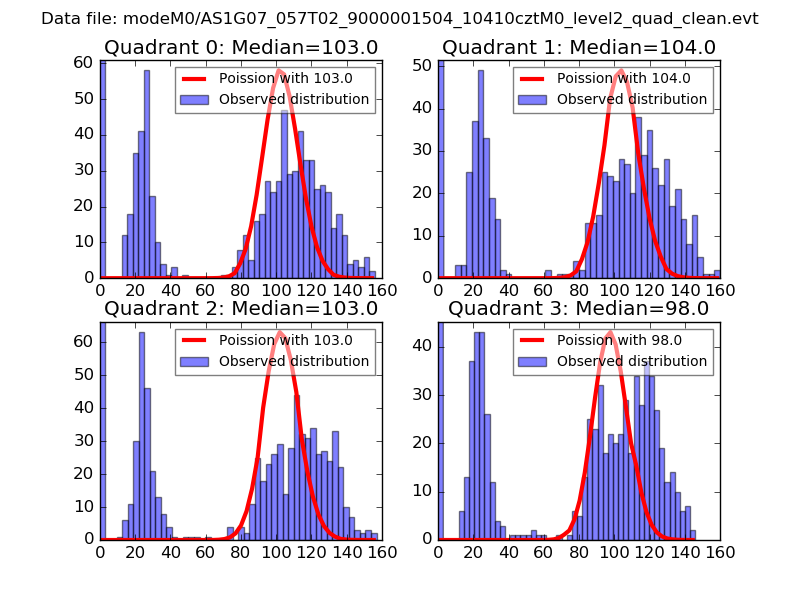 |
 |
| Quadrant-wise count rates Data is divided into 100 sec bins |
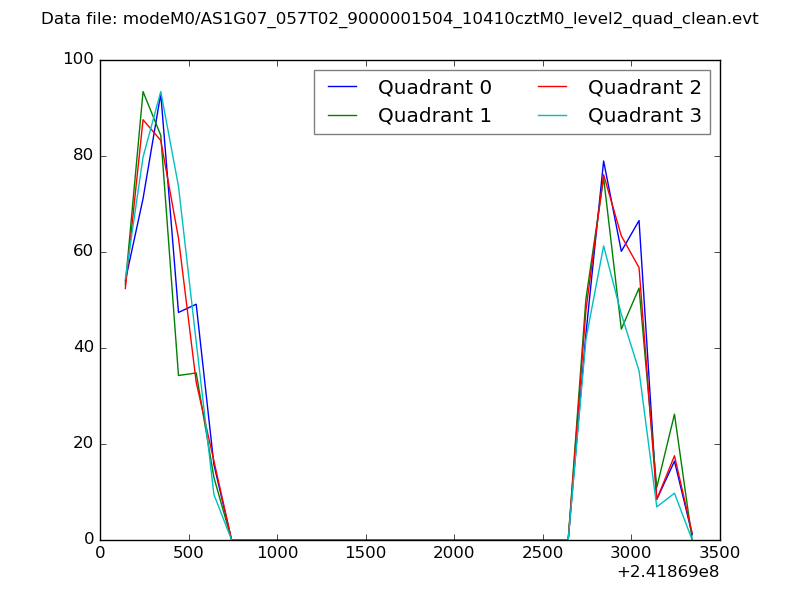 |
|
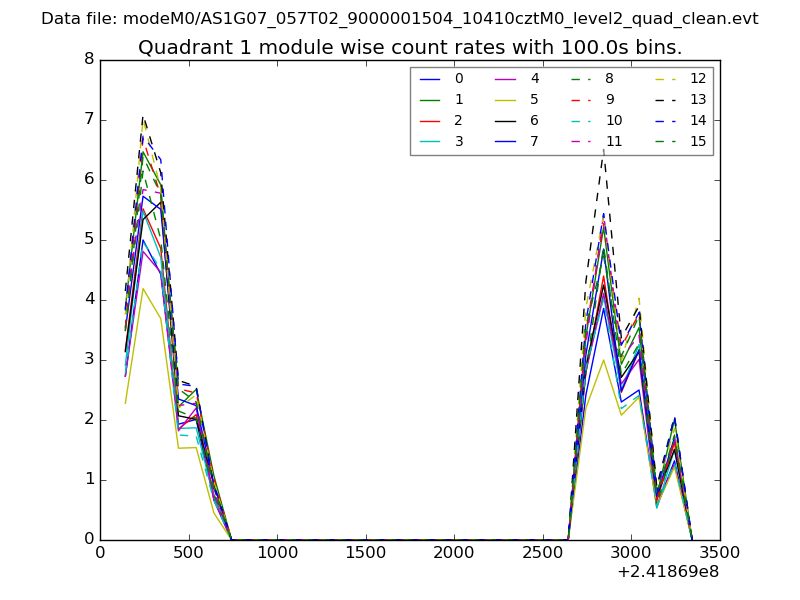
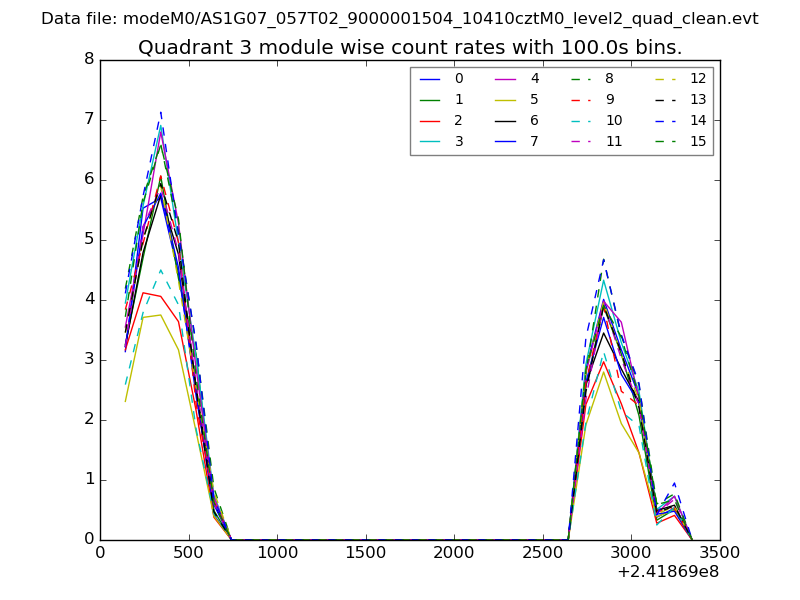
| Module-wise count rates for Quadrant A Data is divided into 100 sec bins |
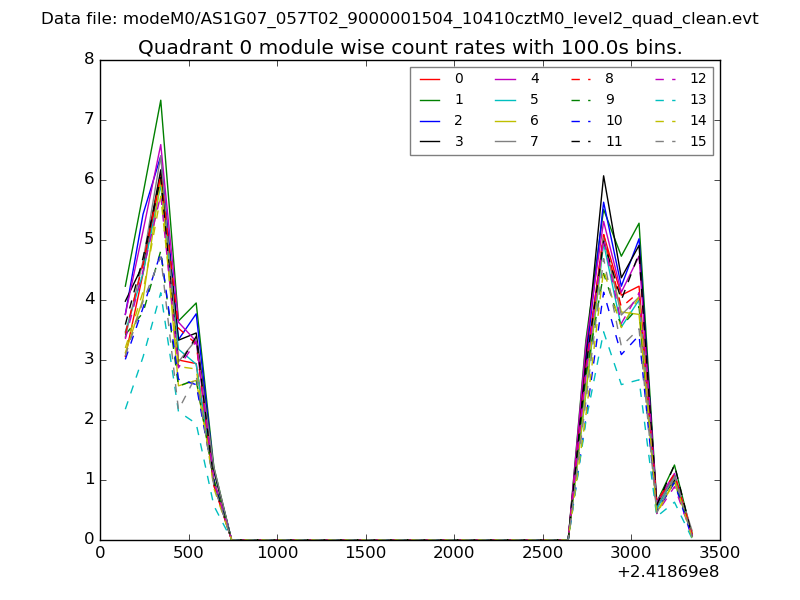 |
 |
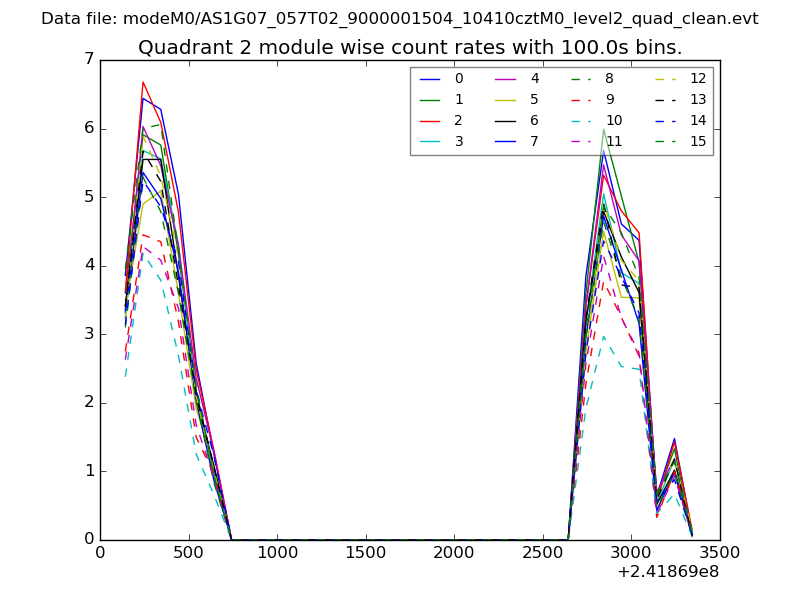
| Module-wise count rates for Quadrant B Data is divided into 100 sec bins |
 |
 |
| Module-wise count rates for Quadrant C Data is divided into 100 sec bins |
 |
 |
| Module-wise count rates for Quadrant D Data is divided into 100 sec bins |
 |
 |
| Parameter | Plot |
|---|---|
| CZT HV Monitor | 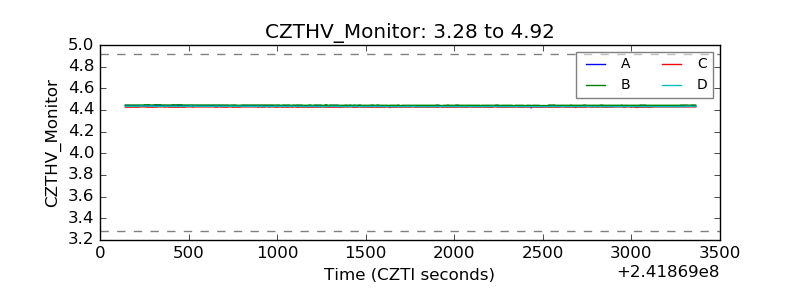 |
| D_VDD |  |
| Temperature 1 | 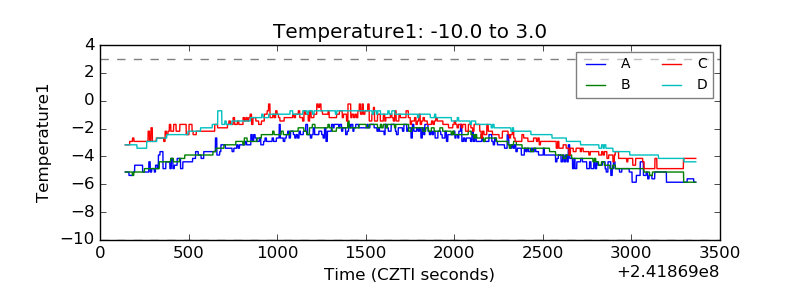 |
| Veto HV Monitor | 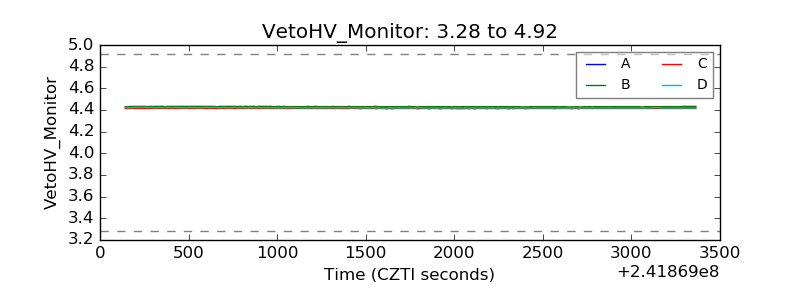 |
| Veto LLD | 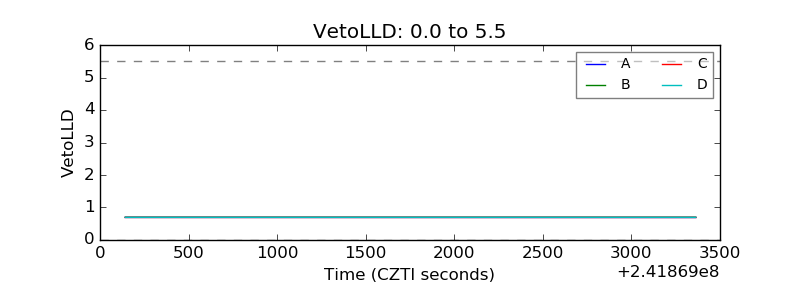 |
| Alpha Counter | 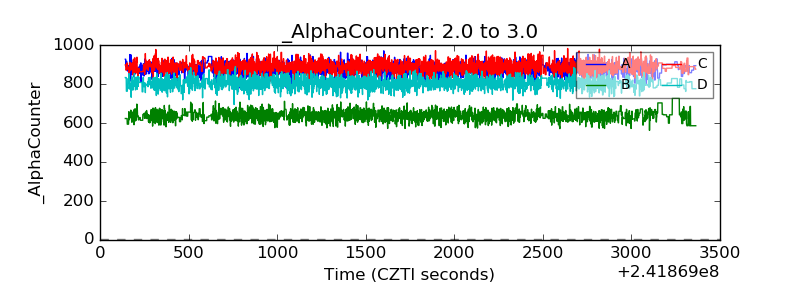 |
| _CPM_Rate | 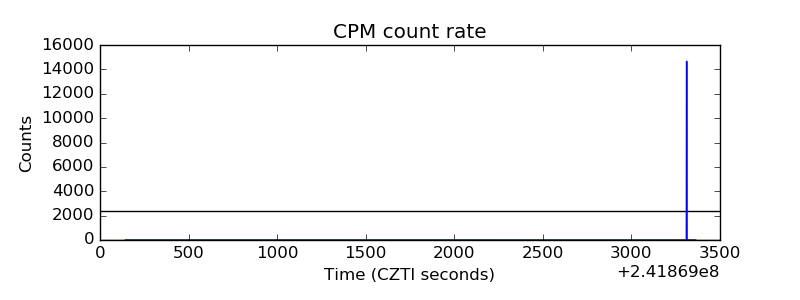 |
| CZT Counter | 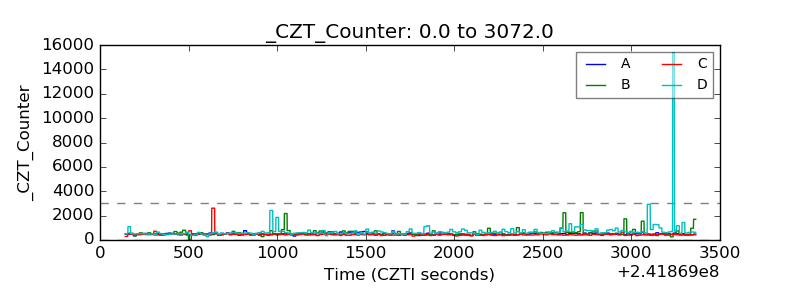 |
| +2.5 Volts monitor |  |
| +5 Volts monitor |  |
| _ROLL_ROT | 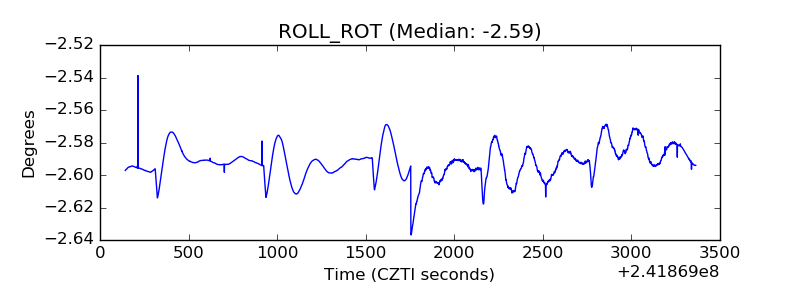 |
| _Roll_DEC | 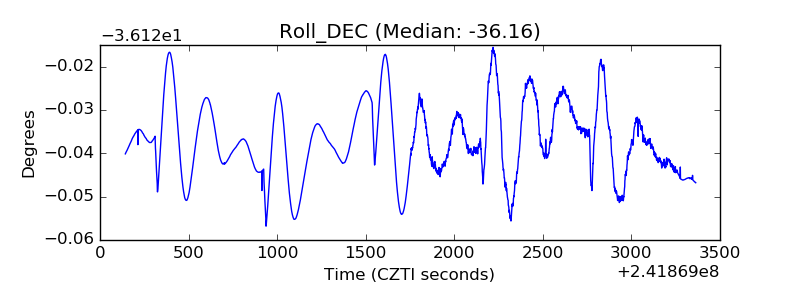 |
| _Roll_RA | 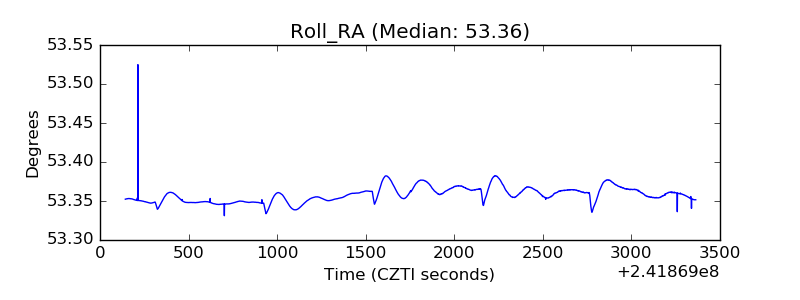 |
| Veto Counter | 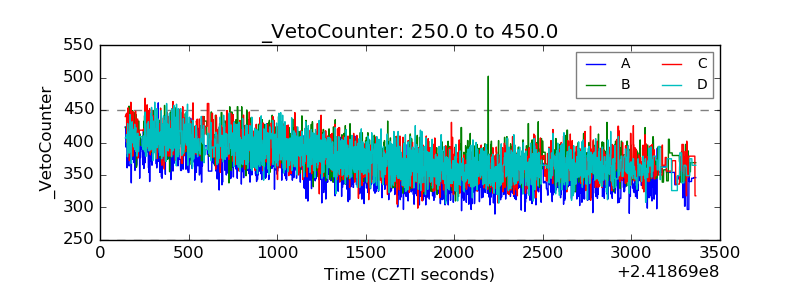 |