| Param | Original file | Final file |
|---|---|---|
| Filename | modeM0/AS1G07_057T02_9000001504_10411cztM0_level2.evt | modeM0/AS1G07_057T02_9000001504_10411cztM0_level2_quad_clean.evt |
| Size (bytes) | 166,792,320 | 14,077,440 |
| Size | 159.1 MB | 13.4 MB |
| Events in quadrant A | 1,120,583 | 67,333 |
| Events in quadrant B | 1,279,827 | 66,749 |
| Events in quadrant C | 917,850 | 68,387 |
| Events in quadrant D | 1,582,099 | 64,849 |
| Mode M0 | |||
|---|---|---|---|
| Quadrant | BADHDUFLAG | Total packets | Discarded packets |
| A | 0 | 4673 | 0 |
| B | 0 | 5252 | 0 |
| C | 0 | 4378 | 0 |
| D | 0 | 6256 | 0 |
| Mode SS | |||
|---|---|---|---|
| Quadrant | BADHDUFLAG | Total packets | Discarded packets |
| A | 0 | 44 | 0 |
| B | 0 | 44 | 0 |
| C | 0 | 44 | 0 |
| D | 0 | 44 | 0 |
| Quadrant | Total seconds | Saturated seconds | Saturation percentage |
|---|---|---|---|
| A | 2185 | 1 | 0.045767% |
| B | 2185 | 43 | 1.967963% |
| C | 2185 | 0 | 0.000000% |
| D | 2185 | 13 | 0.594966% |
Noise dominated data is calculated using 1-second bins in cleaned event files. If a bin has >2000 counts, and if more than 50% of those come from <1% of pixels, then it is considered to be noise-dominated and hence unusable.
| Quadrant | # 1 sec bins | Bins with >0 counts | Bins with >2000 counts | High rate bins dominated by noise | Noise dominated (total time) | Noise dominated (detector-on time) | Marked lightcurve |
|---|---|---|---|---|---|---|---|
| A | 2185 | 2185 | 0 | 0 | 0.00% | 0.00% | 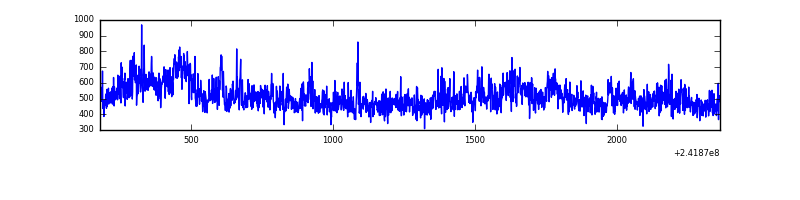 |
| B | 2184 | 2184 | 28 | 28 | 1.28% | 1.28% | 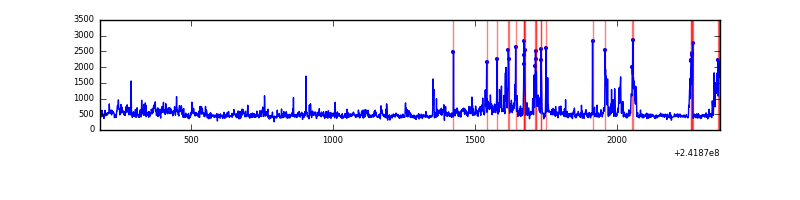 |
| C | 2185 | 2185 | 0 | 0 | 0.00% | 0.00% | 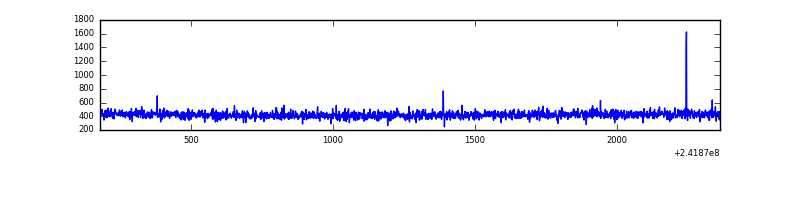 |
| D | 2185 | 2185 | 15 | 15 | 0.69% | 0.69% | 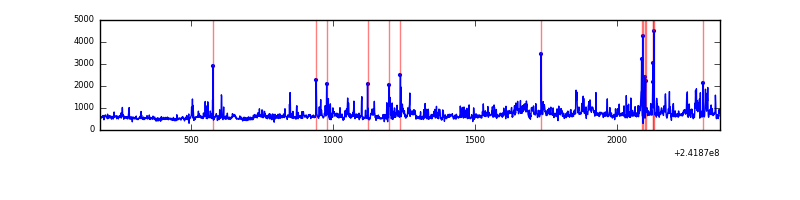 |
Top three noisy pixels from each quadrant. If the there are fewer than three noisy pixels in the level2.evt file, extra rows are filled as -1
| Pixel properties | Quadrant properties | ||||||
|---|---|---|---|---|---|---|---|
| Quadrant | DetID | PixID | Counts | Sigma | Mean | Median | Sigma |
| A | 13 | 251 | 168669 | 3321.87 | 241 | 236 | 50.7 |
| A | 4 | 2 | 18509 | 360.38 | 241 | 236 | 50.7 |
| A | 0 | 226 | 2254 | 39.8 | 241 | 236 | 50.7 |
| B | 4 | 239 | 235327 | 4926.07 | 240 | 234 | 47.7 |
| B | 11 | 51 | 55795 | 1164.21 | 240 | 234 | 47.7 |
| B | 0 | 214 | 18524 | 383.24 | 240 | 234 | 47.7 |
| C | 12 | 4 | 2414 | 39.72 | 234 | 236 | 54.8 |
| C | 13 | 61 | 1767 | 27.92 | 234 | 236 | 54.8 |
| C | 14 | 67 | 1046 | 14.77 | 234 | 236 | 54.8 |
| D | 8 | 195 | 240568 | 4158.82 | 233 | 225 | 57.8 |
| D | 5 | 222 | 158112 | 2732.02 | 233 | 225 | 57.8 |
| D | 1 | 20 | 156117 | 2697.5 | 233 | 225 | 57.8 |
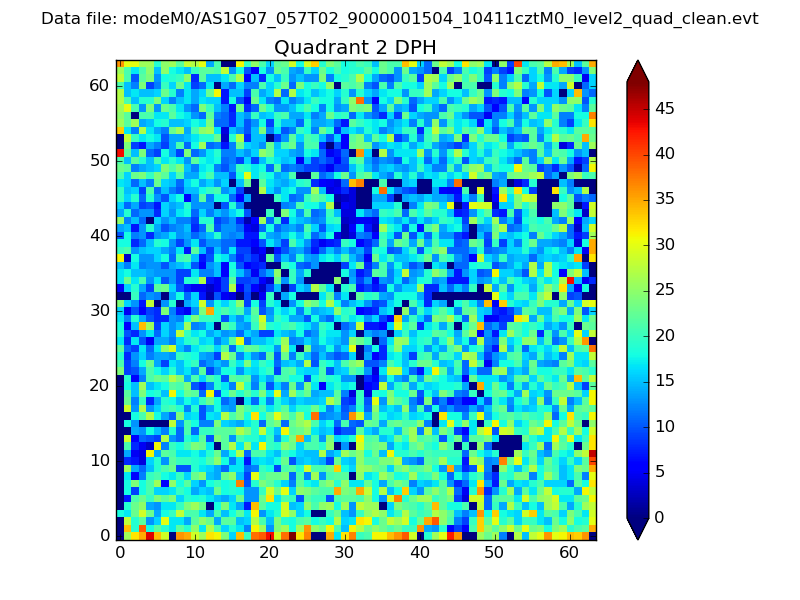
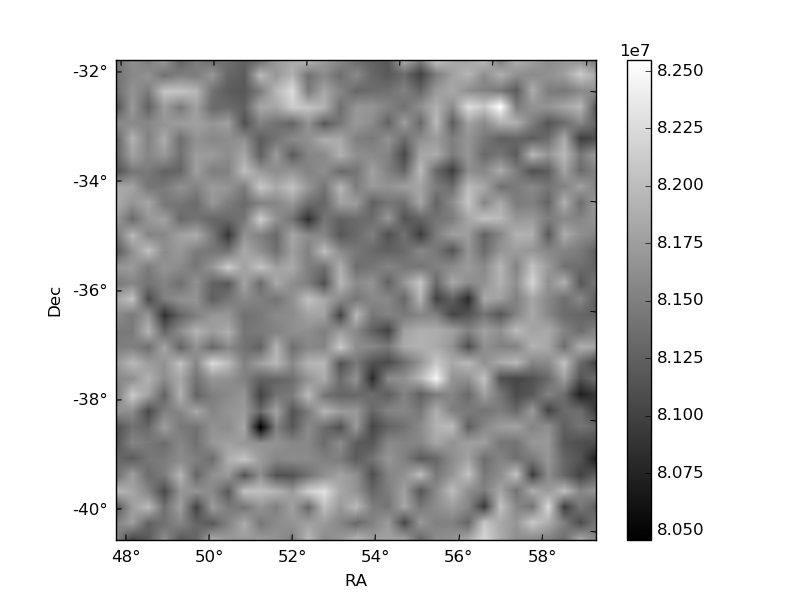
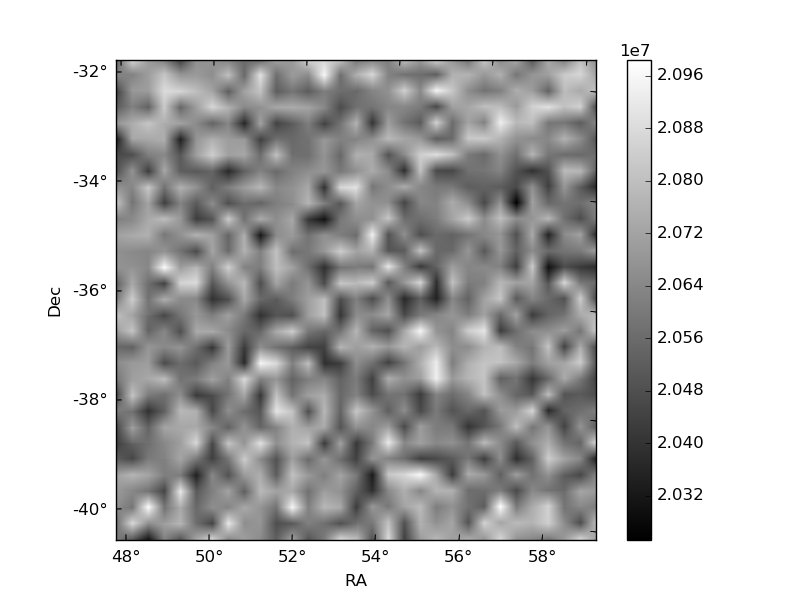
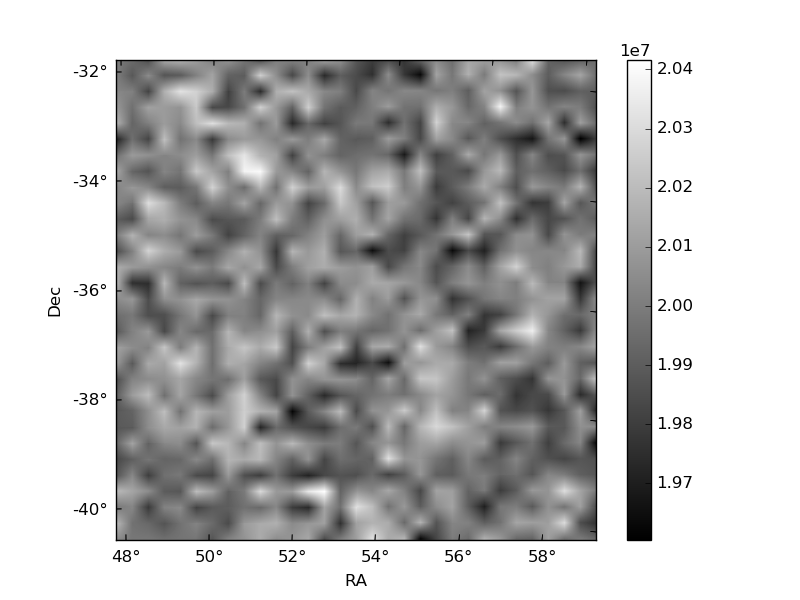
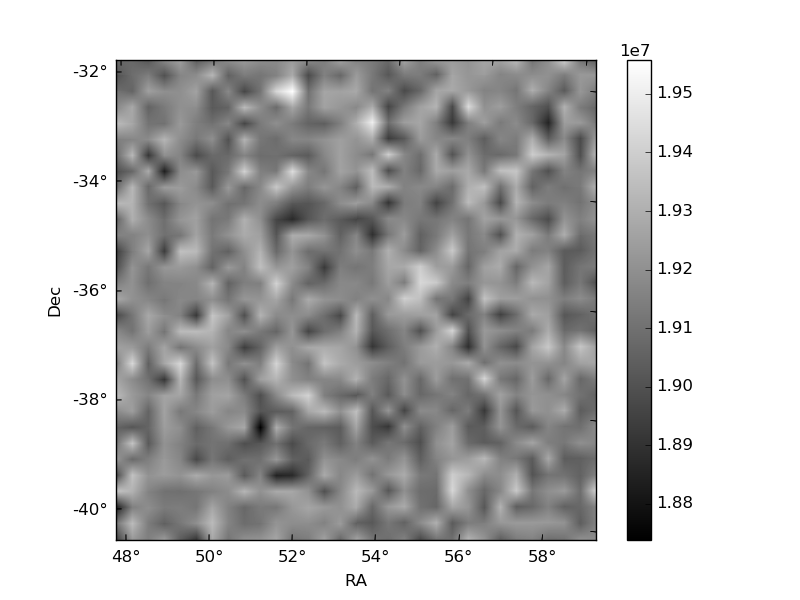
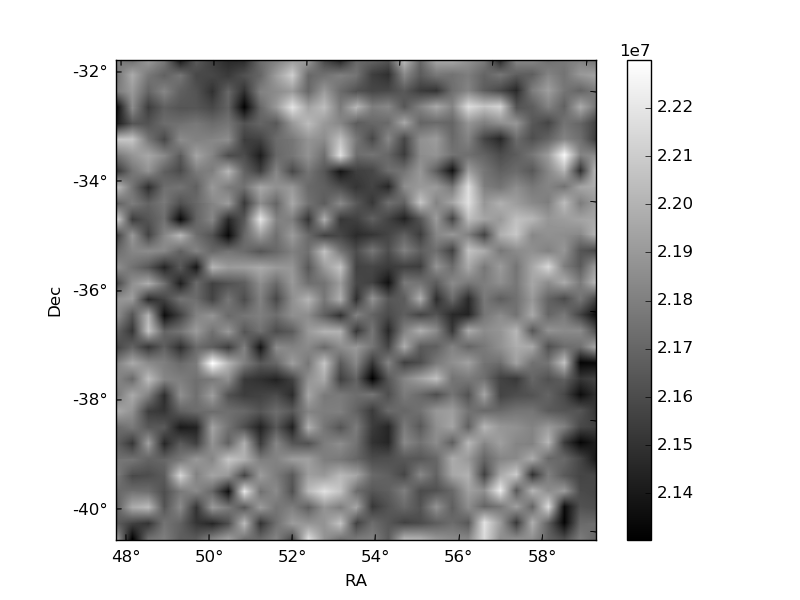
Histogram calculated using DETX and DETY for each event in the final _common_clean file
| Quadrant A | 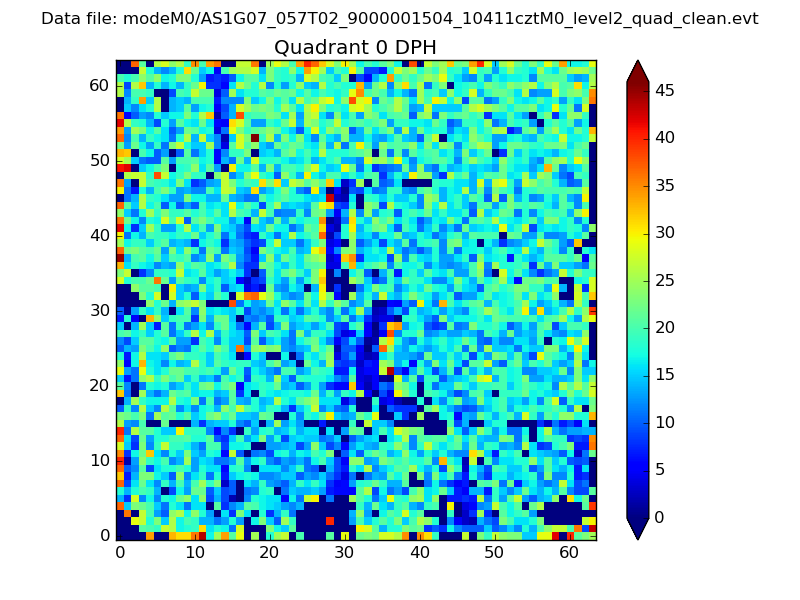 |
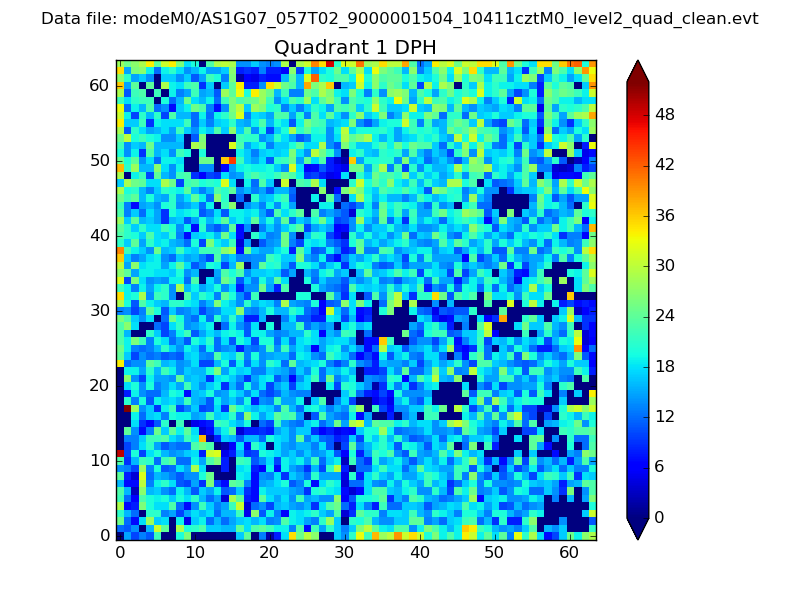 |
Quadrant B |
|---|---|---|---|
| Quadrant D | 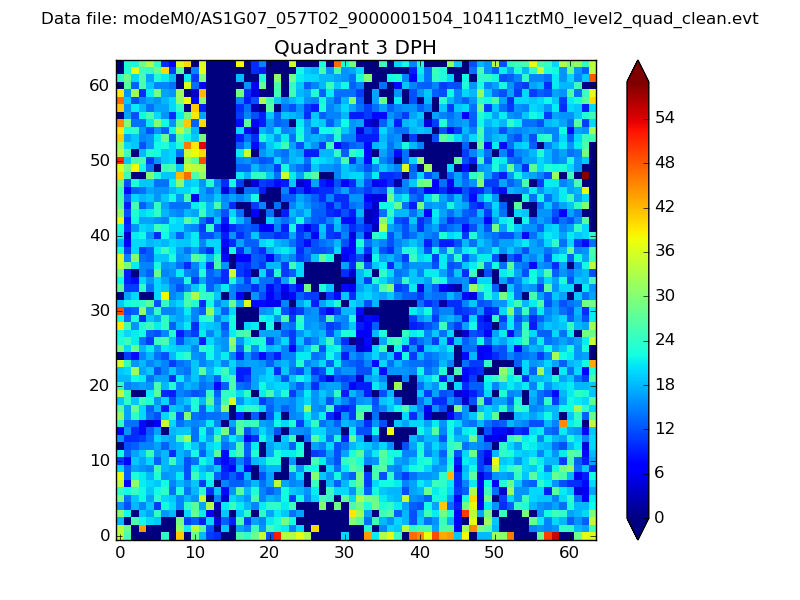 |
 |
Quadrant C |
| Plot type | Count rate plots | Images |
|---|---|---|
| Comparison with Poisson distribution Blue bars denote a histogram of data divided into 1 sec bins. Red curve is a Poisson curve with rate = median count rate of data. |
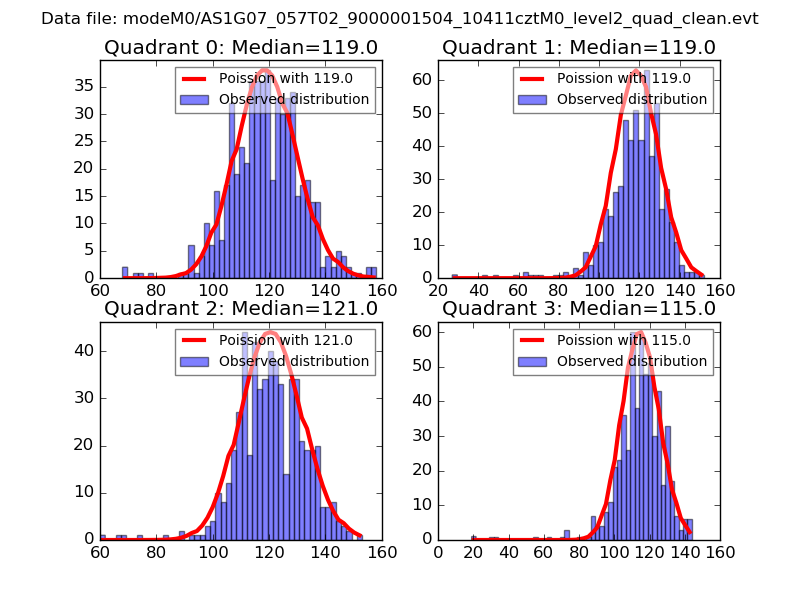 |
 |
| Quadrant-wise count rates Data is divided into 100 sec bins |
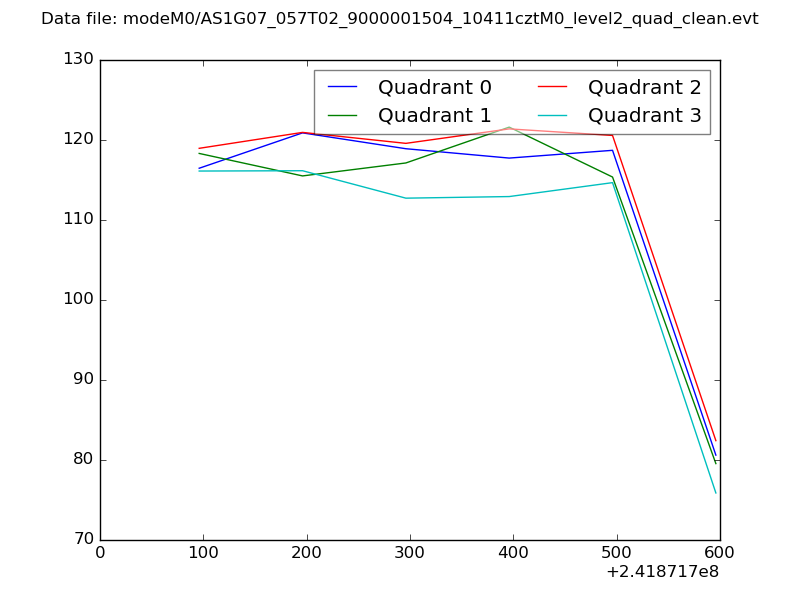 |
|
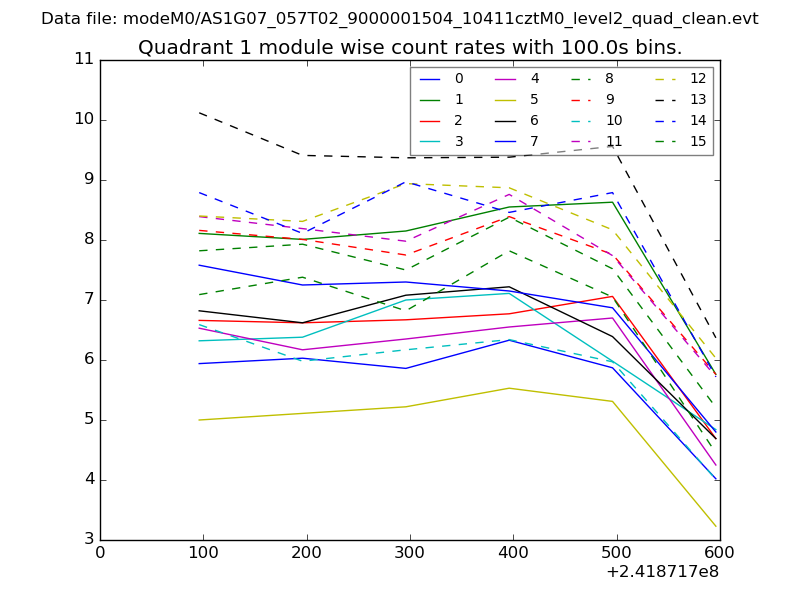
| Module-wise count rates for Quadrant A Data is divided into 100 sec bins |
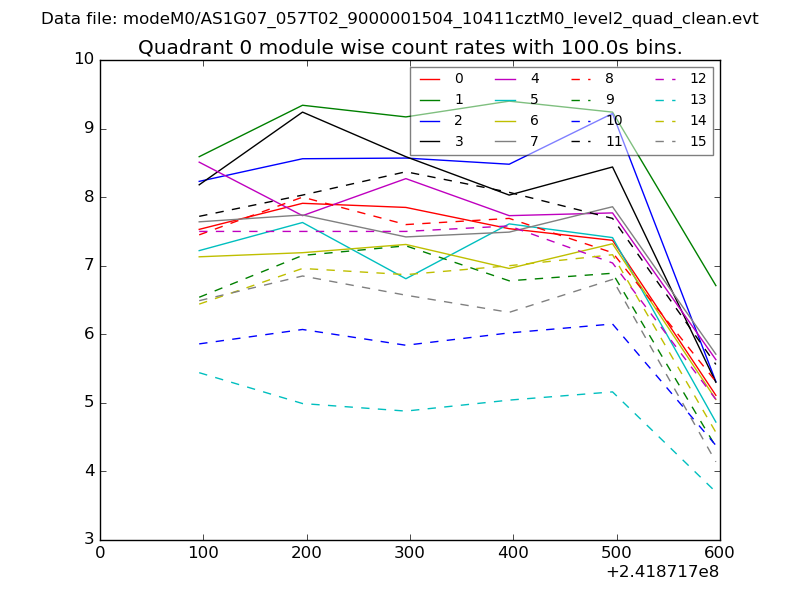 |
 |
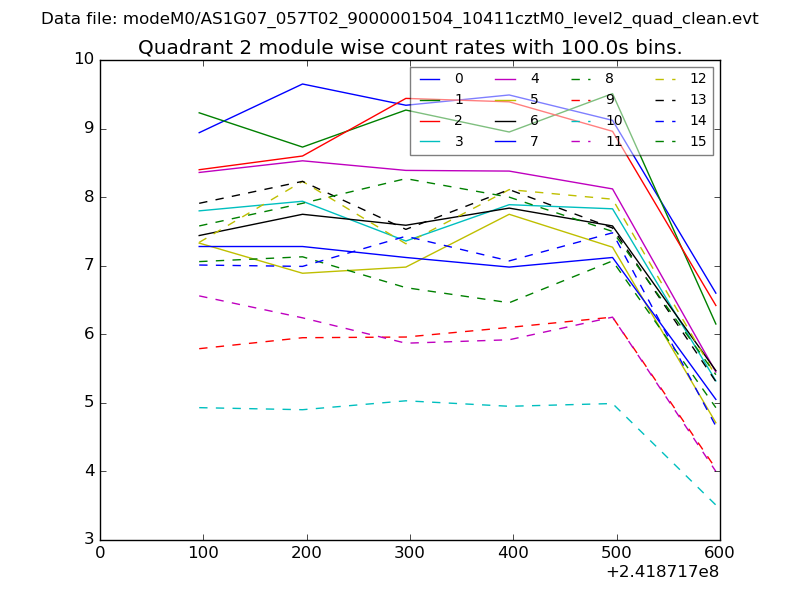
| Module-wise count rates for Quadrant B Data is divided into 100 sec bins |
 |
 |
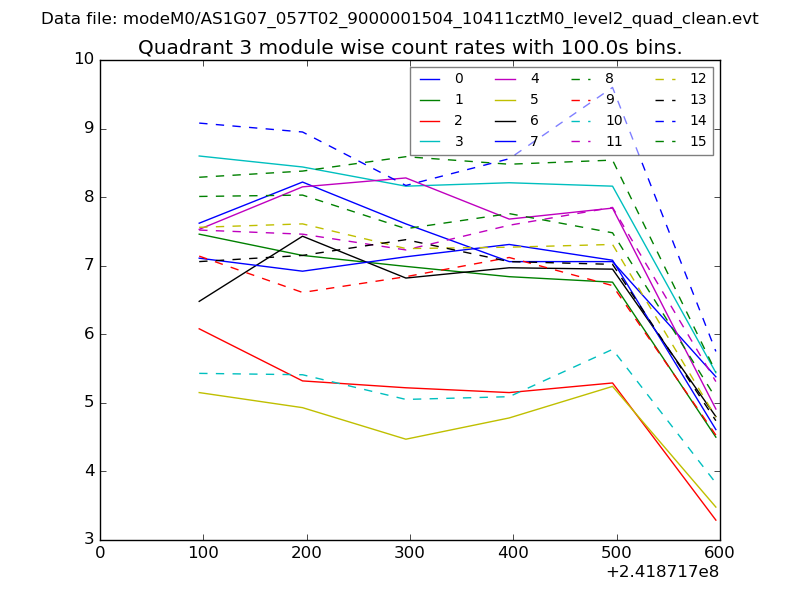
| Module-wise count rates for Quadrant C Data is divided into 100 sec bins |
 |
 |
| Module-wise count rates for Quadrant D Data is divided into 100 sec bins |
 |
 |
| Parameter | Plot |
|---|---|
| CZT HV Monitor | 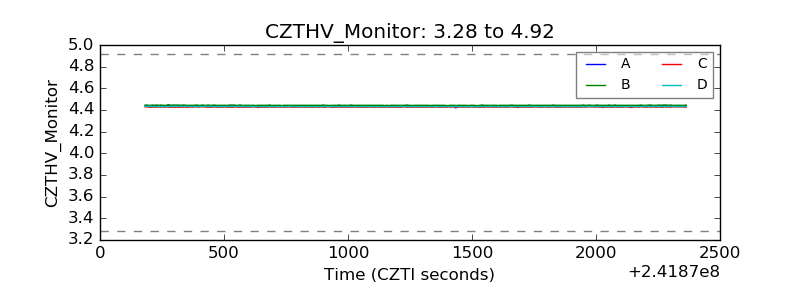 |
| D_VDD | 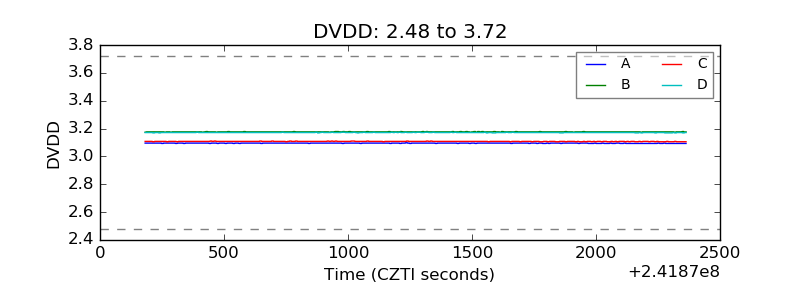 |
| Temperature 1 | 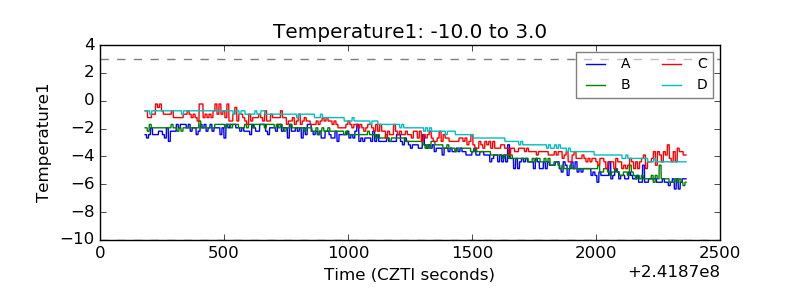 |
| Veto HV Monitor |  |
| Veto LLD | 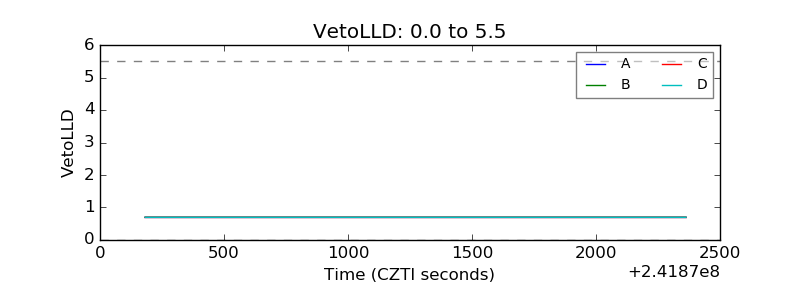 |
| Alpha Counter | 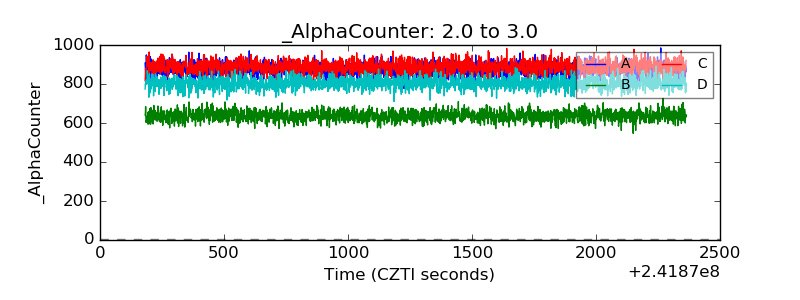 |
| _CPM_Rate | 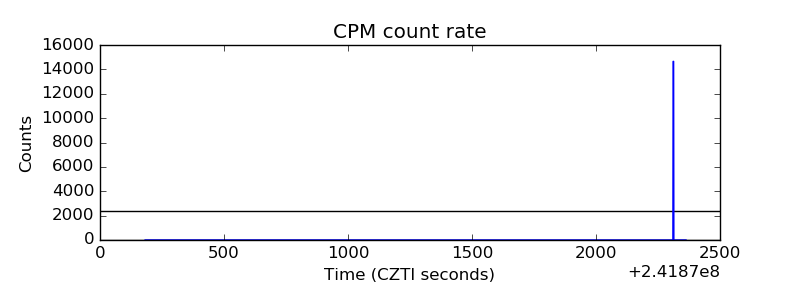 |
| CZT Counter | 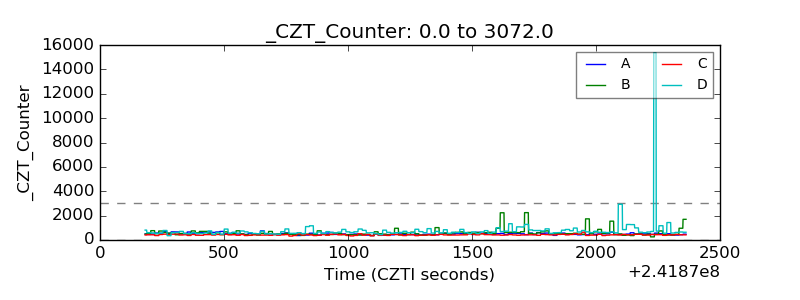 |
| +2.5 Volts monitor | 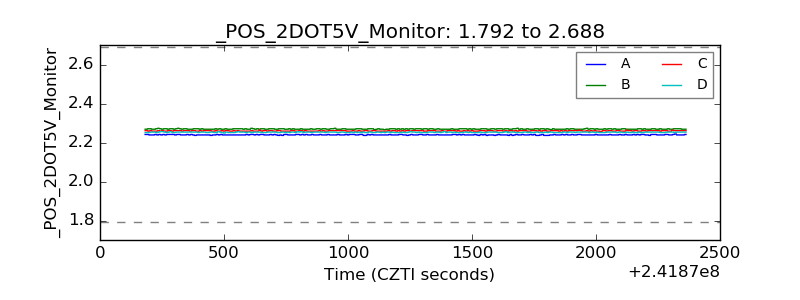 |
| +5 Volts monitor | 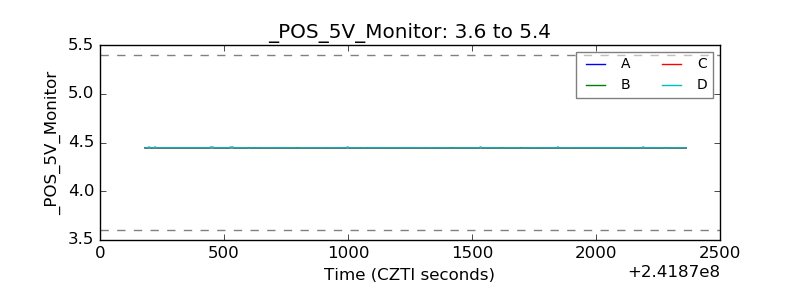 |
| _ROLL_ROT | 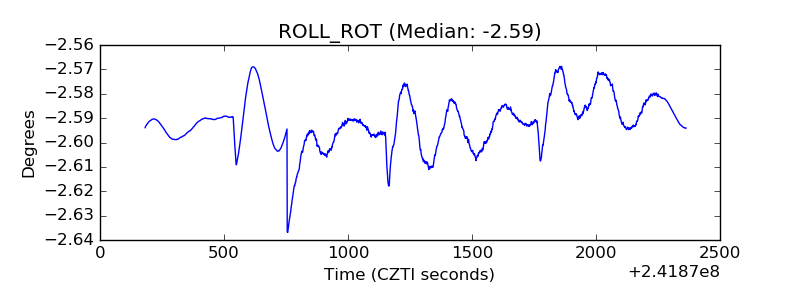 |
| _Roll_DEC | 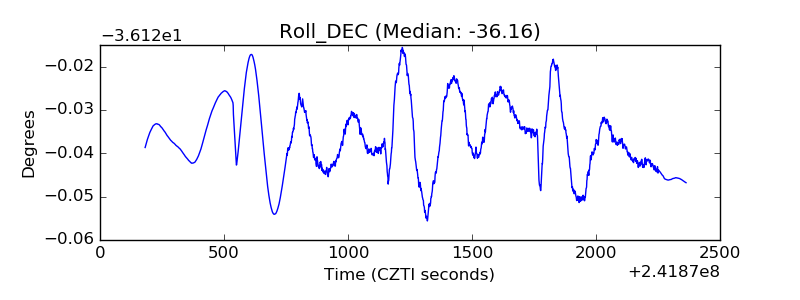 |
| _Roll_RA | 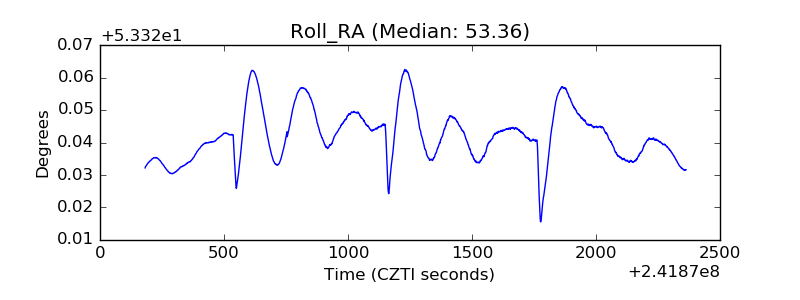 |
| Veto Counter | 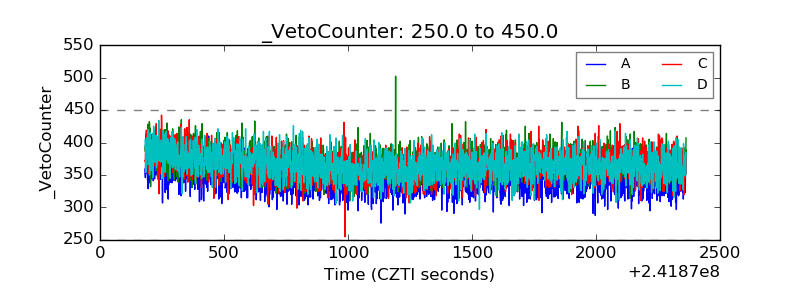 |