| Param | Original file | Final file |
|---|---|---|
| Filename | modeM0/AS1G07_068T01_9000001502_10396cztM0_level2.evt | modeM0/AS1G07_068T01_9000001502_10396cztM0_level2_quad_clean.evt |
| Size (bytes) | 529,470,720 | 80,585,280 |
| Size | 504.9 MB | 76.9 MB |
| Events in quadrant A | 3,383,258 | 485,211 |
| Events in quadrant B | 4,120,658 | 489,886 |
| Events in quadrant C | 3,374,406 | 492,400 |
| Events in quadrant D | 4,662,835 | 465,812 |
| Mode M0 | |||
|---|---|---|---|
| Quadrant | BADHDUFLAG | Total packets | Discarded packets |
| A | 0 | 15039 | 0 |
| B | 0 | 16857 | 0 |
| C | 0 | 15187 | 0 |
| D | 0 | 18526 | 0 |
| Mode M9 | |||
|---|---|---|---|
| Quadrant | BADHDUFLAG | Total packets | Discarded packets |
| A | 0 | 3 | 0 |
| B | 0 | 3 | 0 |
| C | 0 | 3 | 0 |
| D | 0 | 3 | 0 |
| Mode SS | |||
|---|---|---|---|
| Quadrant | BADHDUFLAG | Total packets | Discarded packets |
| A | 0 | 148 | 0 |
| B | 0 | 148 | 0 |
| C | 0 | 148 | 0 |
| D | 0 | 148 | 0 |
| Quadrant | Total seconds | Saturated seconds | Saturation percentage |
|---|---|---|---|
| A | 7274 | 181 | 2.488315% |
| B | 7272 | 278 | 3.822882% |
| C | 7273 | 147 | 2.021174% |
| D | 7274 | 219 | 3.010723% |
Noise dominated data is calculated using 1-second bins in cleaned event files. If a bin has >2000 counts, and if more than 50% of those come from <1% of pixels, then it is considered to be noise-dominated and hence unusable.
| Quadrant | # 1 sec bins | Bins with >0 counts | Bins with >2000 counts | High rate bins dominated by noise | Noise dominated (total time) | Noise dominated (detector-on time) | Marked lightcurve |
|---|---|---|---|---|---|---|---|
| A | 7585 | 7275 | 0 | 0 | 0.00% | 0.00% | 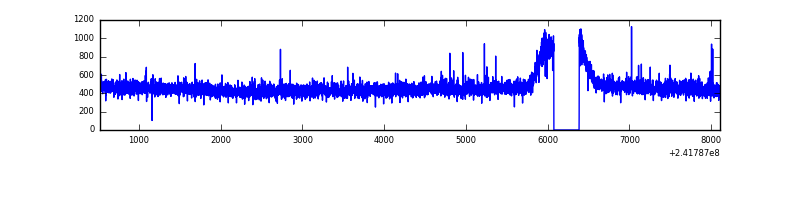 |
| B | 7585 | 7275 | 57 | 57 | 0.75% | 0.78% | 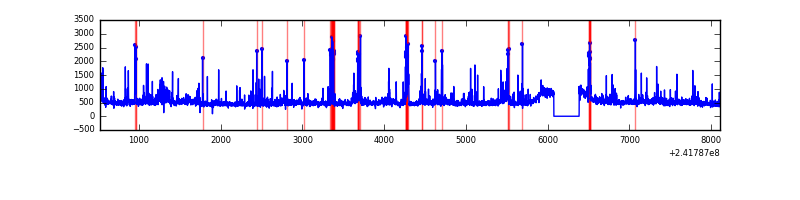 |
| C | 7585 | 7275 | 7 | 7 | 0.09% | 0.10% | 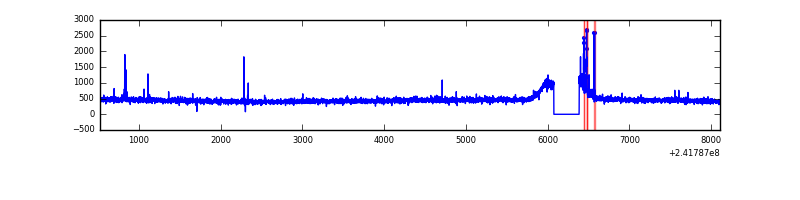 |
| D | 7585 | 7275 | 64 | 64 | 0.84% | 0.88% | 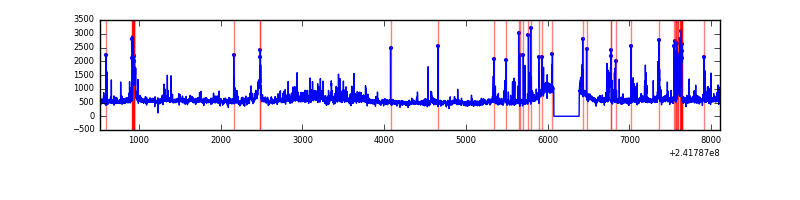 |
Top three noisy pixels from each quadrant. If the there are fewer than three noisy pixels in the level2.evt file, extra rows are filled as -1
| Pixel properties | Quadrant properties | ||||||
|---|---|---|---|---|---|---|---|
| Quadrant | DetID | PixID | Counts | Sigma | Mean | Median | Sigma |
| A | 3 | 1 | 9170 | 46.59 | 870 | 848 | 178.6 |
| A | 1 | 162 | 8575 | 43.26 | 870 | 848 | 178.6 |
| A | 0 | 226 | 7851 | 39.21 | 870 | 848 | 178.6 |
| B | 4 | 239 | 420833 | 2513.15 | 866 | 845 | 167.1 |
| B | 0 | 219 | 92033 | 545.66 | 866 | 845 | 167.1 |
| B | 11 | 51 | 76892 | 455.05 | 866 | 845 | 167.1 |
| C | 14 | 234 | 61633 | 308.12 | 848 | 854 | 197.3 |
| C | 13 | 61 | 6446 | 28.35 | 848 | 854 | 197.3 |
| C | 14 | 67 | 3011 | 10.94 | 848 | 854 | 197.3 |
| D | 8 | 195 | 676985 | 3328.64 | 845 | 821 | 203.1 |
| D | 1 | 20 | 324454 | 1593.19 | 845 | 821 | 203.1 |
| D | 2 | 33 | 140269 | 686.48 | 845 | 821 | 203.1 |
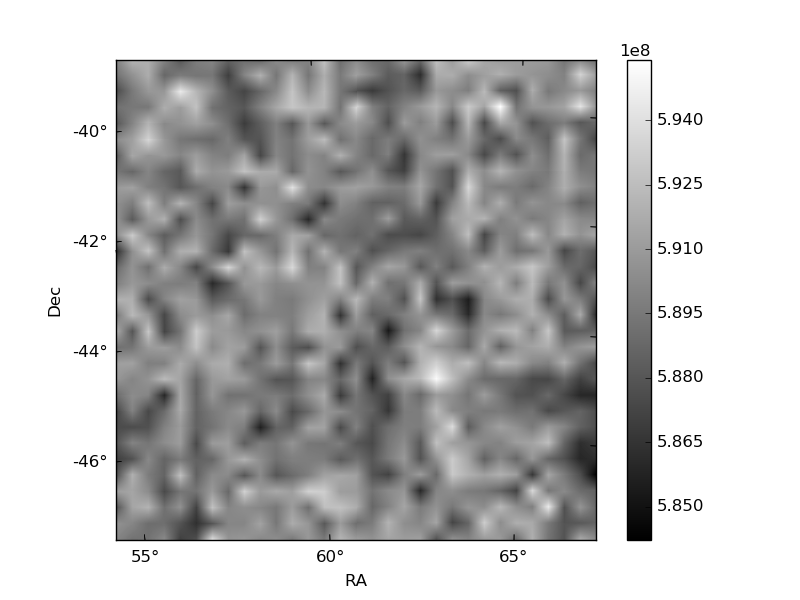
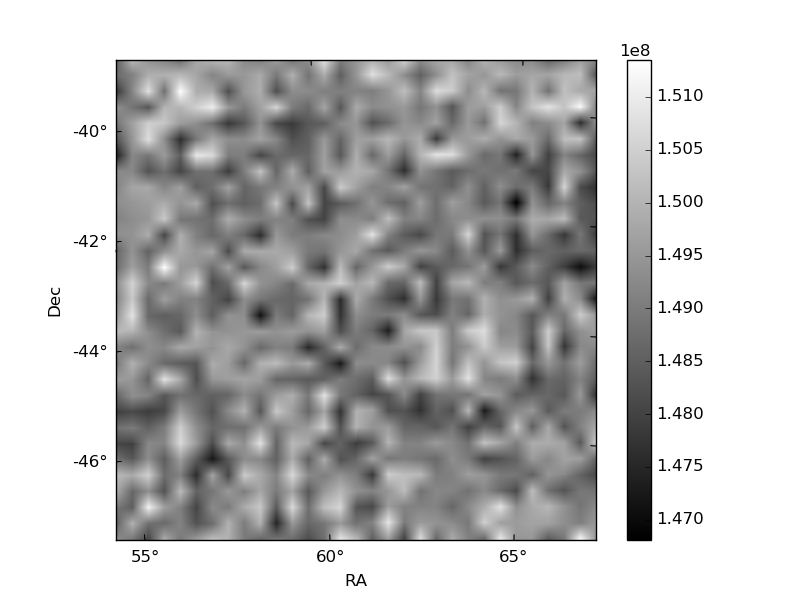
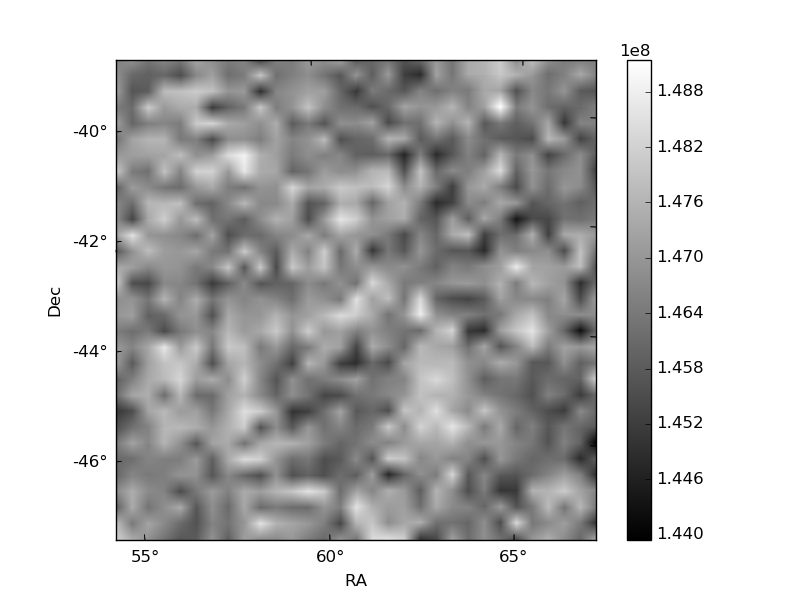
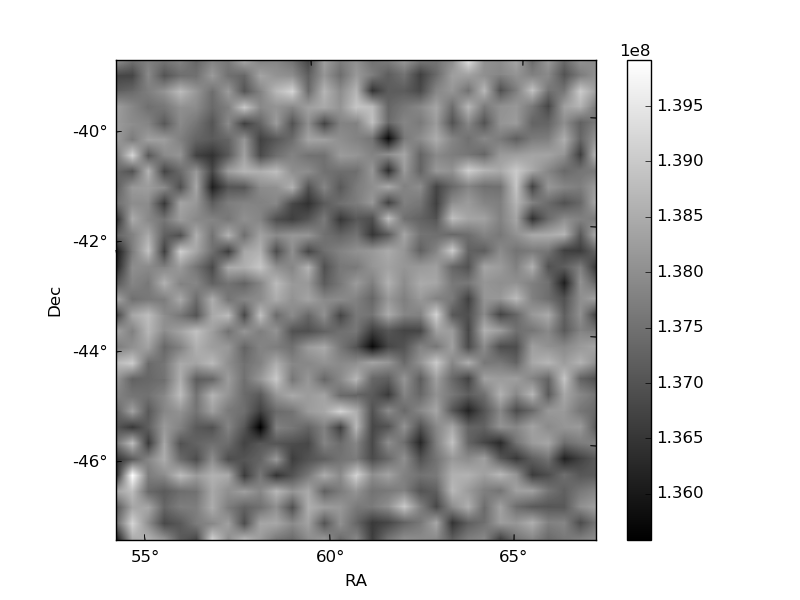
Histogram calculated using DETX and DETY for each event in the final _common_clean file
| Quadrant A | 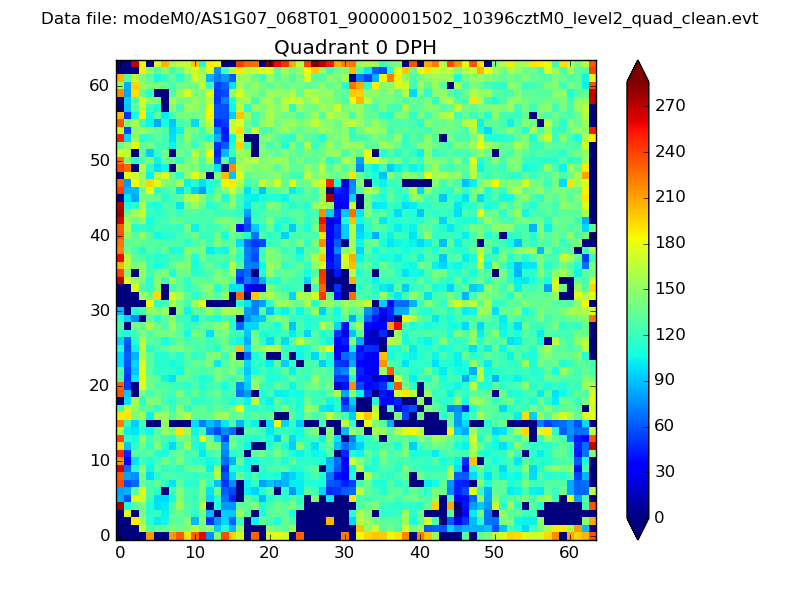 |
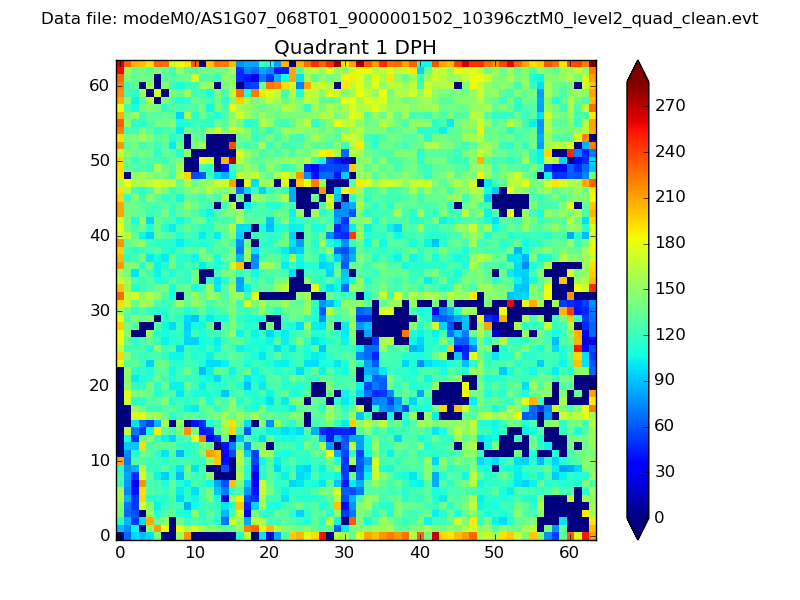 |
Quadrant B |
|---|---|---|---|
| Quadrant D | 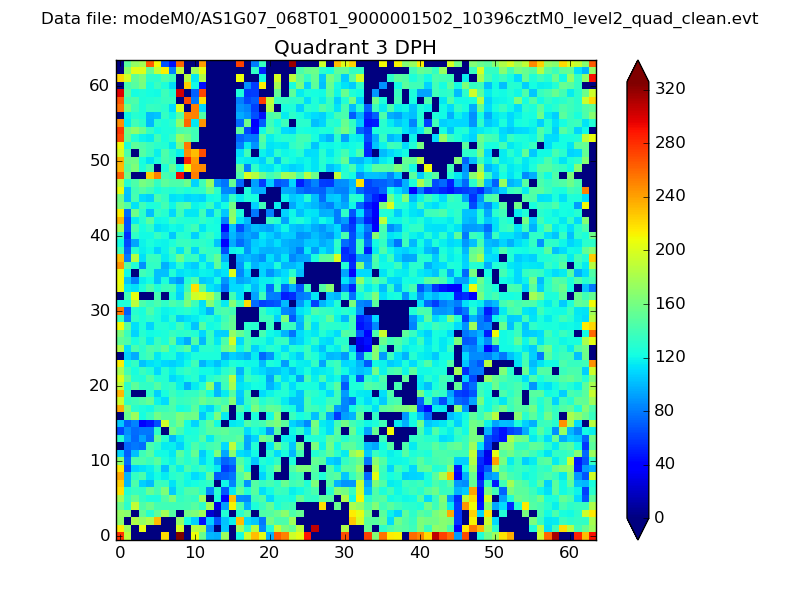 |
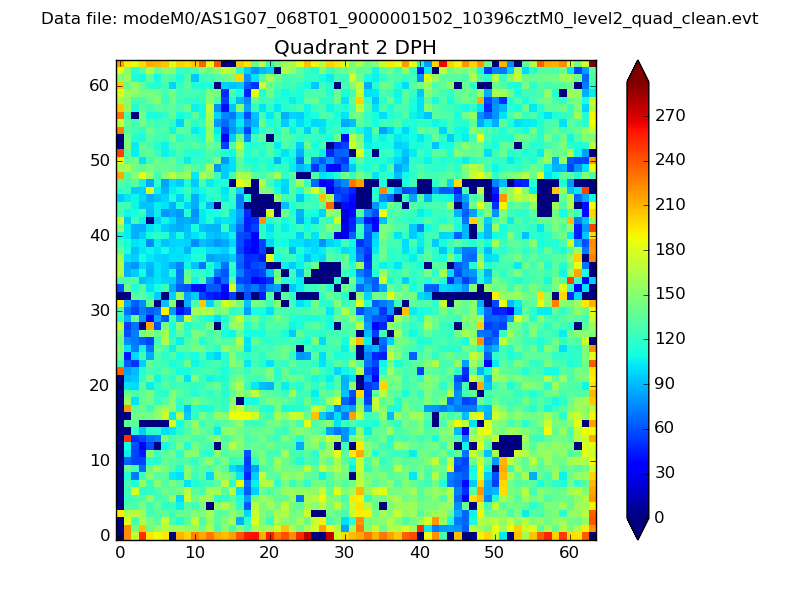 |
Quadrant C |
| Plot type | Count rate plots | Images |
|---|---|---|
| Comparison with Poisson distribution Blue bars denote a histogram of data divided into 1 sec bins. Red curve is a Poisson curve with rate = median count rate of data. |
 |
 |
| Quadrant-wise count rates Data is divided into 100 sec bins |
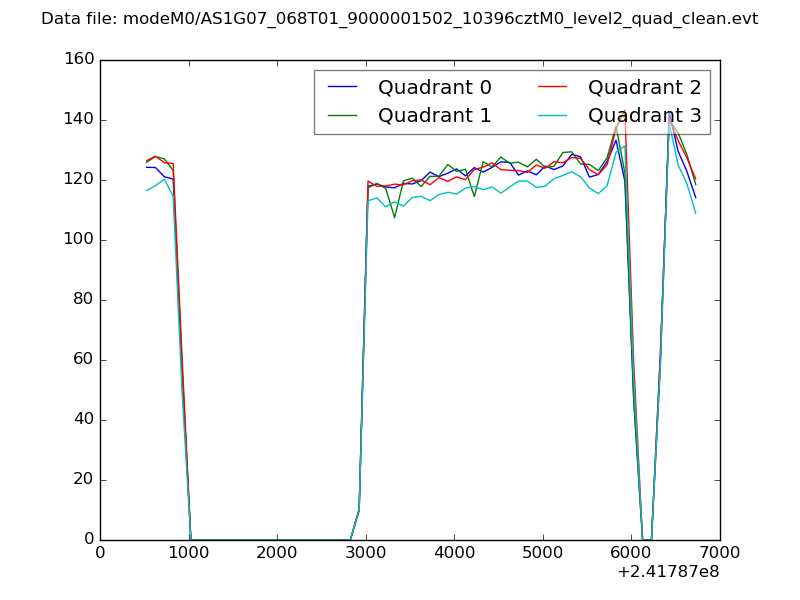 |
|
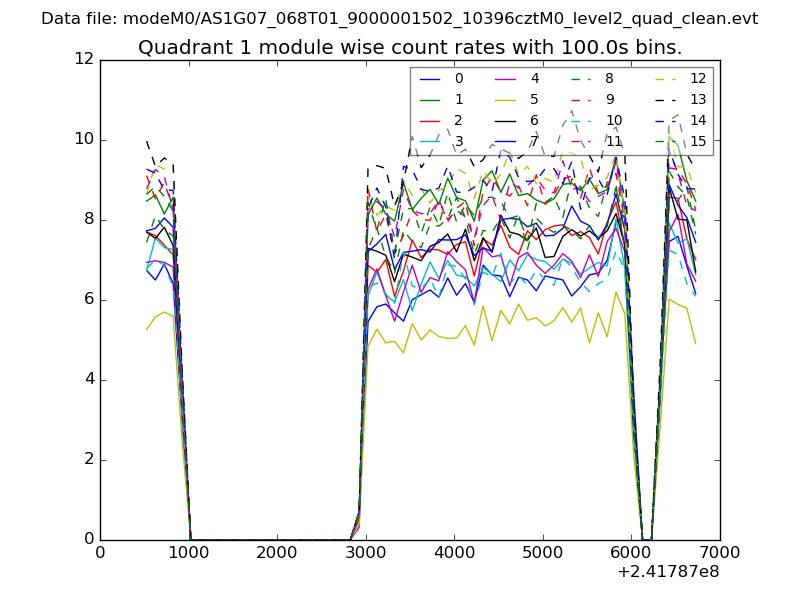
| Module-wise count rates for Quadrant A Data is divided into 100 sec bins |
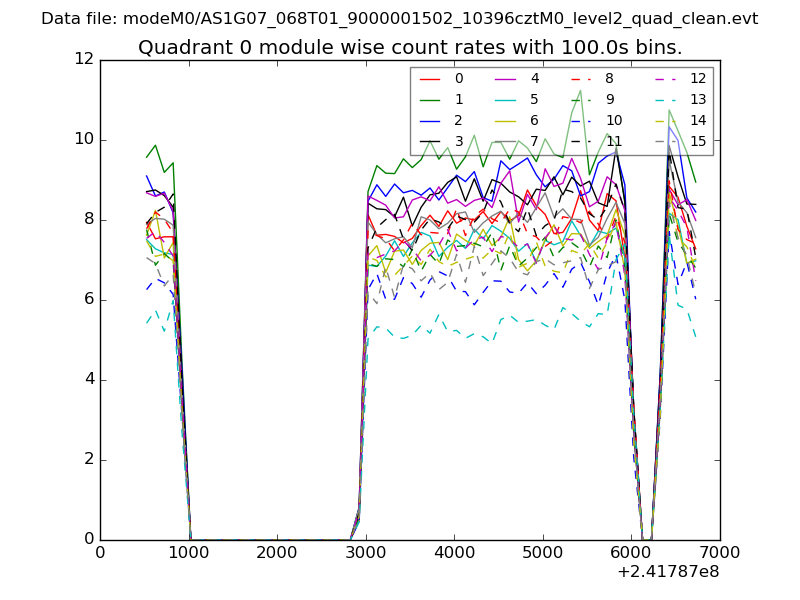 |
 |
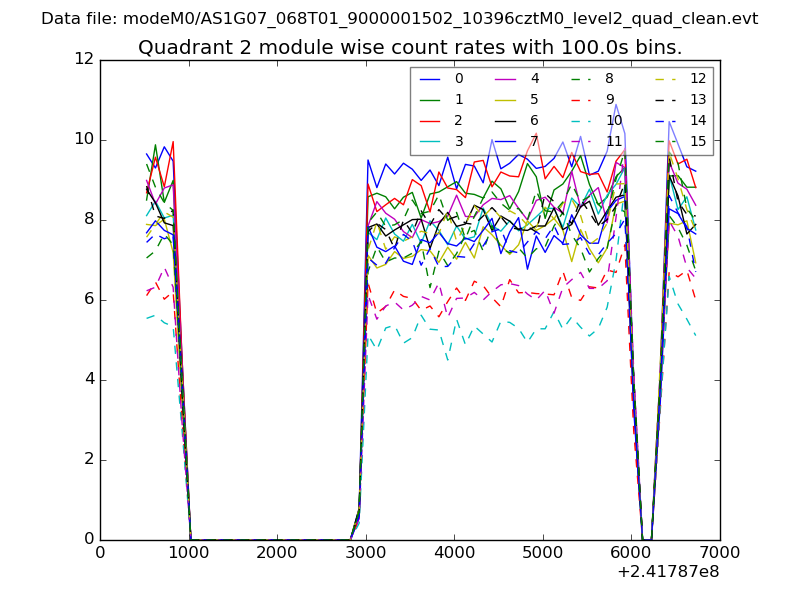
| Module-wise count rates for Quadrant B Data is divided into 100 sec bins |
 |
 |
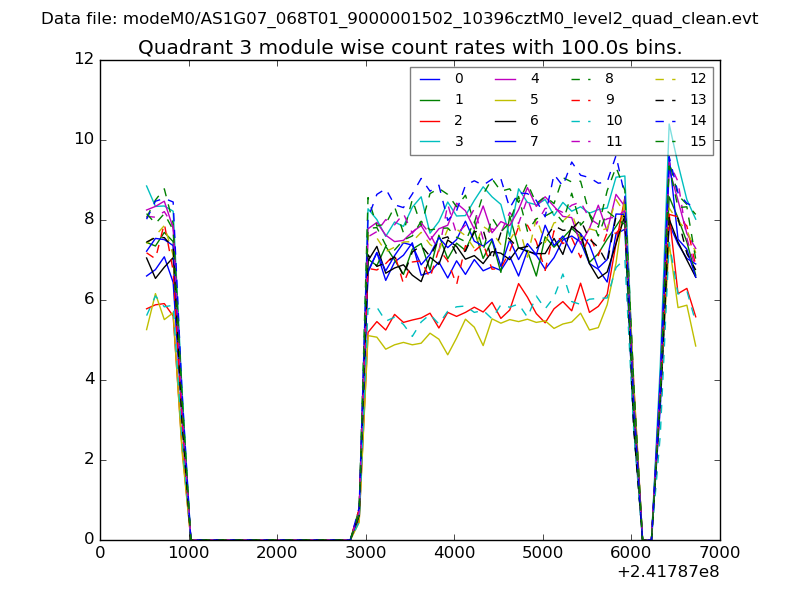
| Module-wise count rates for Quadrant C Data is divided into 100 sec bins |
 |
 |
| Module-wise count rates for Quadrant D Data is divided into 100 sec bins |
 |
 |
| Parameter | Plot |
|---|---|
| CZT HV Monitor | 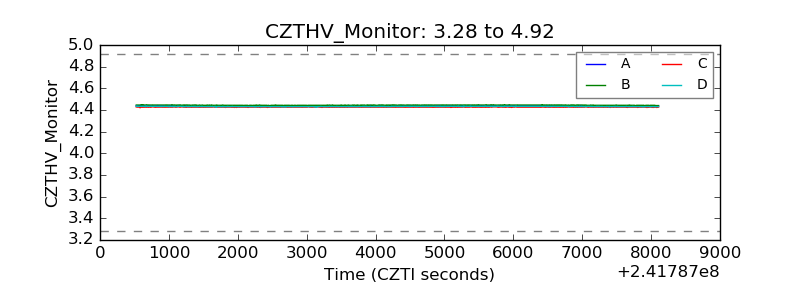 |
| D_VDD | 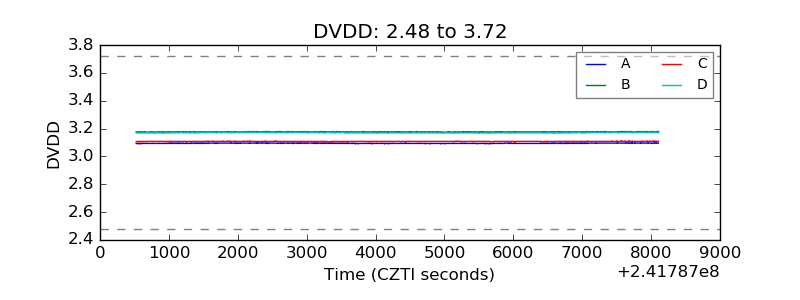 |
| Temperature 1 | 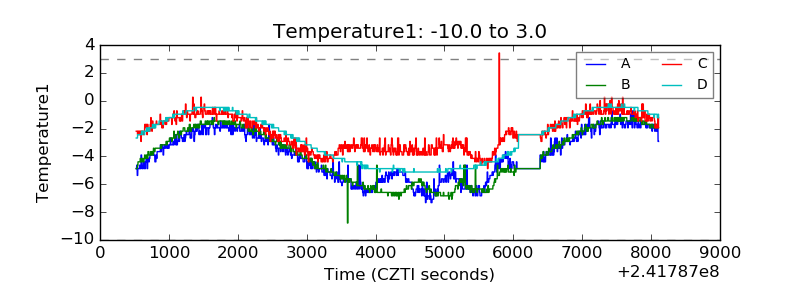 |
| Veto HV Monitor | 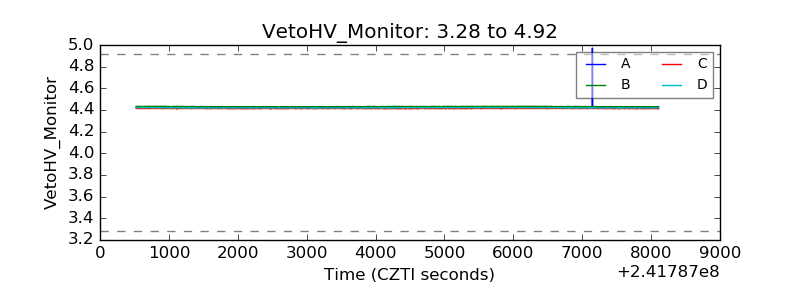 |
| Veto LLD | 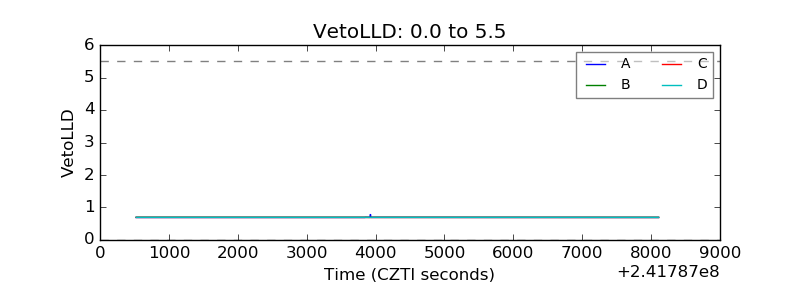 |
| Alpha Counter | 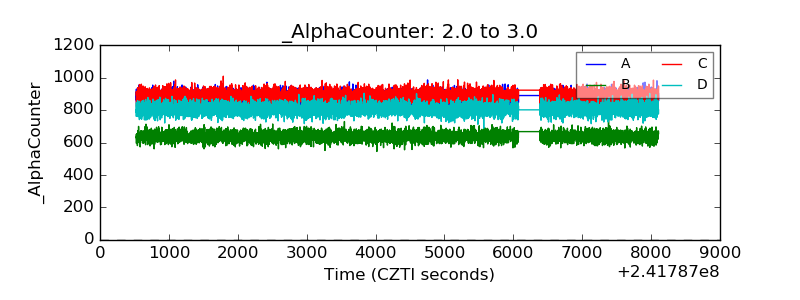 |
| _CPM_Rate | 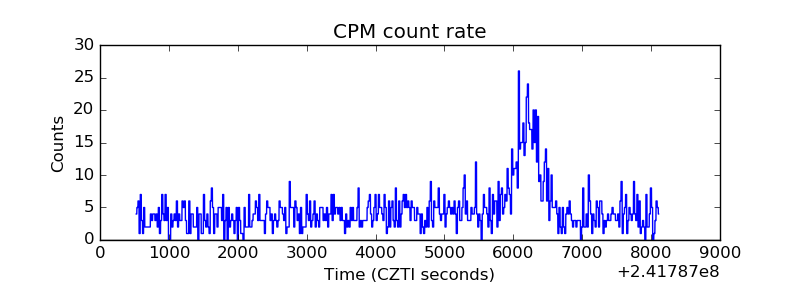 |
| CZT Counter | 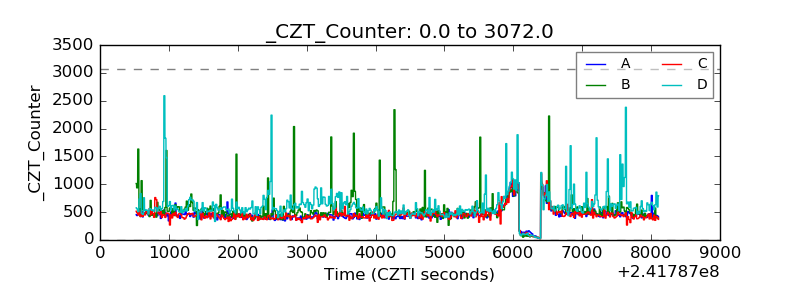 |
| +2.5 Volts monitor |  |
| +5 Volts monitor |  |
| _ROLL_ROT | 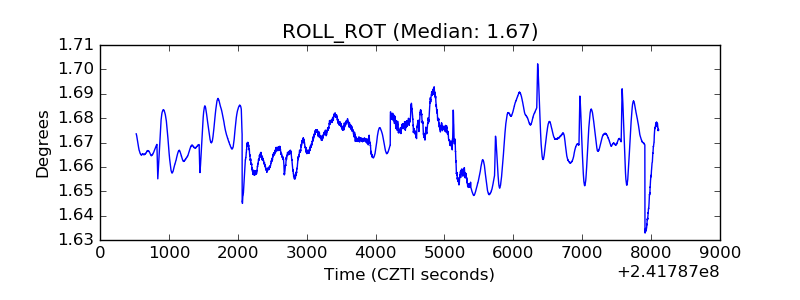 |
| _Roll_DEC | 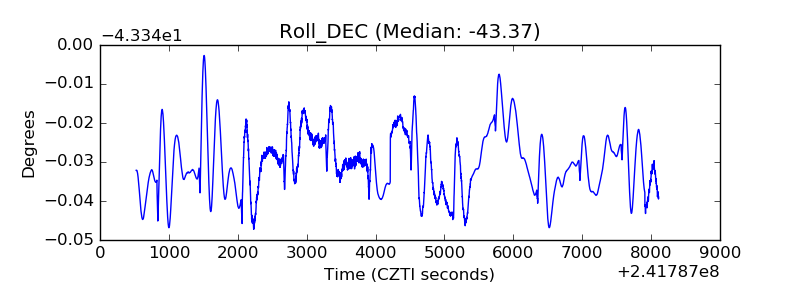 |
| _Roll_RA | 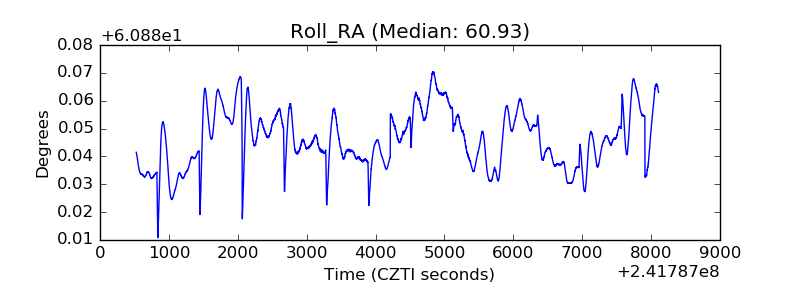 |
| Veto Counter | 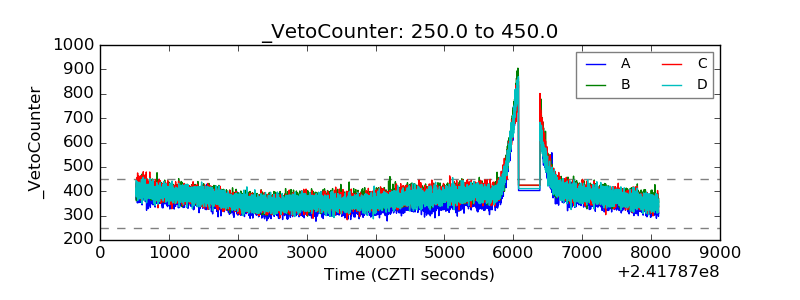 |