| Param | Original file | Final file |
|---|---|---|
| Filename | modeM0/AS1G07_068T01_9000001502_10398cztM0_level2.evt | modeM0/AS1G07_068T01_9000001502_10398cztM0_level2_quad_clean.evt |
| Size (bytes) | 158,915,520 | 12,438,720 |
| Size | 151.6 MB | 11.9 MB |
| Events in quadrant A | 1,011,328 | 56,033 |
| Events in quadrant B | 1,089,564 | 55,331 |
| Events in quadrant C | 993,545 | 60,031 |
| Events in quadrant D | 1,570,830 | 50,755 |
| Mode M0 | |||
|---|---|---|---|
| Quadrant | BADHDUFLAG | Total packets | Discarded packets |
| A | 0 | 11647 | 7161 |
| B | 0 | 12834 | 8238 |
| C | 0 | 12226 | 7696 |
| D | 0 | 17544 | 11430 |
| Mode M9 | |||
|---|---|---|---|
| Quadrant | BADHDUFLAG | Total packets | Discarded packets |
| A | 0 | 4 | 2 |
| B | 0 | 4 | 2 |
| C | 0 | 4 | 2 |
| D | 0 | 4 | 2 |
| Mode SS | |||
|---|---|---|---|
| Quadrant | BADHDUFLAG | Total packets | Discarded packets |
| A | 0 | 116 | 68 |
| B | 0 | 116 | 70 |
| C | 0 | 116 | 68 |
| D | 0 | 110 | 62 |
| Quadrant | Total seconds | Saturated seconds | Saturation percentage |
|---|---|---|---|
| A | 2146 | 71 | 3.308481% |
| B | 2102 | 91 | 4.329210% |
| C | 2157 | 50 | 2.318034% |
| D | 2082 | 79 | 3.794428% |
Noise dominated data is calculated using 1-second bins in cleaned event files. If a bin has >2000 counts, and if more than 50% of those come from <1% of pixels, then it is considered to be noise-dominated and hence unusable.
| Quadrant | # 1 sec bins | Bins with >0 counts | Bins with >2000 counts | High rate bins dominated by noise | Noise dominated (total time) | Noise dominated (detector-on time) | Marked lightcurve |
|---|---|---|---|---|---|---|---|
| A | 2986 | 2541 | 0 | 0 | 0.00% | 0.00% | 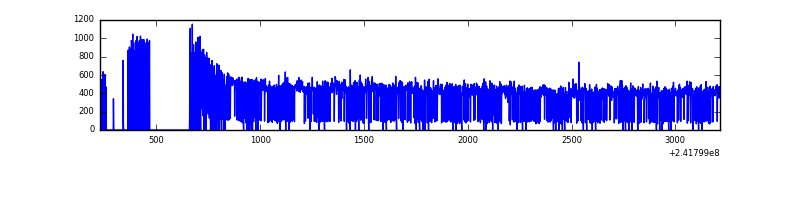 |
| B | 2986 | 2514 | 0 | 0 | 0.00% | 0.00% | 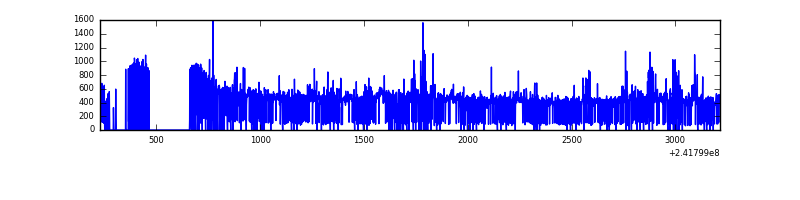 |
| C | 2987 | 2564 | 0 | 0 | 0.00% | 0.00% | 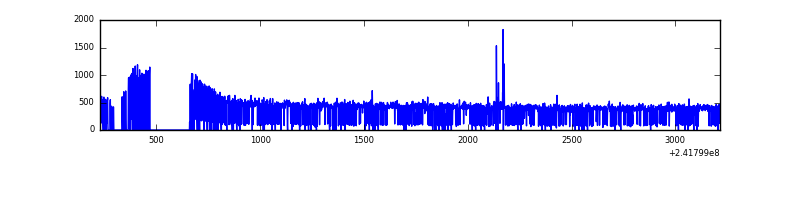 |
| D | 2982 | 2456 | 6 | 6 | 0.20% | 0.24% | 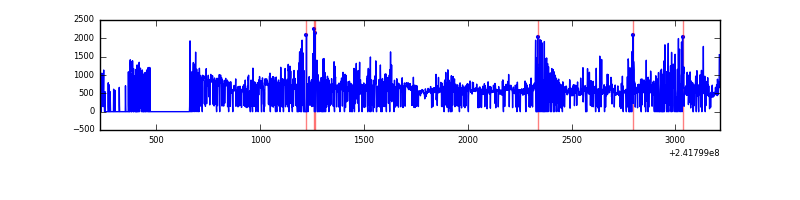 |
Top three noisy pixels from each quadrant. If the there are fewer than three noisy pixels in the level2.evt file, extra rows are filled as -1
| Pixel properties | Quadrant properties | ||||||
|---|---|---|---|---|---|---|---|
| Quadrant | DetID | PixID | Counts | Sigma | Mean | Median | Sigma |
| A | 1 | 162 | 3284 | 54.52 | 259 | 252 | 55.6 |
| A | 8 | 15 | 2999 | 49.4 | 259 | 252 | 55.6 |
| A | 14 | 254 | 2873 | 47.13 | 259 | 252 | 55.6 |
| B | 4 | 239 | 34254 | 664.8 | 254 | 248 | 51.2 |
| B | 11 | 51 | 18296 | 352.83 | 254 | 248 | 51.2 |
| B | 0 | 214 | 13917 | 267.22 | 254 | 248 | 51.2 |
| C | 14 | 234 | 8435 | 136.06 | 250 | 251 | 60.1 |
| C | 8 | 128 | 3674 | 56.91 | 250 | 251 | 60.1 |
| C | 8 | 112 | 2235 | 32.98 | 250 | 251 | 60.1 |
| D | 8 | 195 | 197995 | 3265.64 | 244 | 236 | 60.6 |
| D | 1 | 20 | 191842 | 3164.04 | 244 | 236 | 60.6 |
| D | 1 | 52 | 156743 | 2584.44 | 244 | 236 | 60.6 |
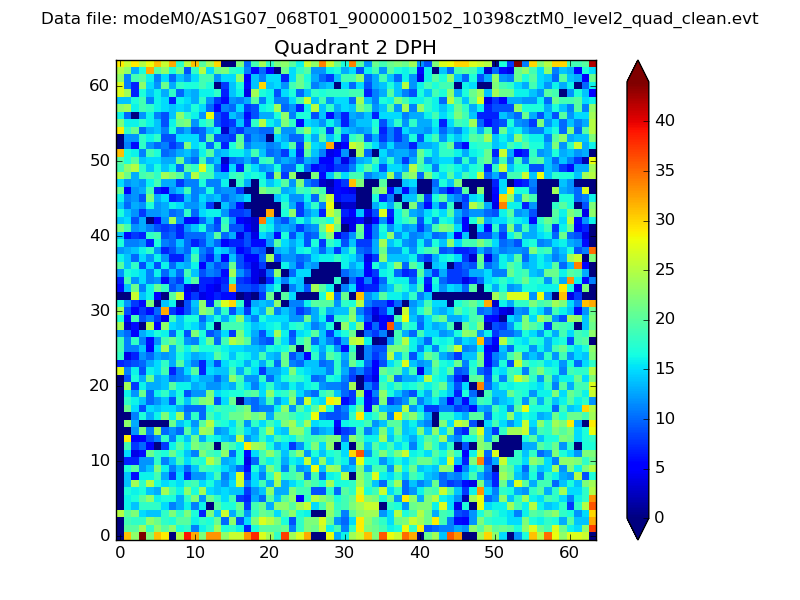
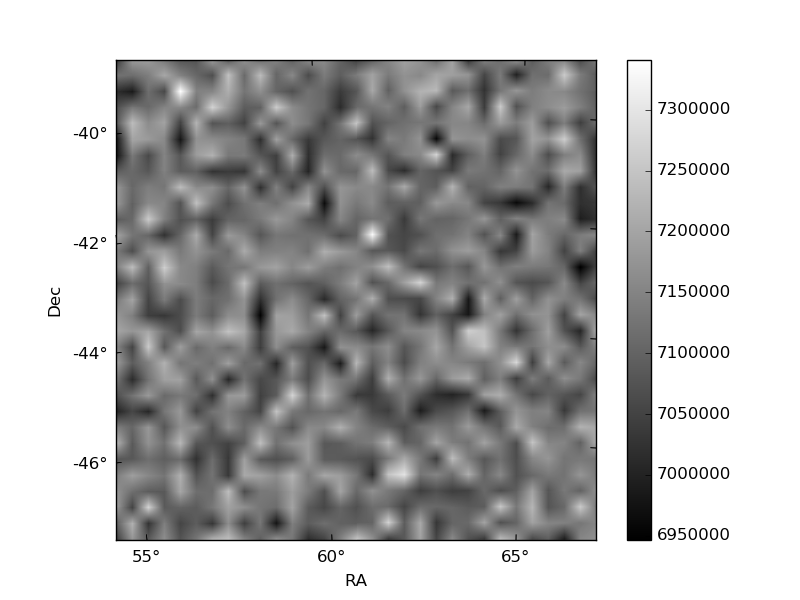
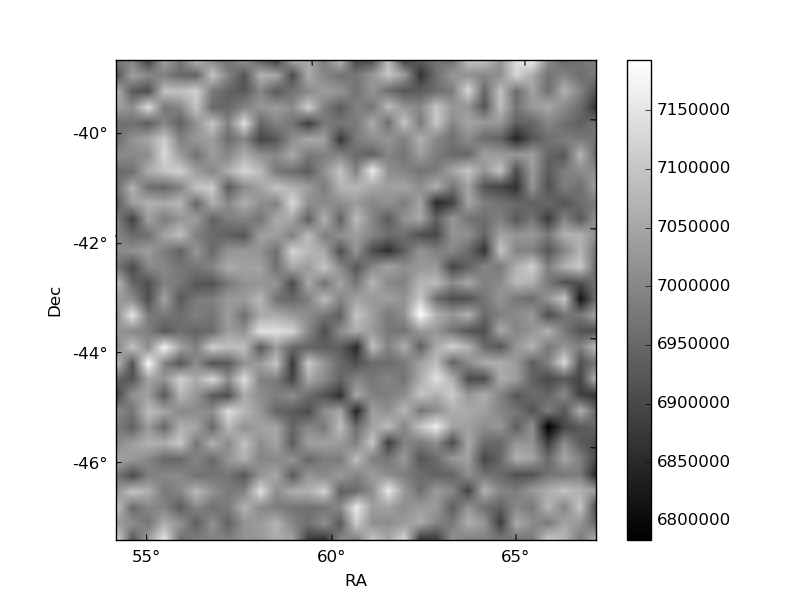
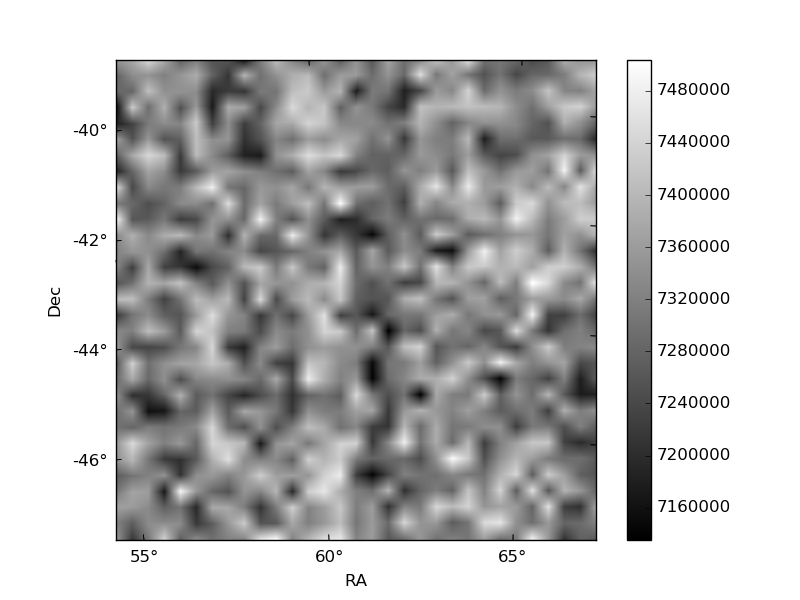
Histogram calculated using DETX and DETY for each event in the final _common_clean file
| Quadrant A | 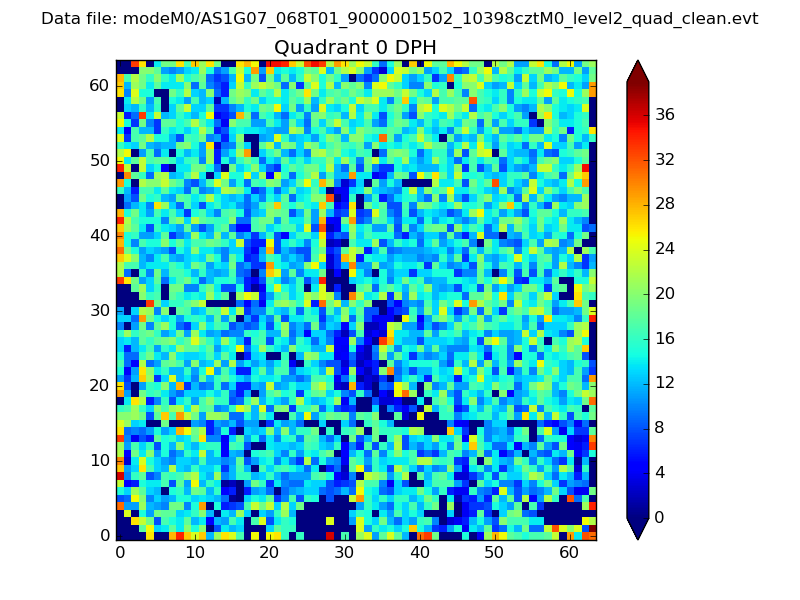 |
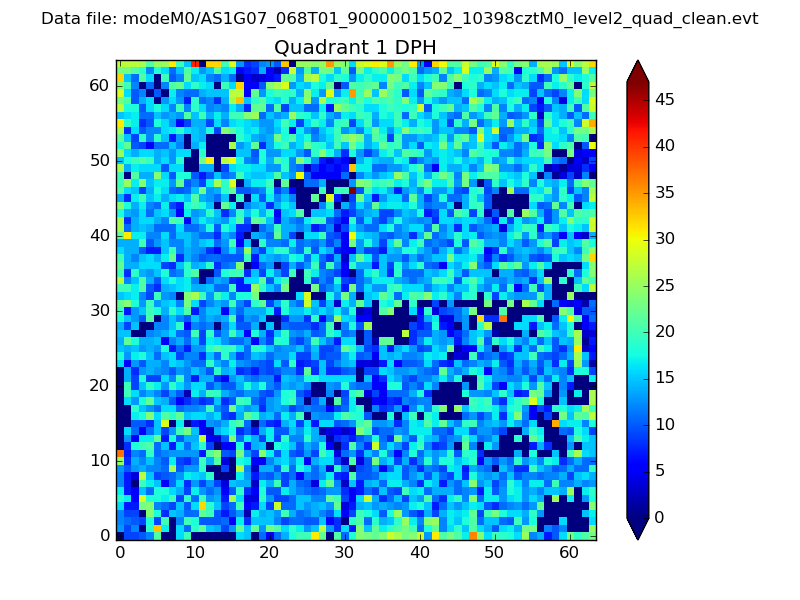 |
Quadrant B |
|---|---|---|---|
| Quadrant D | 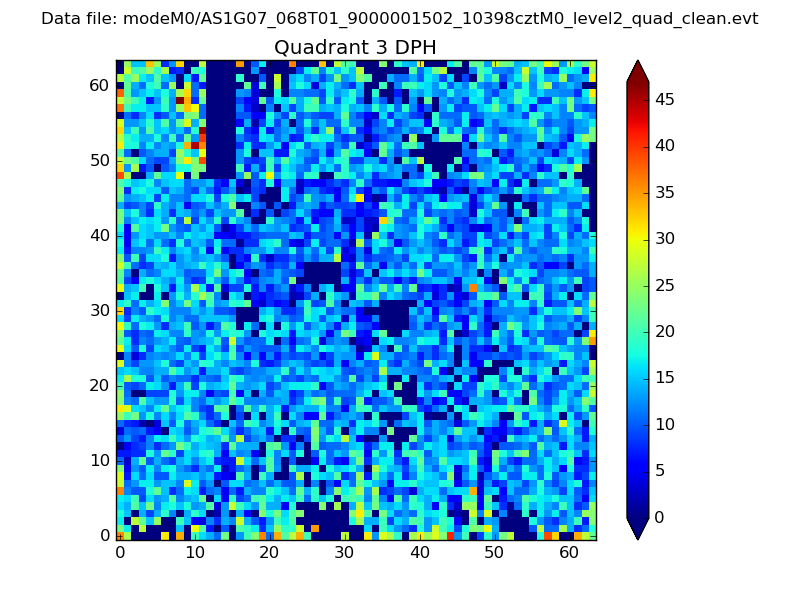 |
 |
Quadrant C |
| Plot type | Count rate plots | Images |
|---|---|---|
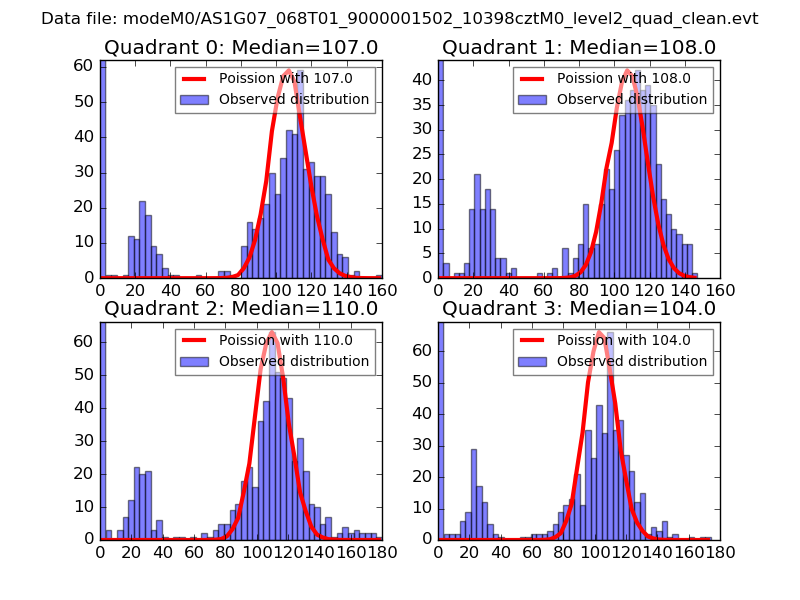
| Comparison with Poisson distribution Blue bars denote a histogram of data divided into 1 sec bins. Red curve is a Poisson curve with rate = median count rate of data. |
 |
 |
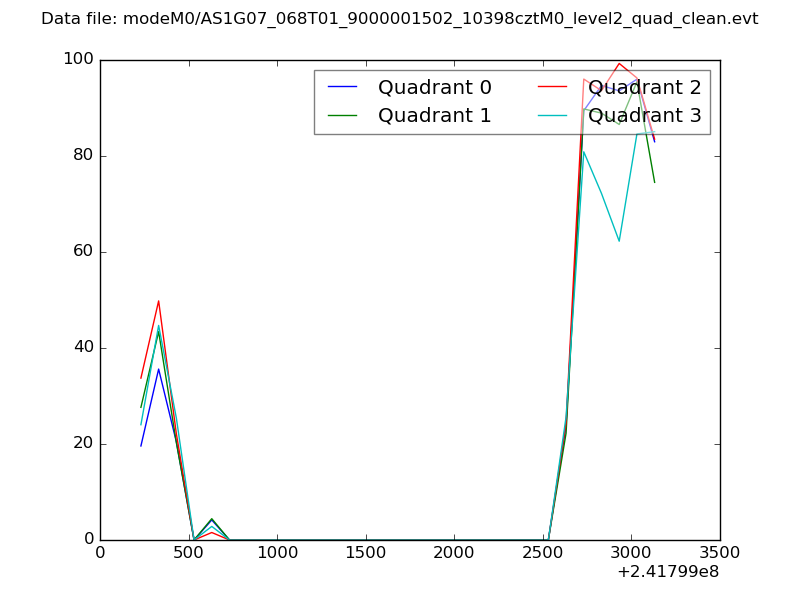
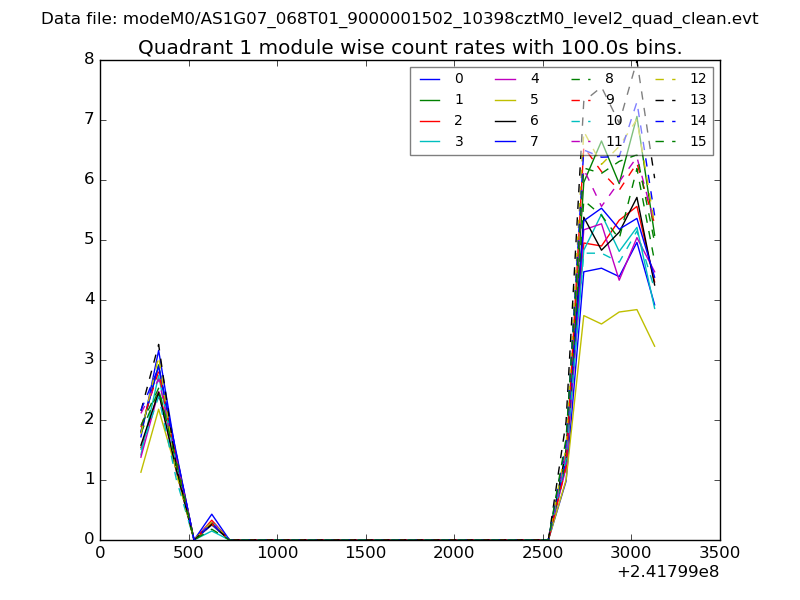
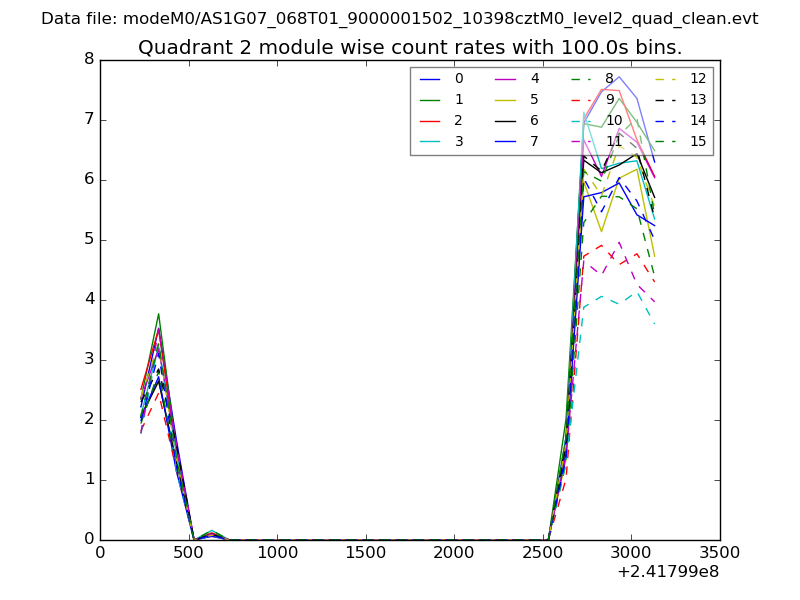
| Quadrant-wise count rates Data is divided into 100 sec bins |
 |
|
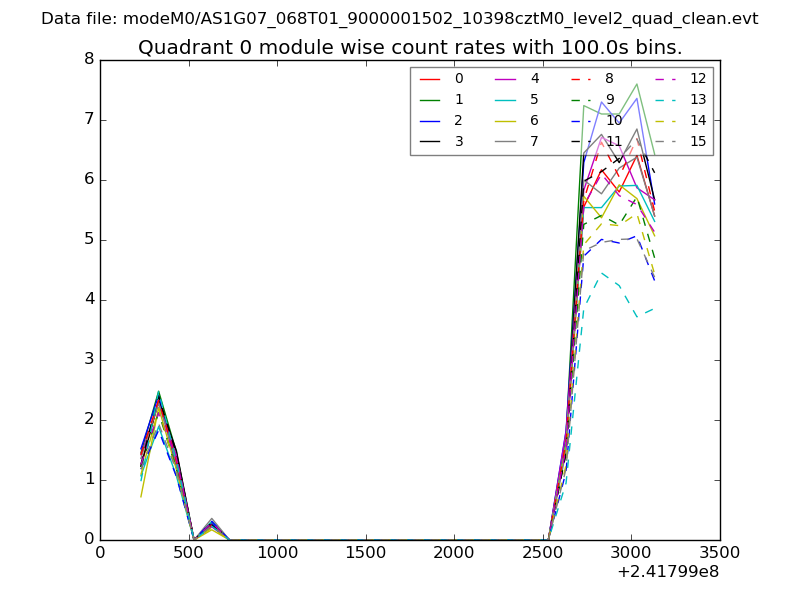
| Module-wise count rates for Quadrant A Data is divided into 100 sec bins |
 |
 |
| Module-wise count rates for Quadrant B Data is divided into 100 sec bins |
 |
 |
| Module-wise count rates for Quadrant C Data is divided into 100 sec bins |
 |
 |
| Module-wise count rates for Quadrant D Data is divided into 100 sec bins |
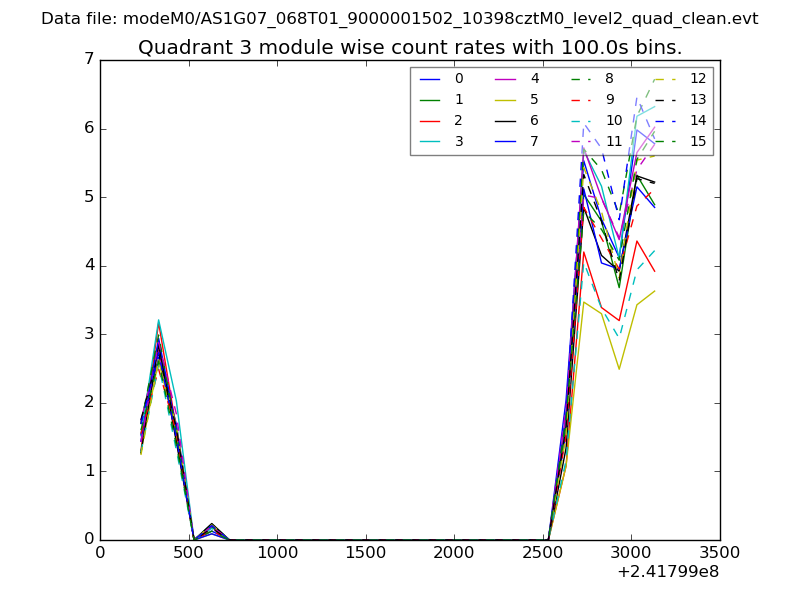 |
 |
| Parameter | Plot |
|---|---|
| CZT HV Monitor | 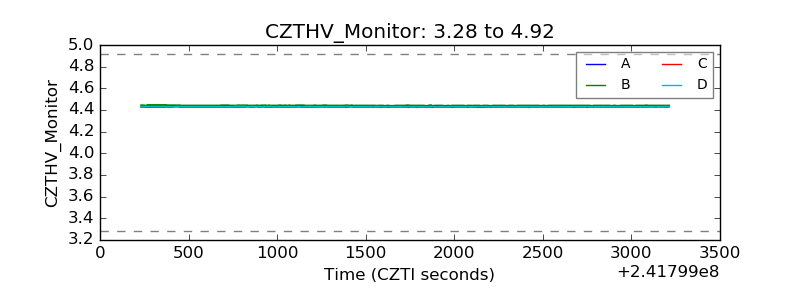 |
| D_VDD | 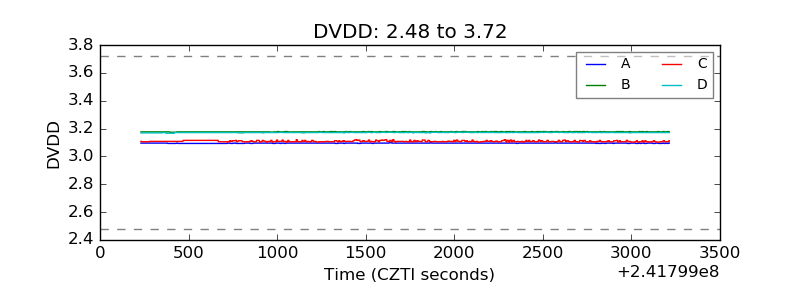 |
| Temperature 1 | 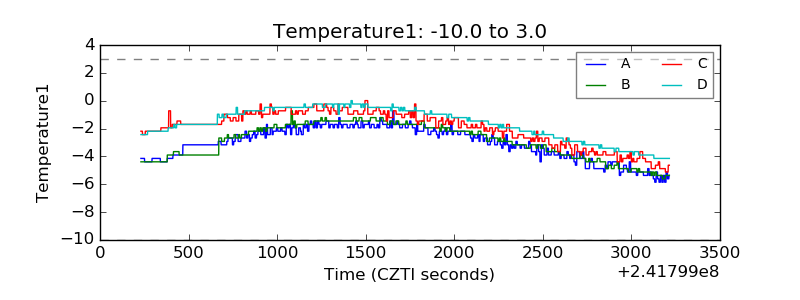 |
| Veto HV Monitor | 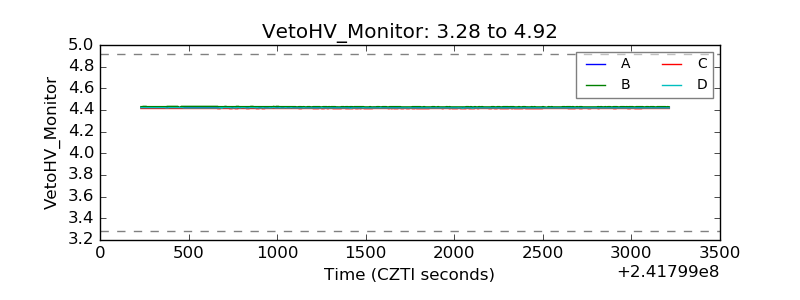 |
| Veto LLD | 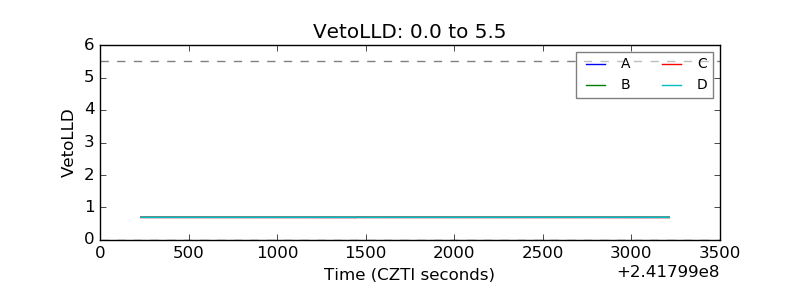 |
| Alpha Counter | 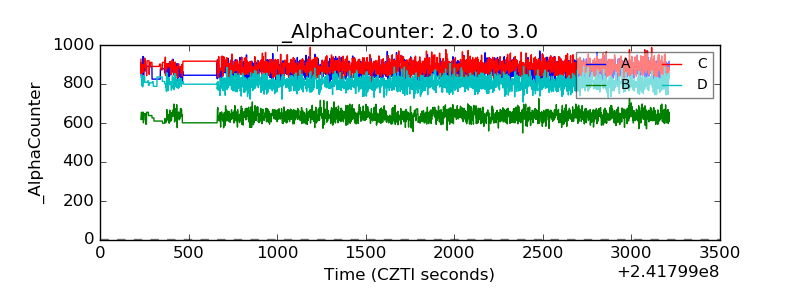 |
| _CPM_Rate | 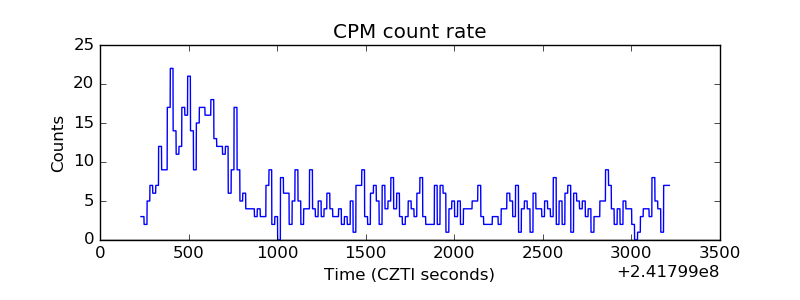 |
| CZT Counter | 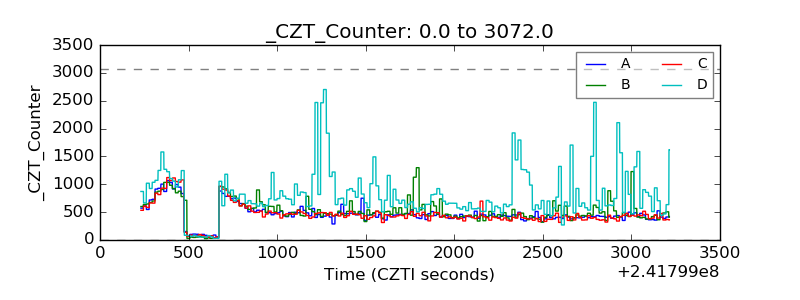 |
| +2.5 Volts monitor |  |
| +5 Volts monitor |  |
| _ROLL_ROT | 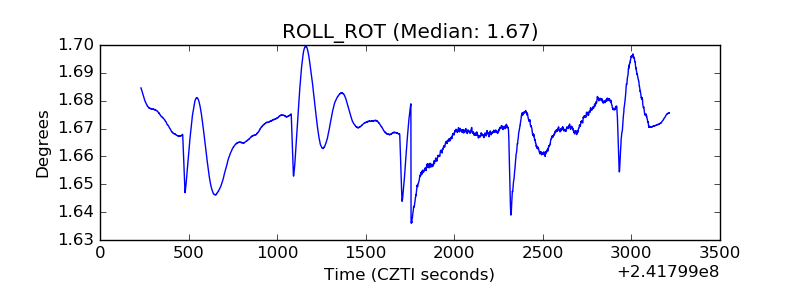 |
| _Roll_DEC | 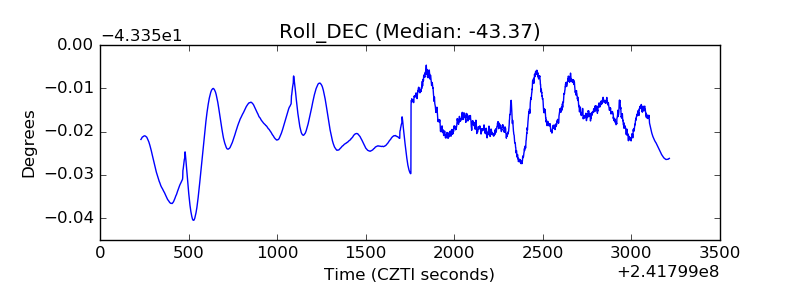 |
| _Roll_RA | 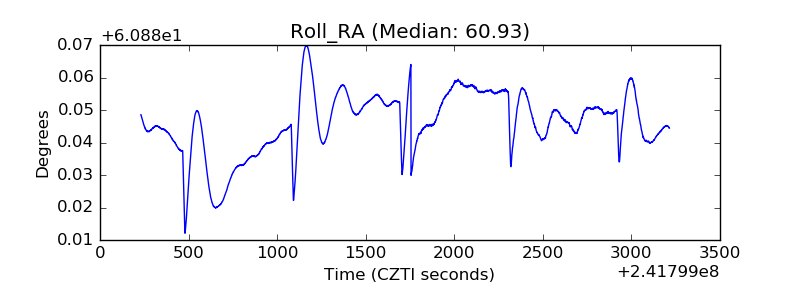 |
| Veto Counter | 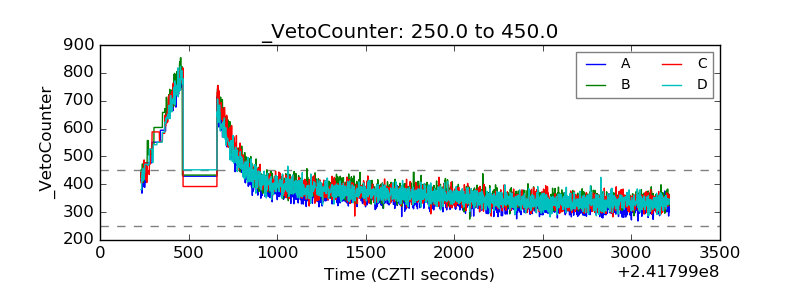 |