| Param | Original file | Final file |
|---|---|---|
| Filename | modeM0/AS1G07_046T01_9000001506cztM0_level2.fits | modeM0/AS1G07_046T01_9000001506cztM0_level2_quad_clean.evt |
| Size (bytes) | 370,281,600 | 352,186,560 |
| Size | 353.1 MB | 335.9 MB |
| Events in quadrant A | 2,218,906 | 2,086,240 |
| Events in quadrant B | 2,110,690 | 2,009,484 |
| Events in quadrant C | 2,223,570 | 2,018,523 |
| Events in quadrant D | 1,906,680 | 1,799,364 |
| Mode SS | |||
|---|---|---|---|
| Quadrant | BADHDUFLAG | Total packets | Discarded packets |
| A | 0 | 716 | 0 |
| B | 0 | 722 | 0 |
| C | 0 | 726 | 0 |
| D | 0 | 723 | 0 |
| Mode M0 | |||
|---|---|---|---|
| Quadrant | BADHDUFLAG | Total packets | Discarded packets |
| A | 0 | 87879 | 0 |
| B | 0 | 99095 | 0 |
| C | 0 | 84110 | 0 |
| D | 0 | 108770 | 0 |
| Mode M9 | |||
|---|---|---|---|
| Quadrant | BADHDUFLAG | Total packets | Discarded packets |
| A | 0 | 44 | 0 |
| B | 0 | 44 | 0 |
| C | 0 | 44 | 0 |
| D | 0 | 44 | 0 |
| Quadrant | Total seconds | Saturated seconds | Saturation percentage |
|---|---|---|---|
| A | 40375 | 949 | 2.350464% |
| B | 39959 | 2052 | 5.135264% |
| C | 40571 | 608 | 1.498607% |
| D | 40778 | 1482 | 3.634313% |
Noise dominated data is calculated using 1-second bins in cleaned event files. If a bin has >2000 counts, and if more than 50% of those come from <1% of pixels, then it is considered to be noise-dominated and hence unusable.
| Quadrant | # 1 sec bins | Bins with >0 counts | Bins with >2000 counts | High rate bins dominated by noise | Noise dominated (total time) | Noise dominated (detector-on time) | Marked lightcurve |
|---|---|---|---|---|---|---|---|
| A | 46316 | 41521 | 0 | 0 | 0.00% | 0.00% |  |
| B | 46316 | 41107 | 0 | 0 | 0.00% | 0.00% |  |
| C | 46316 | 41622 | 0 | 0 | 0.00% | 0.00% |  |
| D | 46316 | 41529 | 0 | 0 | 0.00% | 0.00% |  |
Top three noisy pixels from each quadrant. If the there are fewer than three noisy pixels in the level2.evt file, extra rows are filled as -1
| Pixel properties | Quadrant properties | ||||||
|---|---|---|---|---|---|---|---|
| Quadrant | DetID | PixID | Counts | Sigma | Mean | Median | Sigma |
| A | 0 | 29 | 2250 | 11.43 | 577 | 537 | 149.9 |
| A | 0 | 30 | 1752 | 8.11 | 577 | 537 | 149.9 |
| A | 7 | 110 | 1719 | 7.89 | 577 | 537 | 149.9 |
| B | 2 | 9 | 1746 | 10.62 | 556 | 526 | 114.9 |
| B | 12 | 226 | 1436 | 7.92 | 556 | 526 | 114.9 |
| B | 5 | 225 | 1416 | 7.75 | 556 | 526 | 114.9 |
| C | 1 | 80 | 1663 | 7.2 | 586 | 541 | 155.9 |
| C | 1 | 81 | 1653 | 7.13 | 586 | 541 | 155.9 |
| C | 12 | 241 | 1569 | 6.59 | 586 | 541 | 155.9 |
| D | 6 | 231 | 1416 | 6.24 | 543 | 491 | 148.1 |
| D | 3 | 31 | 1412 | 6.22 | 543 | 491 | 148.1 |
| D | 3 | 14 | 1385 | 6.03 | 543 | 491 | 148.1 |
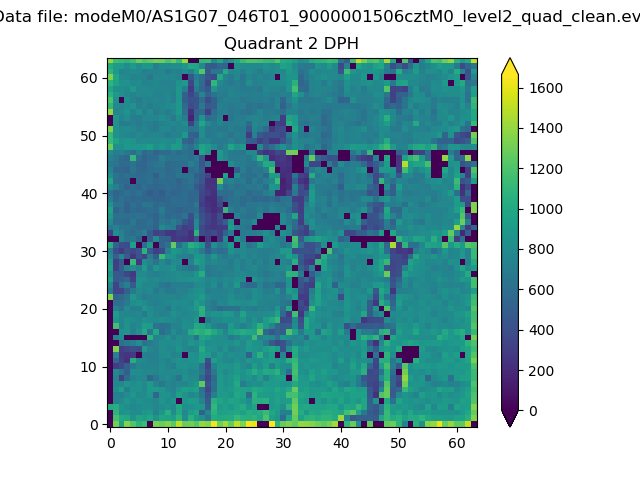
Histogram calculated using DETX and DETY for each event in the final _common_clean file
| Quadrant A |  |
 |
Quadrant B |
|---|---|---|---|
| Quadrant D |  |
 |
Quadrant C |
| Plot type | Count rate plots | Images |
|---|---|---|
| Comparison with Poisson distribution Blue bars denote a histogram of data divided into 1 sec bins. Red curve is a Poisson curve with rate = median count rate of data. |
 |
 |
| Quadrant-wise count rates Data is divided into 100 sec bins |
 |
|
| Module-wise count rates for Quadrant A Data is divided into 100 sec bins |
 |
 |
| Module-wise count rates for Quadrant B Data is divided into 100 sec bins |
 |
 |
| Module-wise count rates for Quadrant C Data is divided into 100 sec bins |
 |
 |
| Module-wise count rates for Quadrant D Data is divided into 100 sec bins |
 |
 |
| Parameter | Plot |
|---|---|
| CZT HV Monitor |  |
| D_VDD | 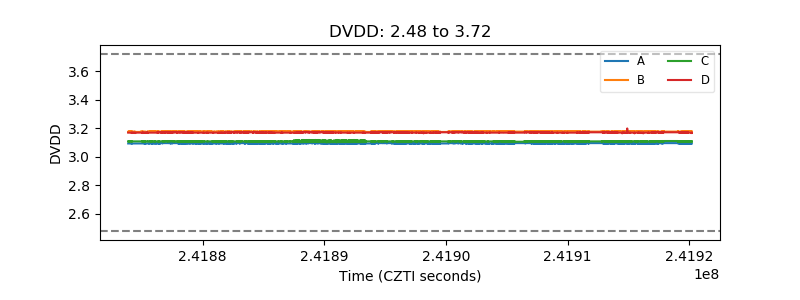 |
| Temperature 1 |  |
| Veto HV Monitor |  |
| Veto LLD |  |
| Alpha Counter |  |
| _CPM_Rate |  |
| CZT Counter |  |
| +2.5 Volts monitor |  |
| +5 Volts monitor |  |
| _ROLL_ROT |  |
| _Roll_DEC |  |
| _Roll_RA |  |
| Veto Counter |  |