| Param | Original file | Final file |
|---|---|---|
| Filename | modeM0/AS1G07_046T01_9000001506_10410cztM0_level2.evt | modeM0/AS1G07_046T01_9000001506_10410cztM0_level2_quad_clean.evt |
| Size (bytes) | 135,783,360 | 13,302,720 |
| Size | 129.5 MB | 12.7 MB |
| Events in quadrant A | 931,287 | 67,597 |
| Events in quadrant B | 934,135 | 75,610 |
| Events in quadrant C | 887,395 | 70,207 |
| Events in quadrant D | 1,238,891 | 62,217 |
| Mode SS | |||
|---|---|---|---|
| Quadrant | BADHDUFLAG | Total packets | Discarded packets |
| A | 0 | 95 | 58 |
| B | 0 | 96 | 56 |
| C | 0 | 96 | 55 |
| D | 0 | 93 | 51 |
| Mode M0 | |||
|---|---|---|---|
| Quadrant | BADHDUFLAG | Total packets | Discarded packets |
| A | 0 | 9370 | 5636 |
| B | 0 | 10115 | 6352 |
| C | 0 | 9434 | 5727 |
| D | 0 | 11908 | 6957 |
| Mode M9 | |||
|---|---|---|---|
| Quadrant | BADHDUFLAG | Total packets | Discarded packets |
| A | 0 | 5 | 2 |
| B | 0 | 6 | 3 |
| C | 0 | 6 | 3 |
| D | 0 | 6 | 3 |
| Quadrant | Total seconds | Saturated seconds | Saturation percentage |
|---|---|---|---|
| A | 1694 | 138 | 8.146399% |
| B | 1663 | 151 | 9.079976% |
| C | 1724 | 104 | 6.032483% |
| D | 1807 | 137 | 7.581627% |
Noise dominated data is calculated using 1-second bins in cleaned event files. If a bin has >2000 counts, and if more than 50% of those come from <1% of pixels, then it is considered to be noise-dominated and hence unusable.
| Quadrant | # 1 sec bins | Bins with >0 counts | Bins with >2000 counts | High rate bins dominated by noise | Noise dominated (total time) | Noise dominated (detector-on time) | Marked lightcurve |
|---|---|---|---|---|---|---|---|
| A | 2524 | 2009 | 0 | 0 | 0.00% | 0.00% | 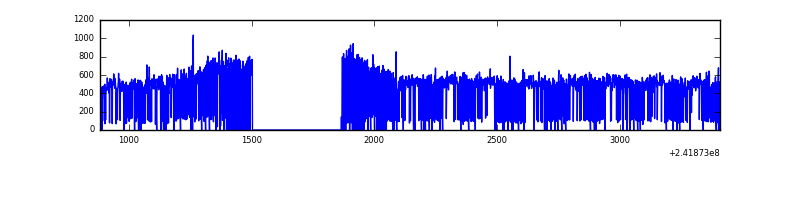 |
| B | 2524 | 1976 | 0 | 0 | 0.00% | 0.00% | 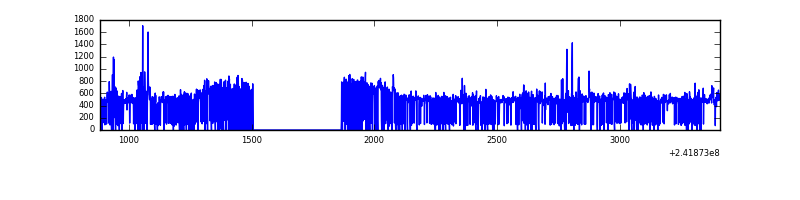 |
| C | 2523 | 2041 | 0 | 0 | 0.00% | 0.00% | 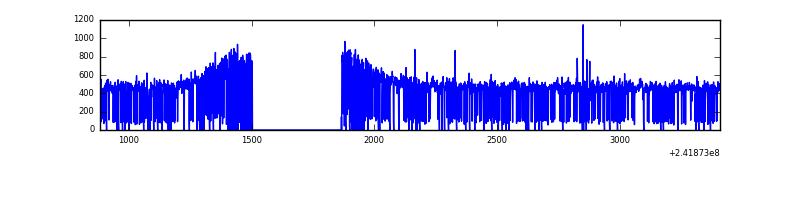 |
| D | 2524 | 2054 | 1 | 1 | 0.04% | 0.05% | 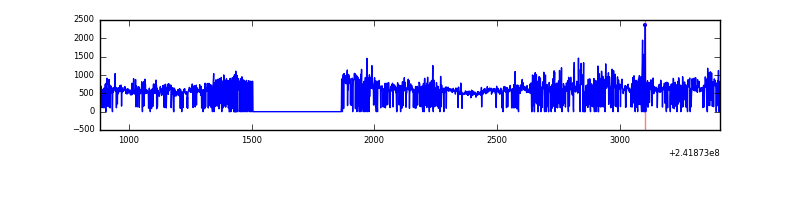 |
Top three noisy pixels from each quadrant. If the there are fewer than three noisy pixels in the level2.evt file, extra rows are filled as -1
| Pixel properties | Quadrant properties | ||||||
|---|---|---|---|---|---|---|---|
| Quadrant | DetID | PixID | Counts | Sigma | Mean | Median | Sigma |
| A | 13 | 251 | 60707 | 1241.82 | 226 | 219 | 48.7 |
| A | 0 | 226 | 2034 | 37.26 | 226 | 219 | 48.7 |
| A | 12 | 194 | 1782 | 32.09 | 226 | 219 | 48.7 |
| B | 4 | 239 | 35447 | 784.29 | 221 | 215 | 44.9 |
| B | 0 | 219 | 20013 | 440.72 | 221 | 215 | 44.9 |
| B | 4 | 81 | 7403 | 160.01 | 221 | 215 | 44.9 |
| C | 14 | 234 | 5346 | 93.75 | 226 | 225 | 54.6 |
| C | 13 | 61 | 1646 | 26.01 | 226 | 225 | 54.6 |
| C | 3 | 202 | 539 | 5.75 | 226 | 225 | 54.6 |
| D | 1 | 20 | 148822 | 2499.49 | 235 | 227 | 59.5 |
| D | 8 | 195 | 105444 | 1769.83 | 235 | 227 | 59.5 |
| D | 1 | 52 | 43797 | 732.88 | 235 | 227 | 59.5 |
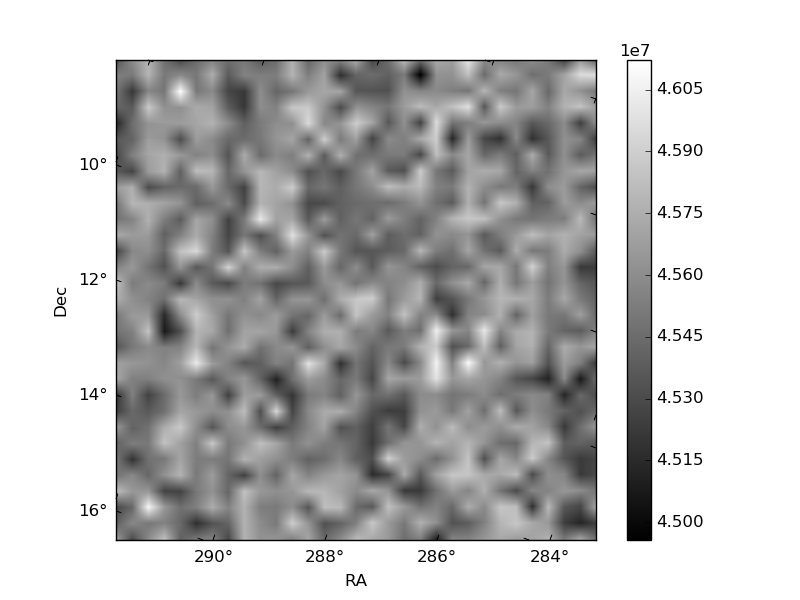
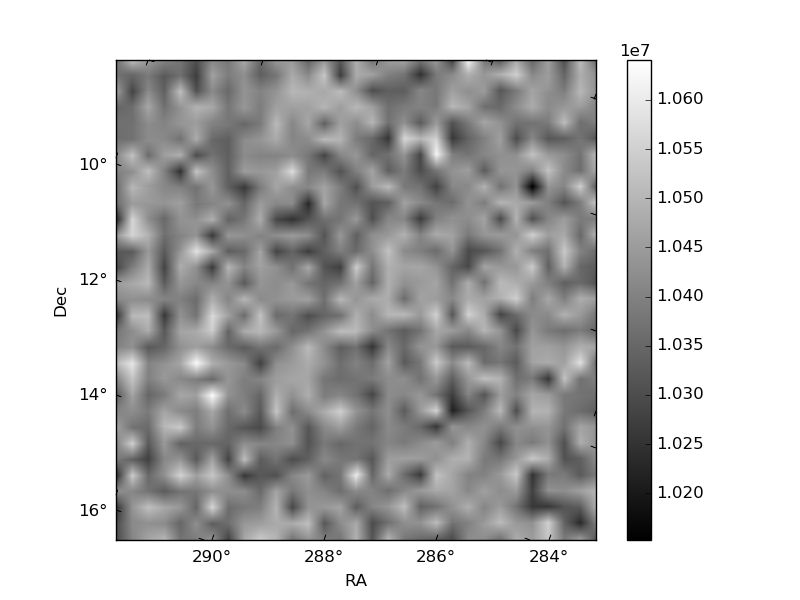
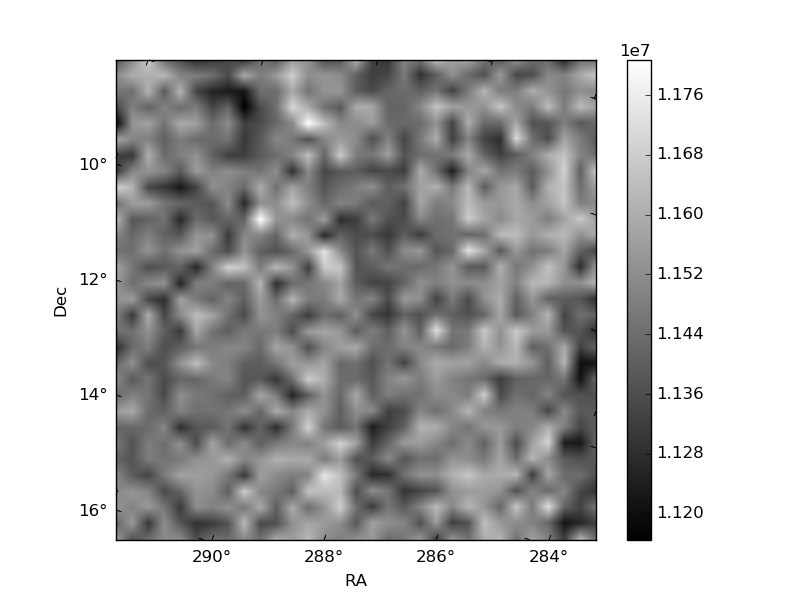
Histogram calculated using DETX and DETY for each event in the final _common_clean file
| Quadrant A | 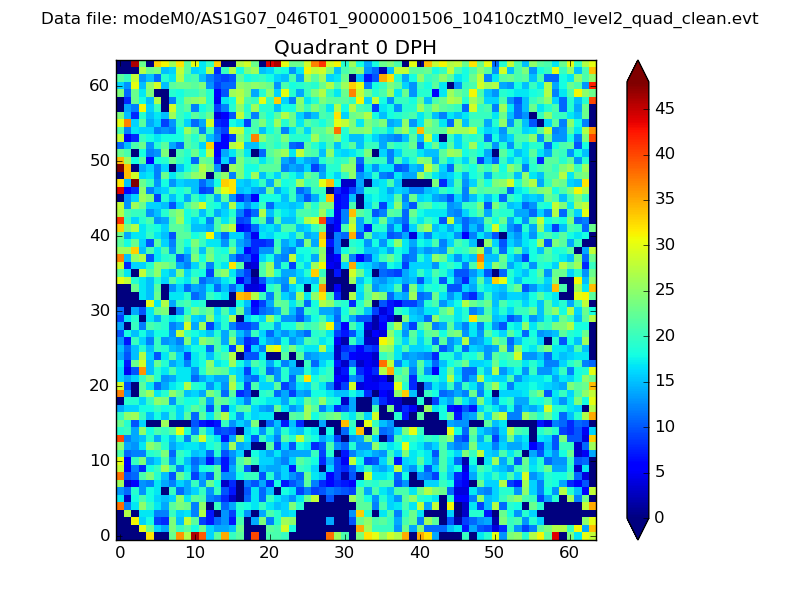 |
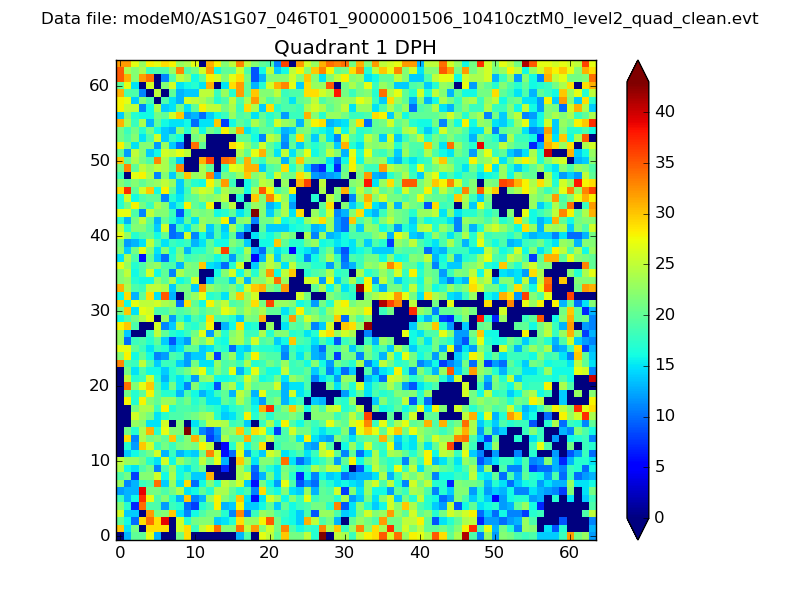 |
Quadrant B |
|---|---|---|---|
| Quadrant D | 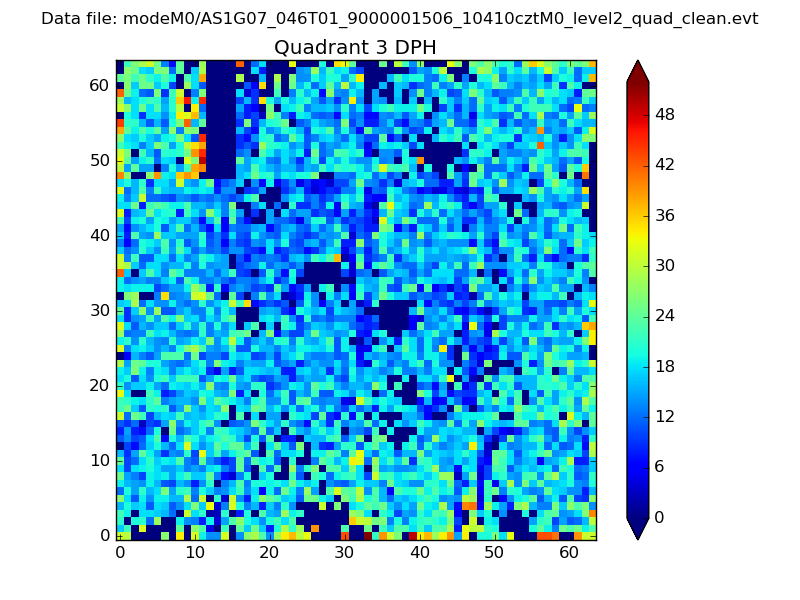 |
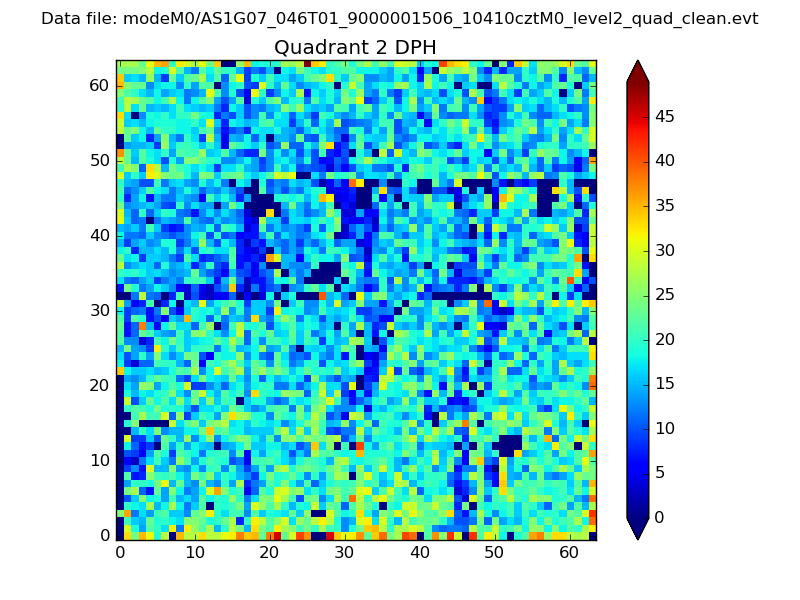 |
Quadrant C |
| Plot type | Count rate plots | Images |
|---|---|---|
| Comparison with Poisson distribution Blue bars denote a histogram of data divided into 1 sec bins. Red curve is a Poisson curve with rate = median count rate of data. |
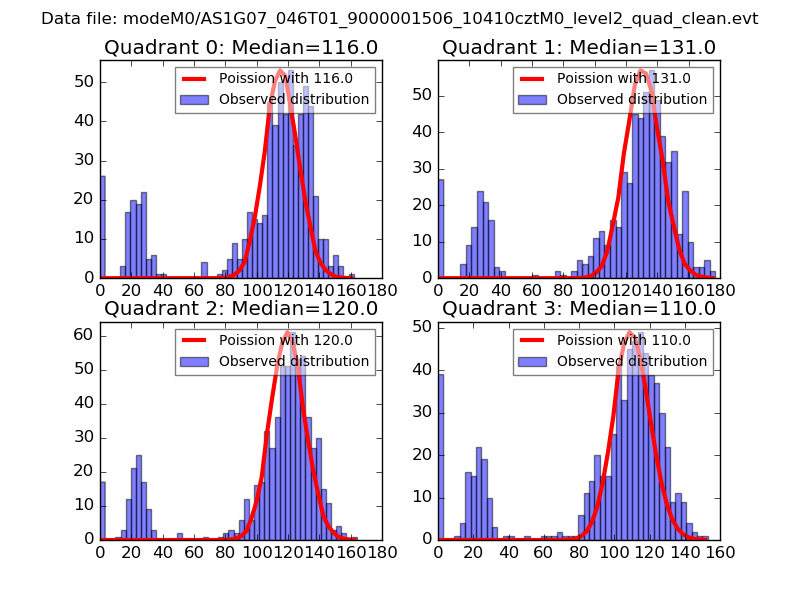 |
 |
| Quadrant-wise count rates Data is divided into 100 sec bins |
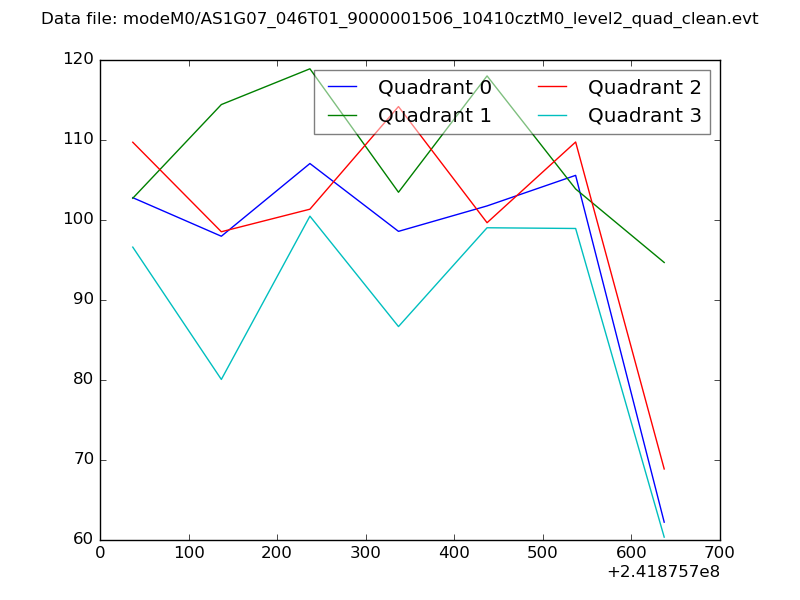 |
|
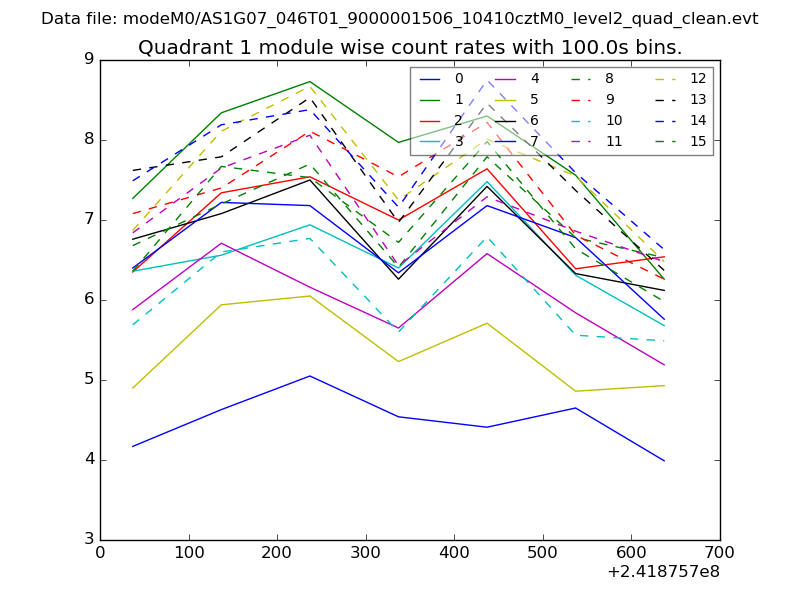
| Module-wise count rates for Quadrant A Data is divided into 100 sec bins |
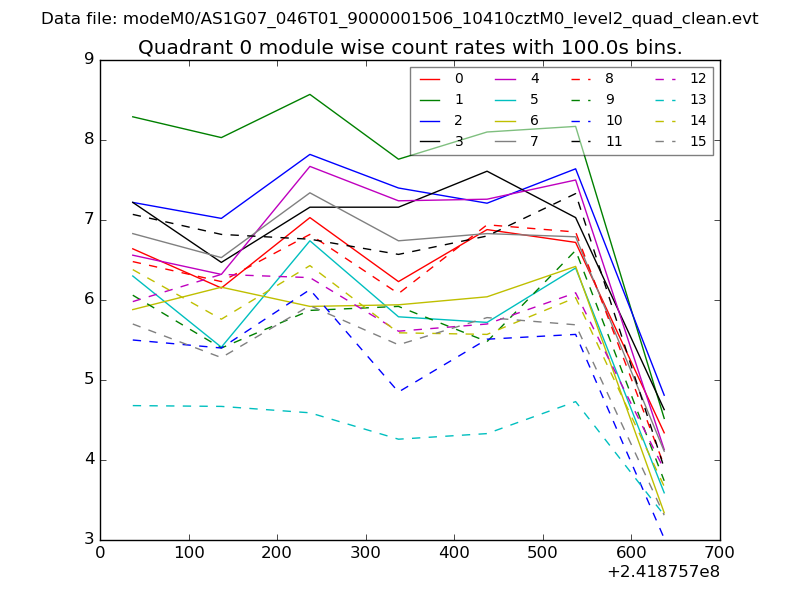 |
 |
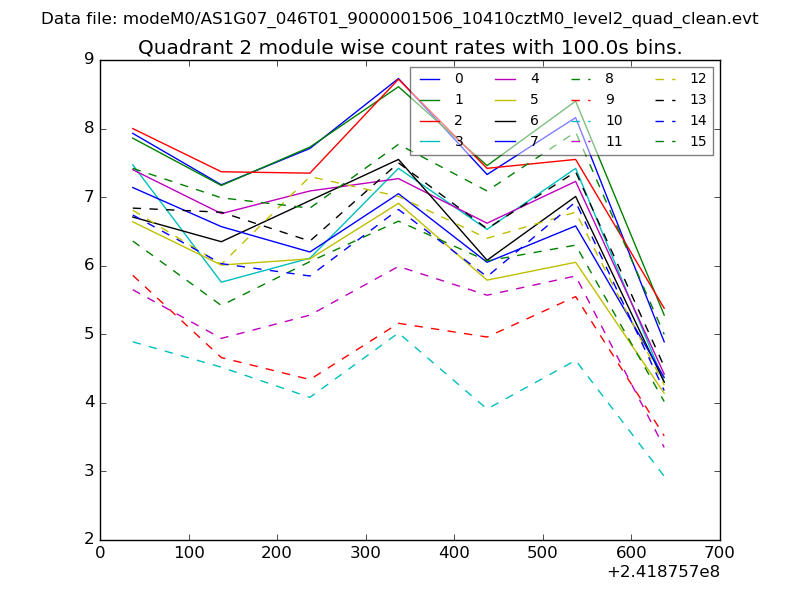
| Module-wise count rates for Quadrant B Data is divided into 100 sec bins |
 |
 |
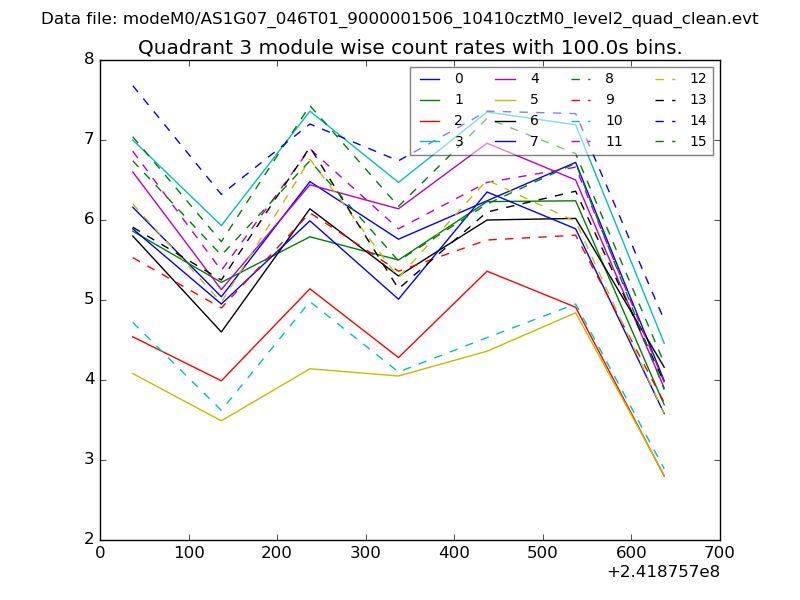
| Module-wise count rates for Quadrant C Data is divided into 100 sec bins |
 |
 |
| Module-wise count rates for Quadrant D Data is divided into 100 sec bins |
 |
 |
| Parameter | Plot |
|---|---|
| CZT HV Monitor | 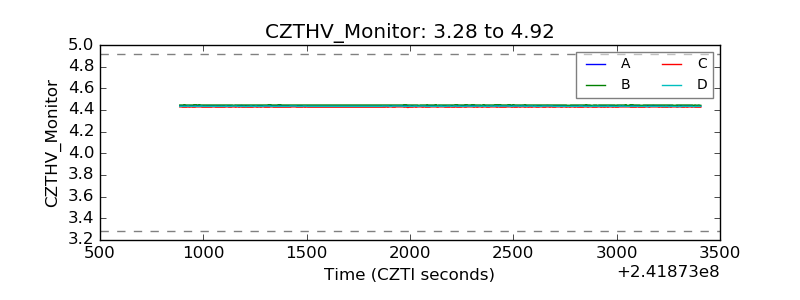 |
| D_VDD | 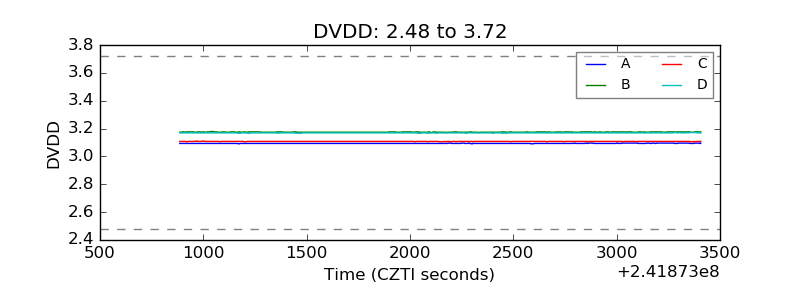 |
| Temperature 1 | 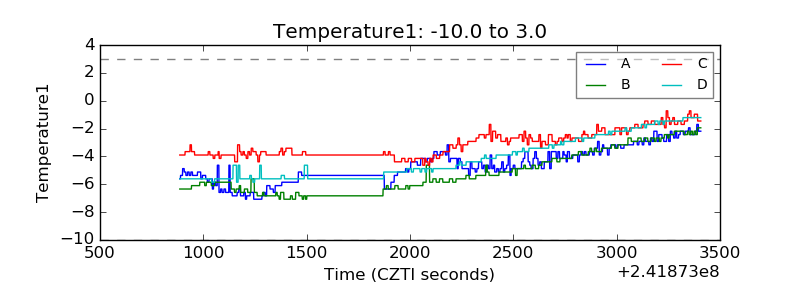 |
| Veto HV Monitor | 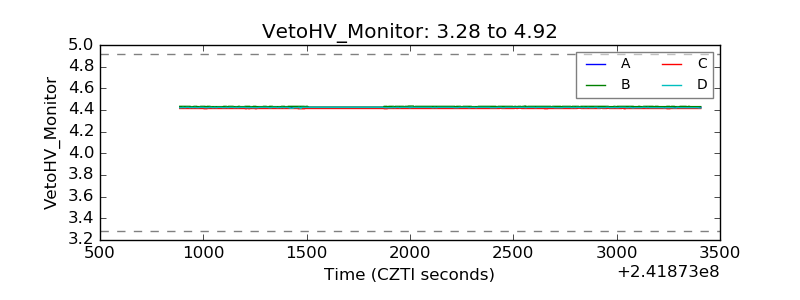 |
| Veto LLD | 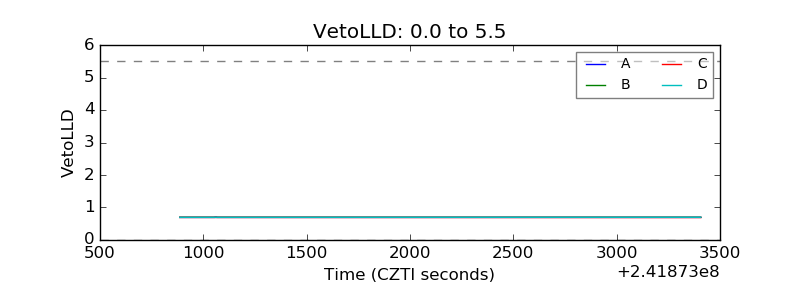 |
| Alpha Counter | 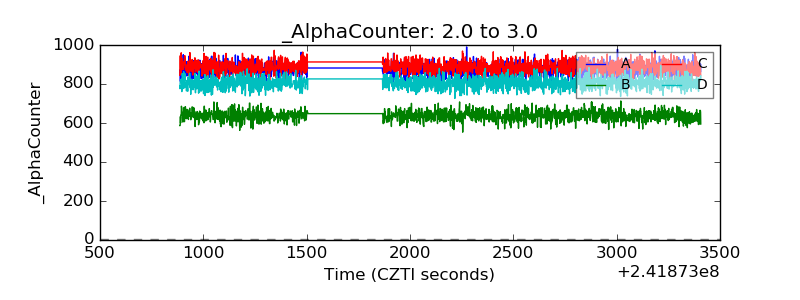 |
| _CPM_Rate | 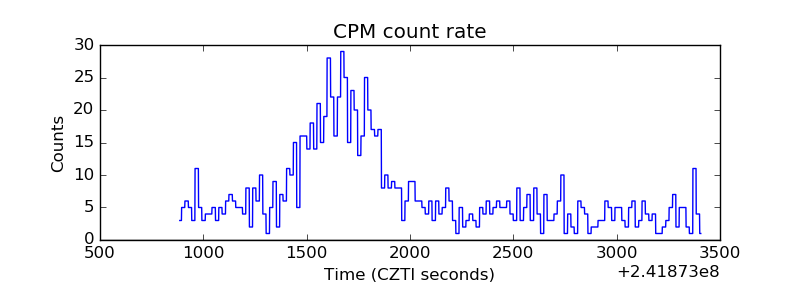 |
| CZT Counter | 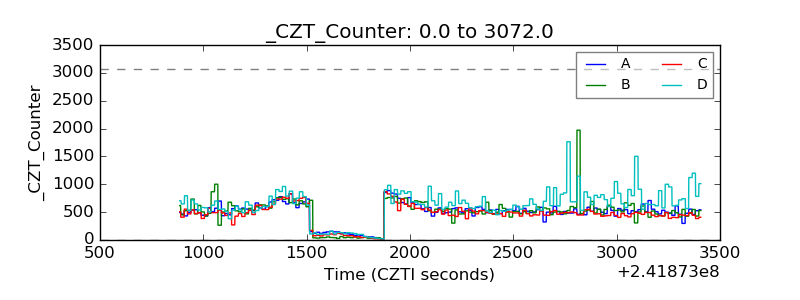 |
| +2.5 Volts monitor |  |
| +5 Volts monitor | 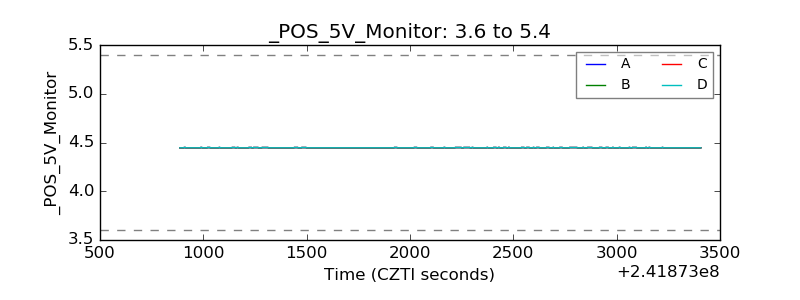 |
| _ROLL_ROT | 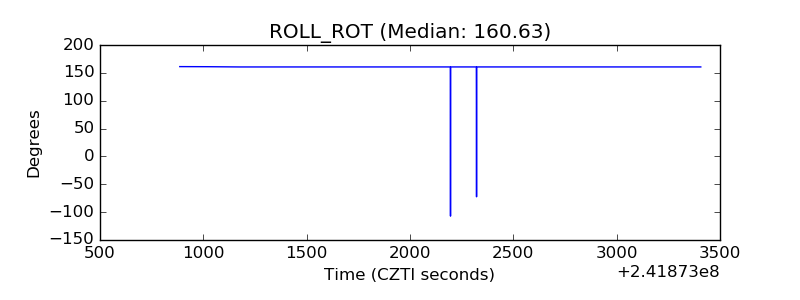 |
| _Roll_DEC | 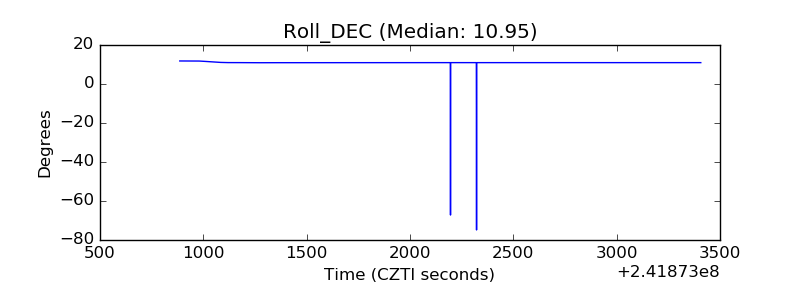 |
| _Roll_RA | 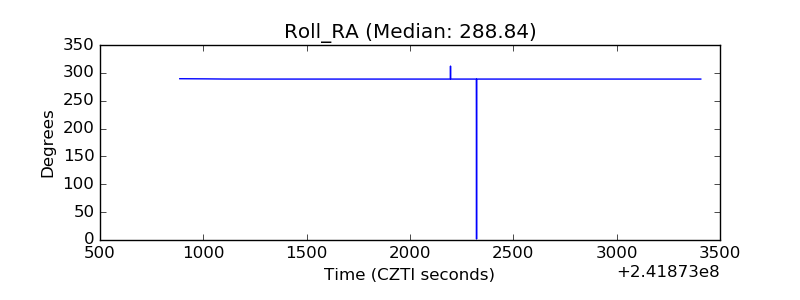 |
| Veto Counter | 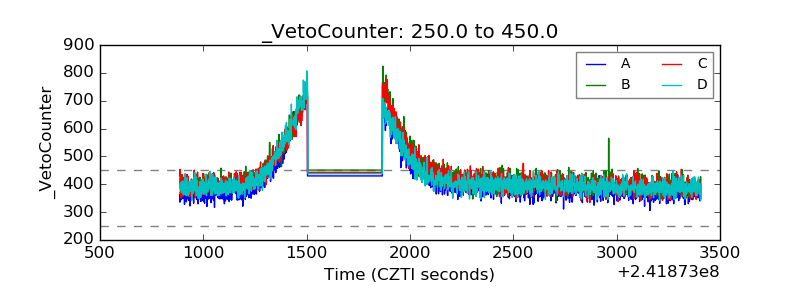 |