| Param | Original file | Final file |
|---|---|---|
| Filename | modeM0/AS1G07_046T01_9000001506_10419cztM0_level2.evt | modeM0/AS1G07_046T01_9000001506_10419cztM0_level2_quad_clean.evt |
| Size (bytes) | 472,901,760 | 76,343,040 |
| Size | 451.0 MB | 72.8 MB |
| Events in quadrant A | 3,432,453 | 480,078 |
| Events in quadrant B | 3,891,673 | 487,357 |
| Events in quadrant C | 2,672,851 | 483,345 |
| Events in quadrant D | 3,922,517 | 446,739 |
| Mode SS | |||
|---|---|---|---|
| Quadrant | BADHDUFLAG | Total packets | Discarded packets |
| A | 0 | 122 | 0 |
| B | 0 | 122 | 0 |
| C | 0 | 122 | 0 |
| D | 0 | 122 | 0 |
| Mode M0 | |||
|---|---|---|---|
| Quadrant | BADHDUFLAG | Total packets | Discarded packets |
| A | 0 | 14269 | 1 |
| B | 0 | 15459 | 11 |
| C | 0 | 12026 | 1 |
| D | 0 | 15341 | 1 |
| Mode M9 | |||
|---|---|---|---|
| Quadrant | BADHDUFLAG | Total packets | Discarded packets |
| A | 0 | 11 | 0 |
| B | 0 | 11 | 0 |
| C | 0 | 11 | 0 |
| D | 0 | 11 | 0 |
| Quadrant | Total seconds | Saturated seconds | Saturation percentage |
|---|---|---|---|
| A | 5922 | 89 | 1.502871% |
| B | 5920 | 281 | 4.746622% |
| C | 5922 | 14 | 0.236407% |
| D | 5922 | 210 | 3.546099% |
Noise dominated data is calculated using 1-second bins in cleaned event files. If a bin has >2000 counts, and if more than 50% of those come from <1% of pixels, then it is considered to be noise-dominated and hence unusable.
| Quadrant | # 1 sec bins | Bins with >0 counts | Bins with >2000 counts | High rate bins dominated by noise | Noise dominated (total time) | Noise dominated (detector-on time) | Marked lightcurve |
|---|---|---|---|---|---|---|---|
| A | 7022 | 5923 | 34 | 34 | 0.48% | 0.57% | 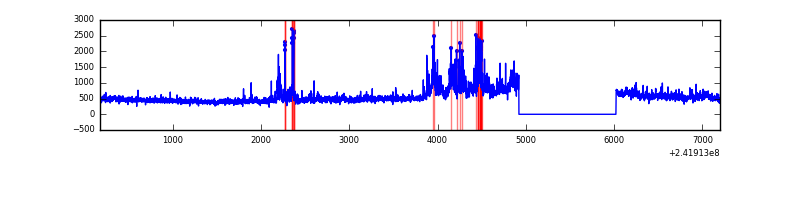 |
| B | 7022 | 5922 | 171 | 171 | 2.44% | 2.89% | 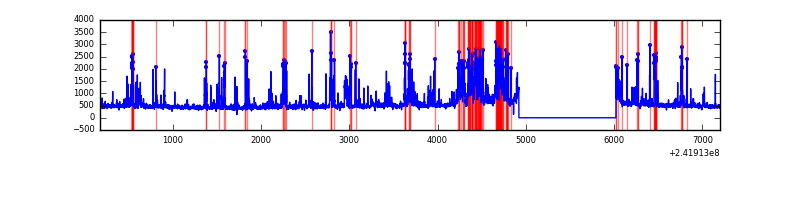 |
| C | 7022 | 5922 | 1 | 1 | 0.01% | 0.02% | 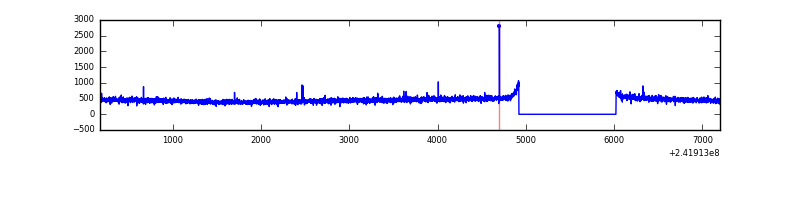 |
| D | 7022 | 5923 | 151 | 151 | 2.15% | 2.55% | 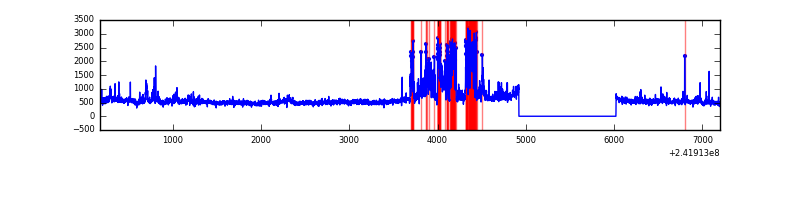 |
Top three noisy pixels from each quadrant. If the there are fewer than three noisy pixels in the level2.evt file, extra rows are filled as -1
| Pixel properties | Quadrant properties | ||||||
|---|---|---|---|---|---|---|---|
| Quadrant | DetID | PixID | Counts | Sigma | Mean | Median | Sigma |
| A | 13 | 251 | 721041 | 5086.43 | 697 | 685 | 141.6 |
| A | 1 | 162 | 13033 | 87.19 | 697 | 685 | 141.6 |
| A | 0 | 226 | 6430 | 40.57 | 697 | 685 | 141.6 |
| B | 4 | 239 | 1016237 | 7596.14 | 699 | 683 | 133.7 |
| B | 10 | 245 | 83663 | 620.67 | 699 | 683 | 133.7 |
| B | 0 | 214 | 43033 | 316.77 | 699 | 683 | 133.7 |
| C | 13 | 61 | 5160 | 28.03 | 683 | 687 | 159.6 |
| C | 14 | 234 | 5009 | 27.08 | 683 | 687 | 159.6 |
| C | 11 | 7 | 3818 | 19.62 | 683 | 687 | 159.6 |
| D | 2 | 33 | 630090 | 3890.71 | 664 | 644 | 161.8 |
| D | 8 | 195 | 520579 | 3213.8 | 664 | 644 | 161.8 |
| D | 1 | 20 | 160605 | 988.74 | 664 | 644 | 161.8 |
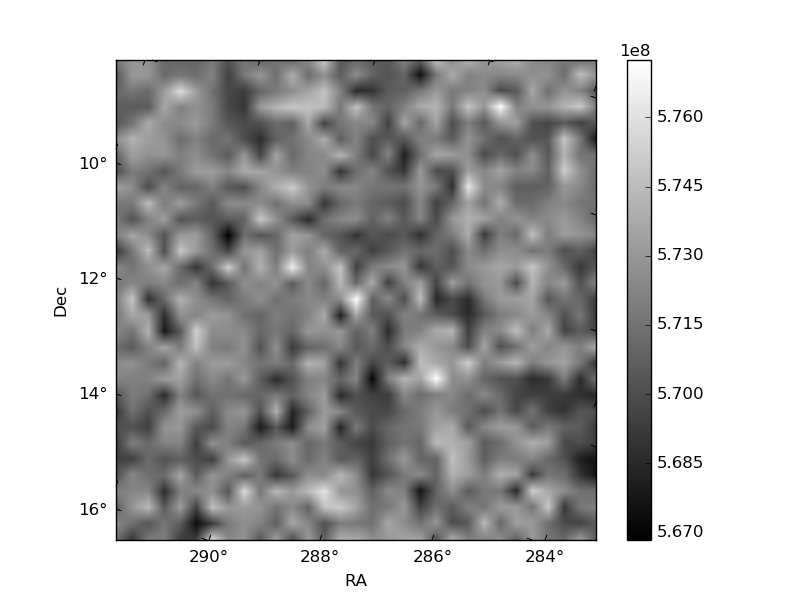
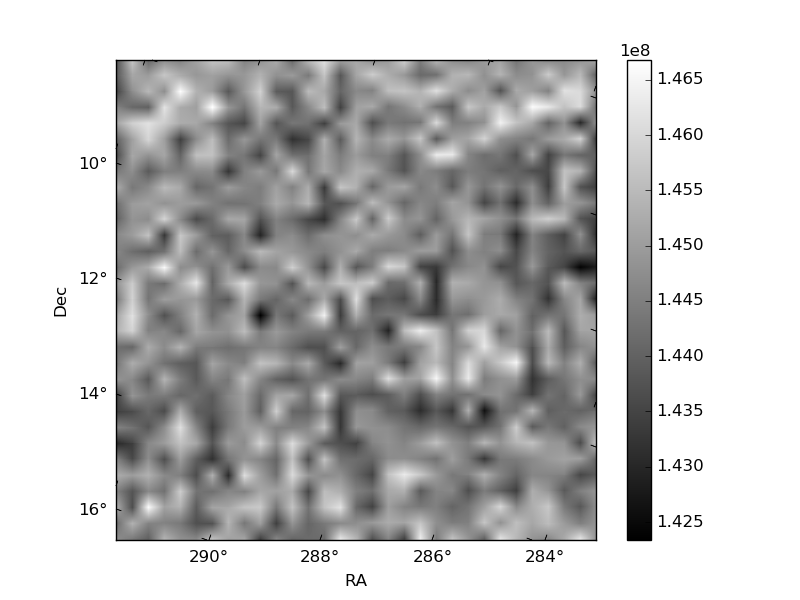
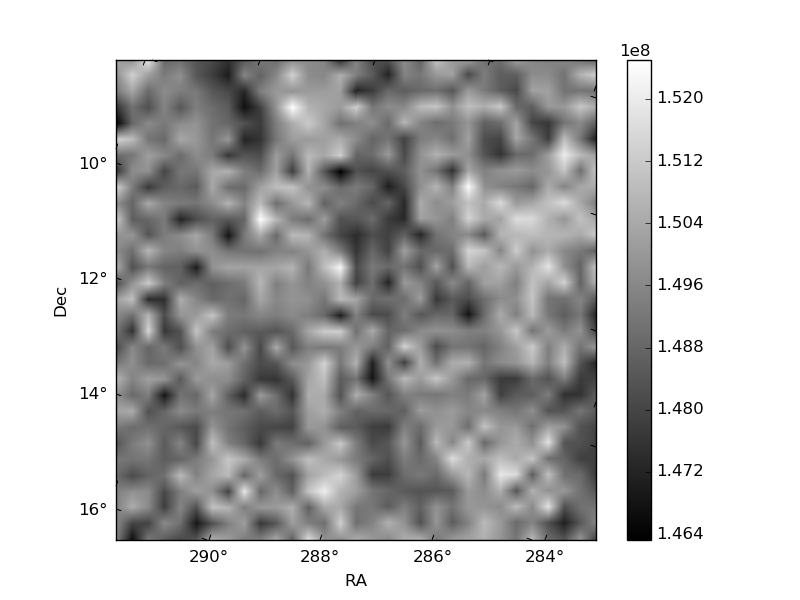
Histogram calculated using DETX and DETY for each event in the final _common_clean file
| Quadrant A | 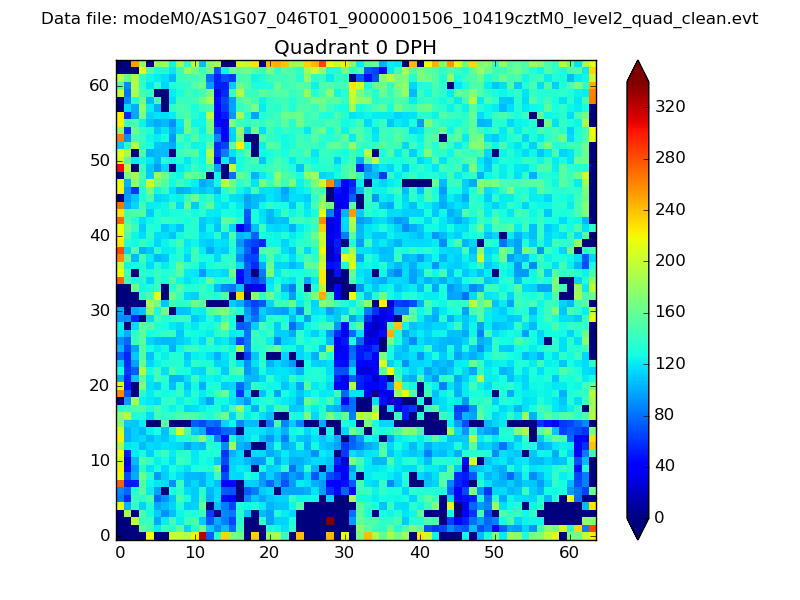 |
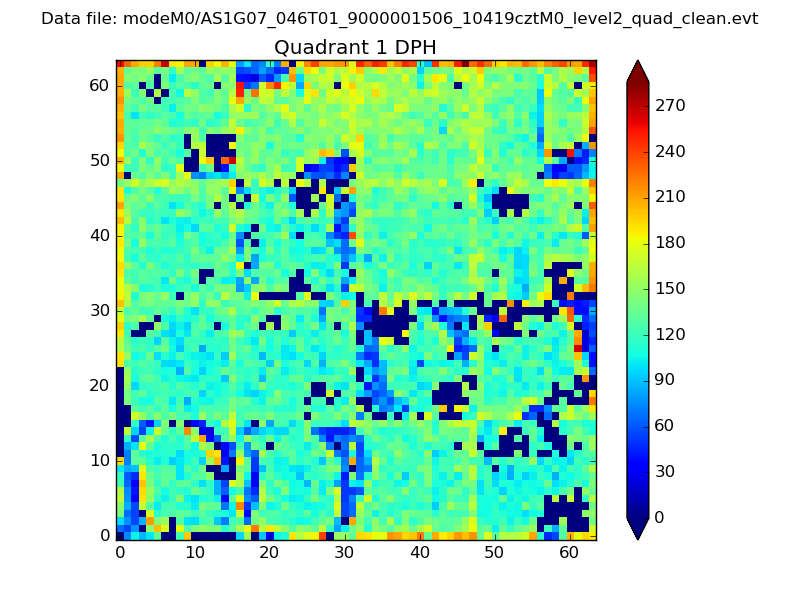 |
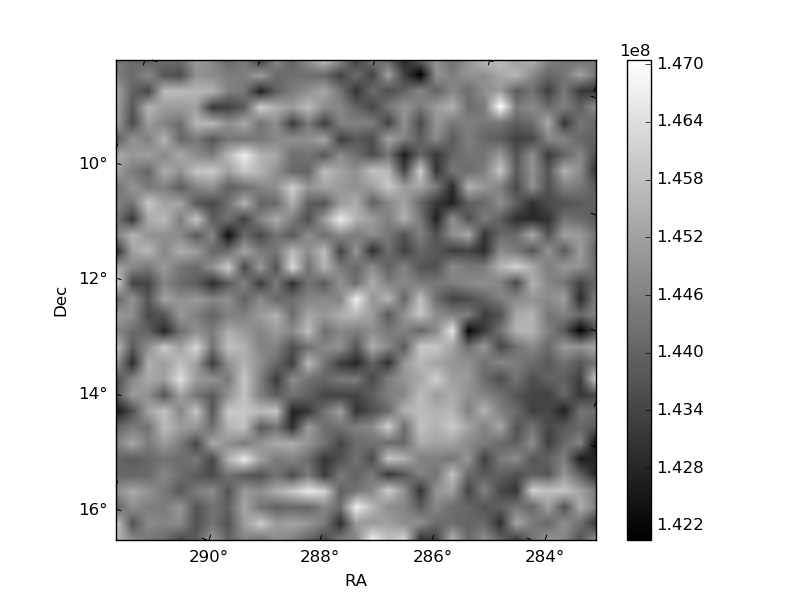
Quadrant B |
|---|---|---|---|
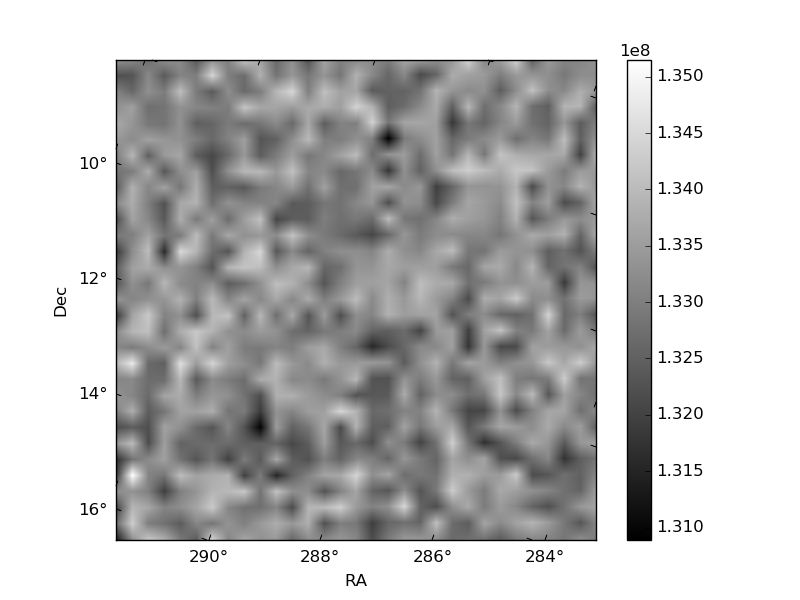
| Quadrant D | 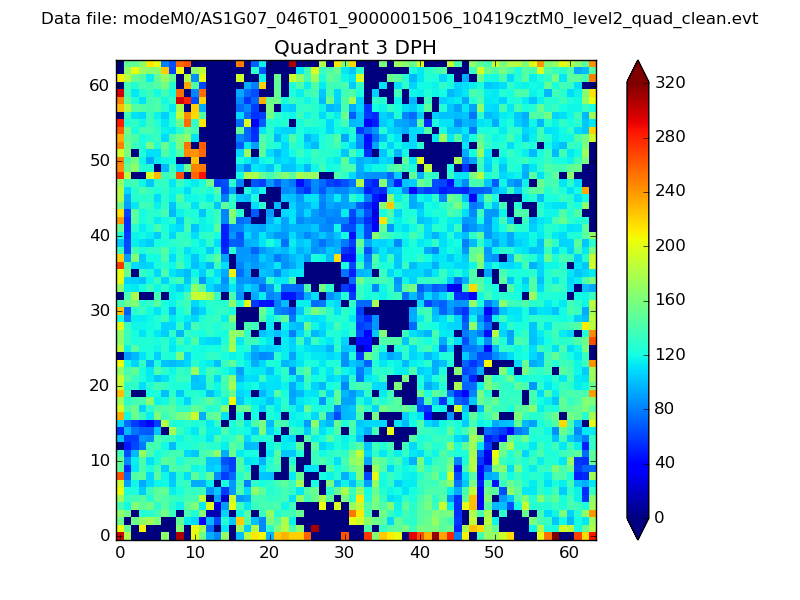 |
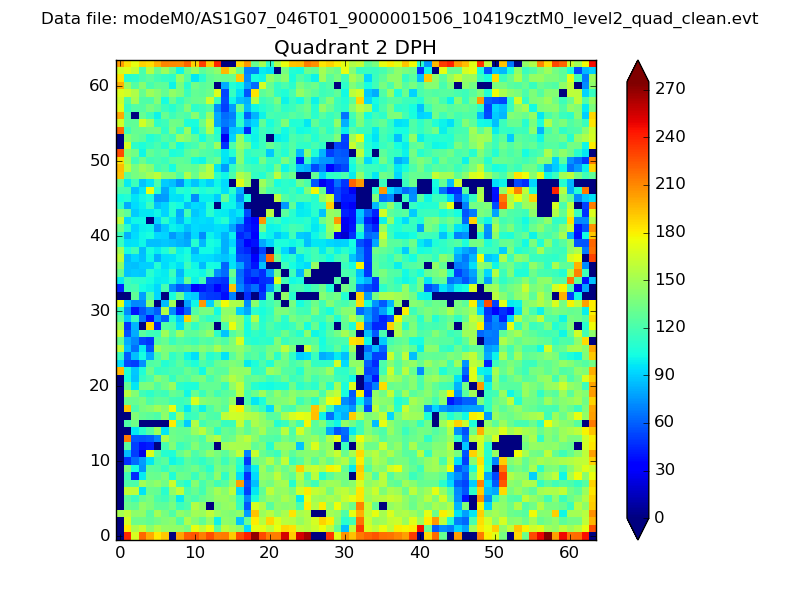 |
Quadrant C |
| Plot type | Count rate plots | Images |
|---|---|---|
| Comparison with Poisson distribution Blue bars denote a histogram of data divided into 1 sec bins. Red curve is a Poisson curve with rate = median count rate of data. |
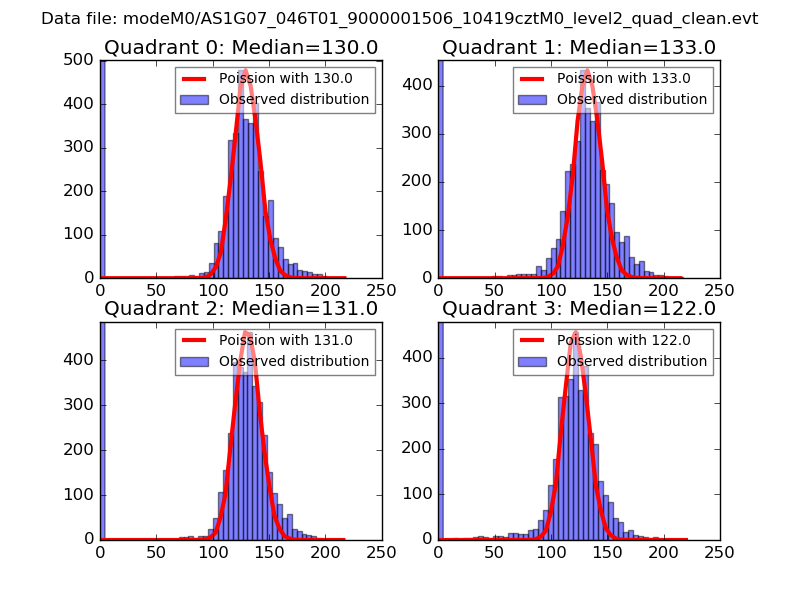 |
 |
| Quadrant-wise count rates Data is divided into 100 sec bins |
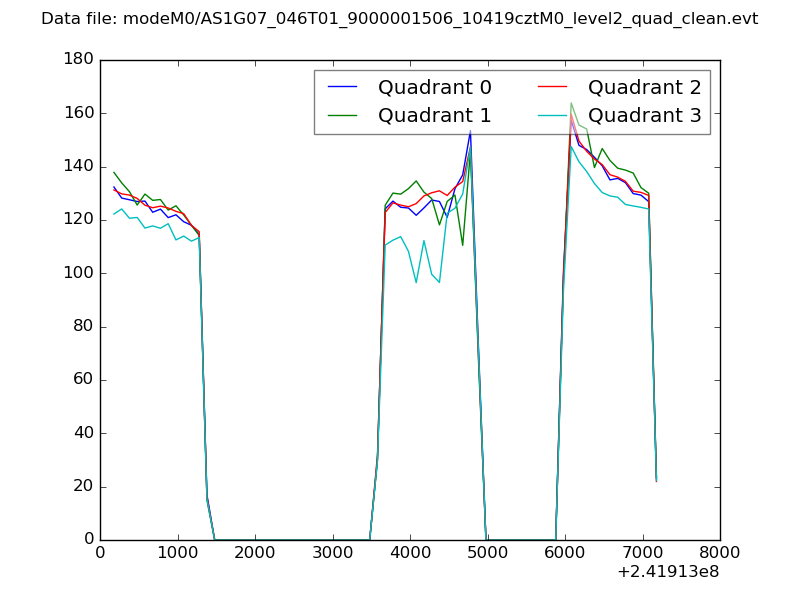 |
|
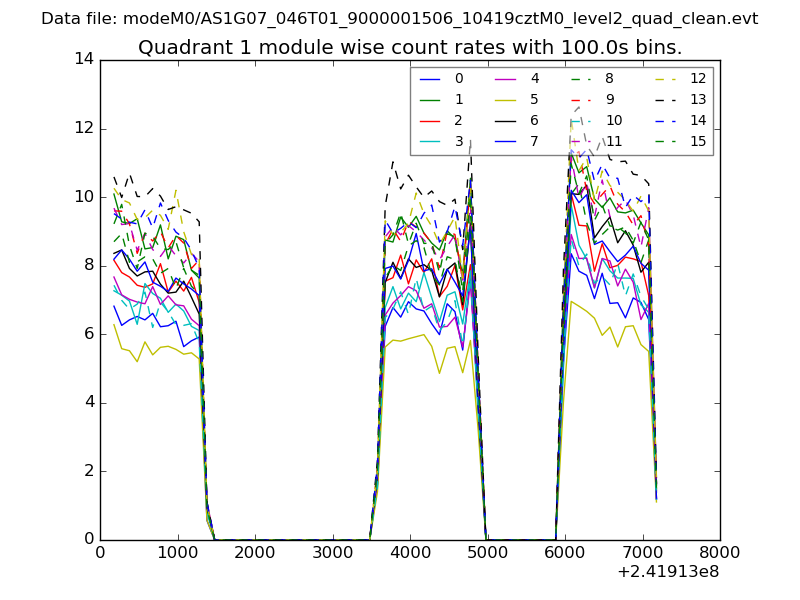
| Module-wise count rates for Quadrant A Data is divided into 100 sec bins |
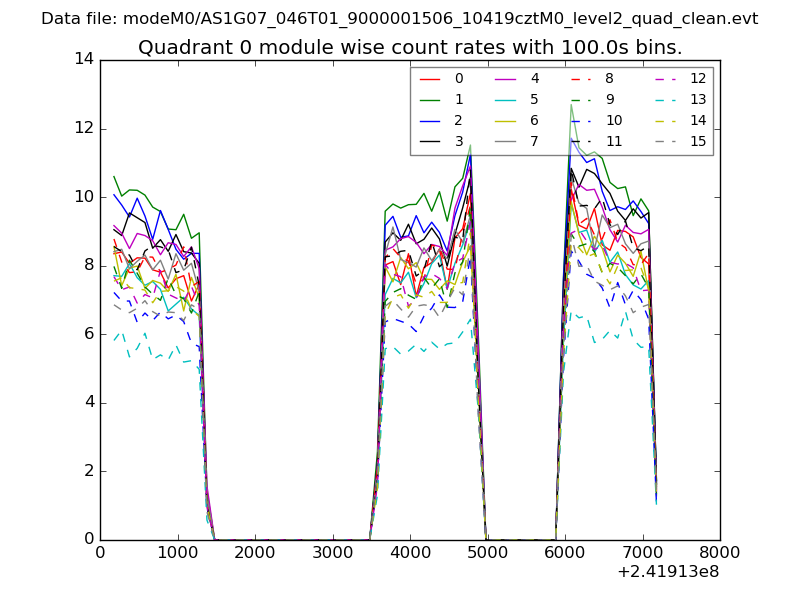 |
 |
| Module-wise count rates for Quadrant B Data is divided into 100 sec bins |
 |
 |
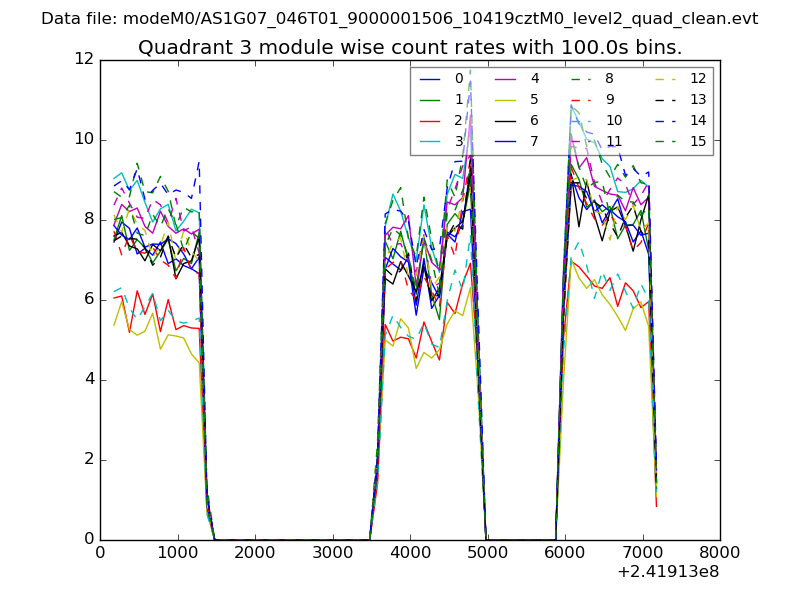
| Module-wise count rates for Quadrant C Data is divided into 100 sec bins |
 |
 |
| Module-wise count rates for Quadrant D Data is divided into 100 sec bins |
 |
 |
| Parameter | Plot |
|---|---|
| CZT HV Monitor | 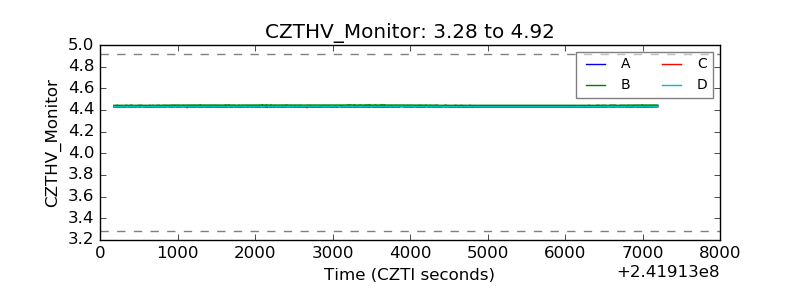 |
| D_VDD | 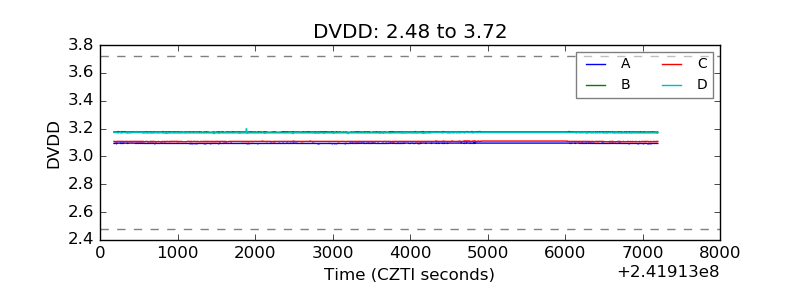 |
| Temperature 1 | 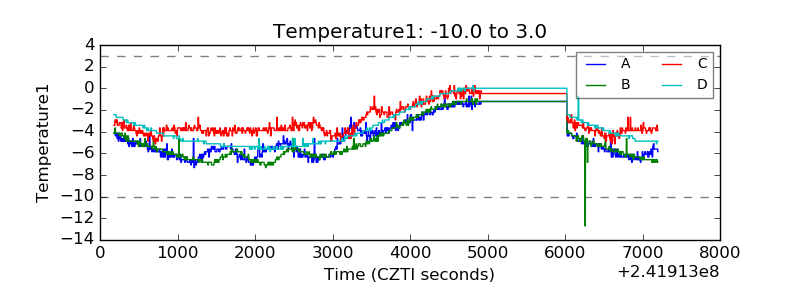 |
| Veto HV Monitor | 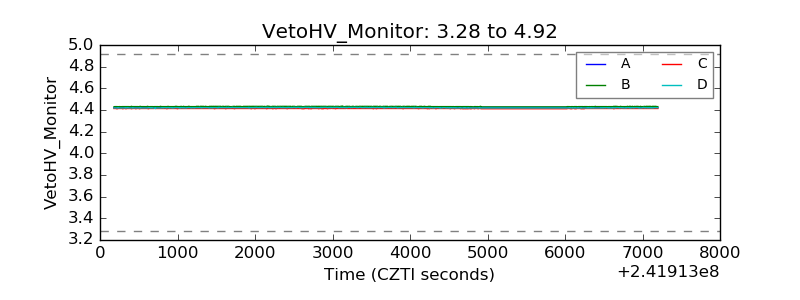 |
| Veto LLD |  |
| Alpha Counter | 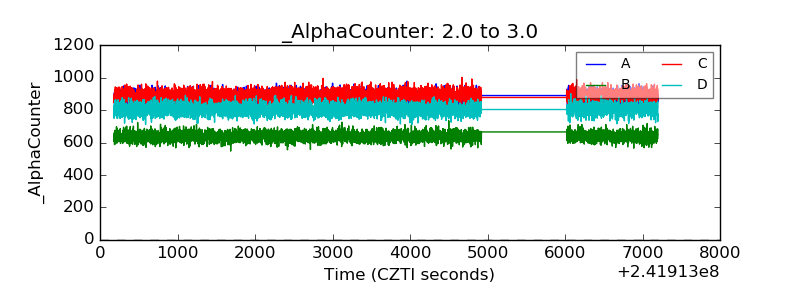 |
| _CPM_Rate | 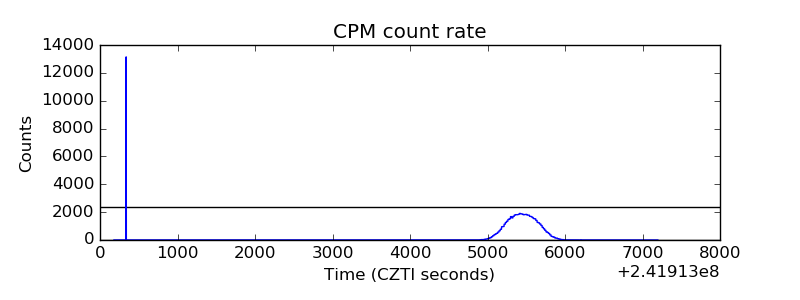 |
| CZT Counter | 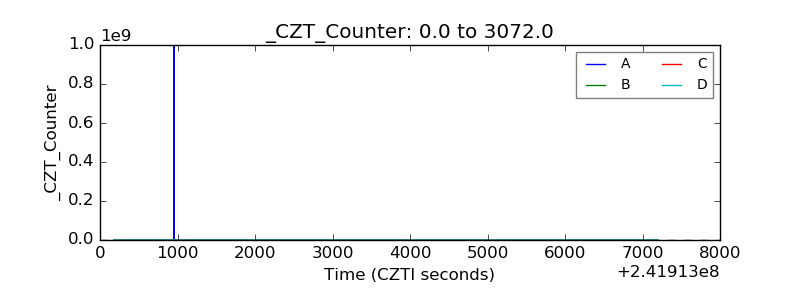 |
| +2.5 Volts monitor |  |
| +5 Volts monitor |  |
| _ROLL_ROT | 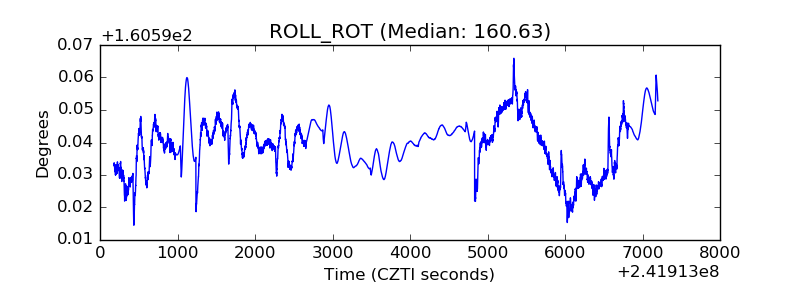 |
| _Roll_DEC | 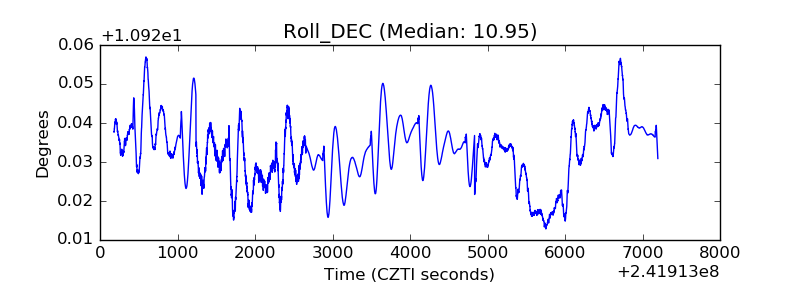 |
| _Roll_RA | 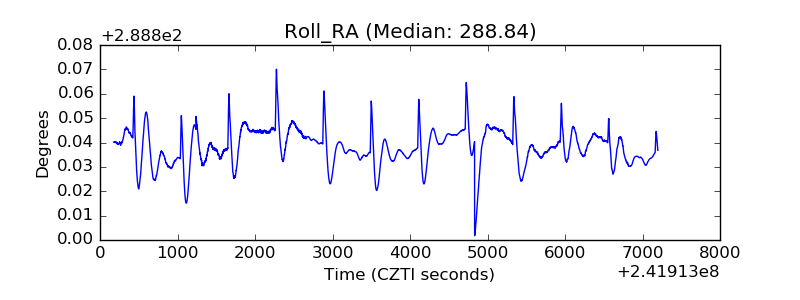 |
| Veto Counter | 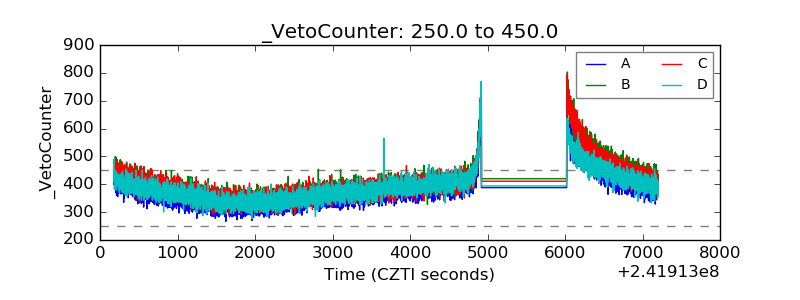 |