| Param | Original file | Final file |
|---|---|---|
| Filename | modeM0/AS1G07_046T01_9000001506_10420cztM0_level2.evt | modeM0/AS1G07_046T01_9000001506_10420cztM0_level2_quad_clean.evt |
| Size (bytes) | 2,096,688,960 | 322,130,880 |
| Size | 2.0 GB | 307.2 MB |
| Events in quadrant A | 13,422,607 | 2,001,952 |
| Events in quadrant B | 17,080,354 | 2,005,822 |
| Events in quadrant C | 12,406,812 | 2,003,155 |
| Events in quadrant D | 18,748,683 | 1,869,105 |
| Mode SS | |||
|---|---|---|---|
| Quadrant | BADHDUFLAG | Total packets | Discarded packets |
| A | 0 | 556 | 0 |
| B | 0 | 556 | 0 |
| C | 0 | 556 | 0 |
| D | 0 | 556 | 0 |
| Mode M0 | |||
|---|---|---|---|
| Quadrant | BADHDUFLAG | Total packets | Discarded packets |
| A | 0 | 58586 | 36 |
| B | 0 | 69017 | 52 |
| C | 0 | 56124 | 31 |
| D | 0 | 73896 | 86 |
| Mode M9 | |||
|---|---|---|---|
| Quadrant | BADHDUFLAG | Total packets | Discarded packets |
| A | 0 | 39 | 0 |
| B | 0 | 39 | 0 |
| C | 0 | 39 | 0 |
| D | 0 | 39 | 0 |
| Quadrant | Total seconds | Saturated seconds | Saturation percentage |
|---|---|---|---|
| A | 27283 | 296 | 1.084925% |
| B | 27278 | 1228 | 4.501796% |
| C | 27281 | 208 | 0.762435% |
| D | 27276 | 856 | 3.138290% |
Noise dominated data is calculated using 1-second bins in cleaned event files. If a bin has >2000 counts, and if more than 50% of those come from <1% of pixels, then it is considered to be noise-dominated and hence unusable.
| Quadrant | # 1 sec bins | Bins with >0 counts | Bins with >2000 counts | High rate bins dominated by noise | Noise dominated (total time) | Noise dominated (detector-on time) | Marked lightcurve |
|---|---|---|---|---|---|---|---|
| A | 31174 | 27295 | 35 | 35 | 0.11% | 0.13% | 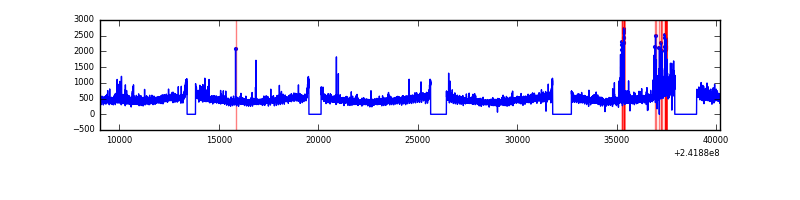 |
| B | 31174 | 27294 | 765 | 765 | 2.45% | 2.80% | 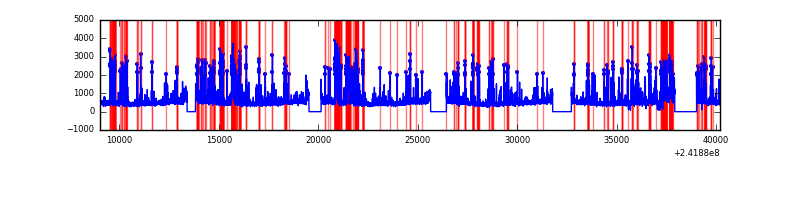 |
| C | 31174 | 27295 | 33 | 33 | 0.11% | 0.12% | 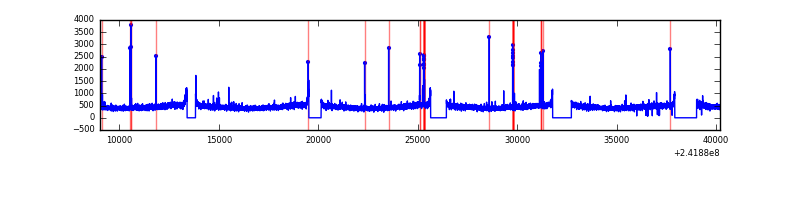 |
| D | 31174 | 27290 | 573 | 573 | 1.84% | 2.10% | 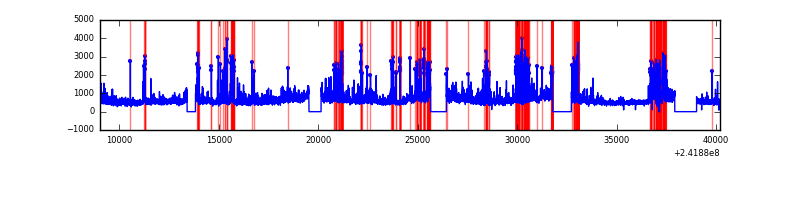 |
Top three noisy pixels from each quadrant. If the there are fewer than three noisy pixels in the level2.evt file, extra rows are filled as -1
| Pixel properties | Quadrant properties | ||||||
|---|---|---|---|---|---|---|---|
| Quadrant | DetID | PixID | Counts | Sigma | Mean | Median | Sigma |
| A | 13 | 251 | 902745 | 1380.22 | 3209 | 3136 | 651.8 |
| A | 1 | 162 | 62613 | 91.25 | 3209 | 3136 | 651.8 |
| A | 13 | 253 | 31341 | 43.27 | 3209 | 3136 | 651.8 |
| B | 4 | 239 | 3306875 | 5449.23 | 3199 | 3124 | 606.3 |
| B | 10 | 245 | 991359 | 1630.0 | 3199 | 3124 | 606.3 |
| B | 11 | 51 | 107257 | 171.76 | 3199 | 3124 | 606.3 |
| C | 14 | 234 | 144470 | 193.42 | 3136 | 3150 | 730.6 |
| C | 9 | 68 | 26202 | 31.55 | 3136 | 3150 | 730.6 |
| C | 13 | 61 | 23777 | 28.23 | 3136 | 3150 | 730.6 |
| D | 8 | 195 | 2443902 | 3305.11 | 3066 | 2984 | 738.5 |
| D | 1 | 20 | 1518880 | 2052.59 | 3066 | 2984 | 738.5 |
| D | 1 | 52 | 1429811 | 1931.98 | 3066 | 2984 | 738.5 |
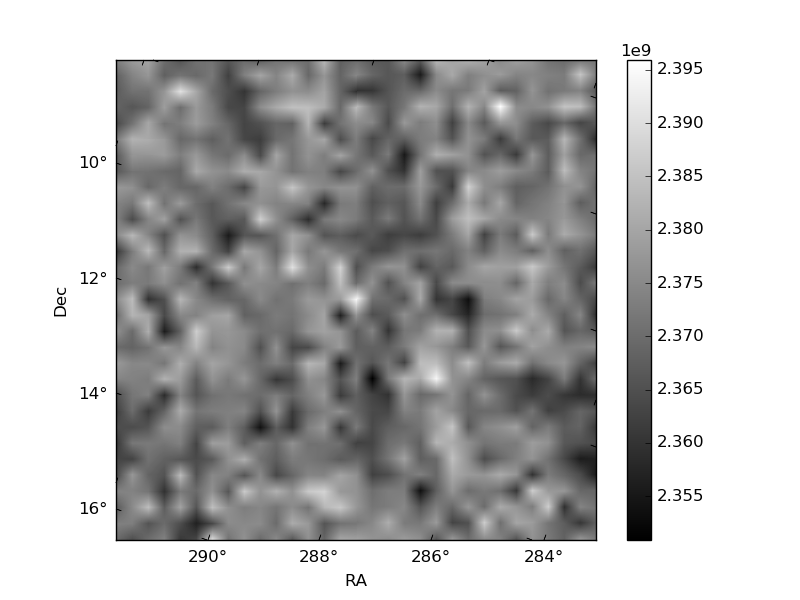
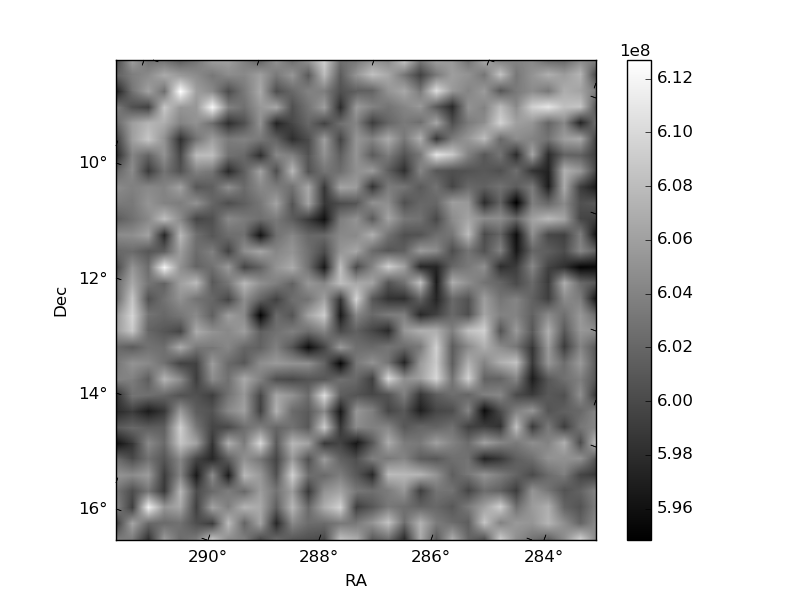
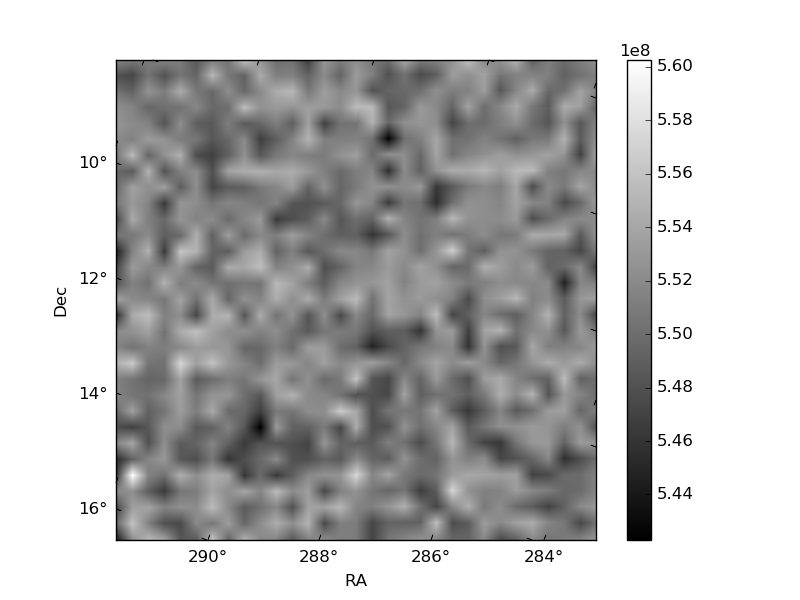
Histogram calculated using DETX and DETY for each event in the final _common_clean file
| Quadrant A | 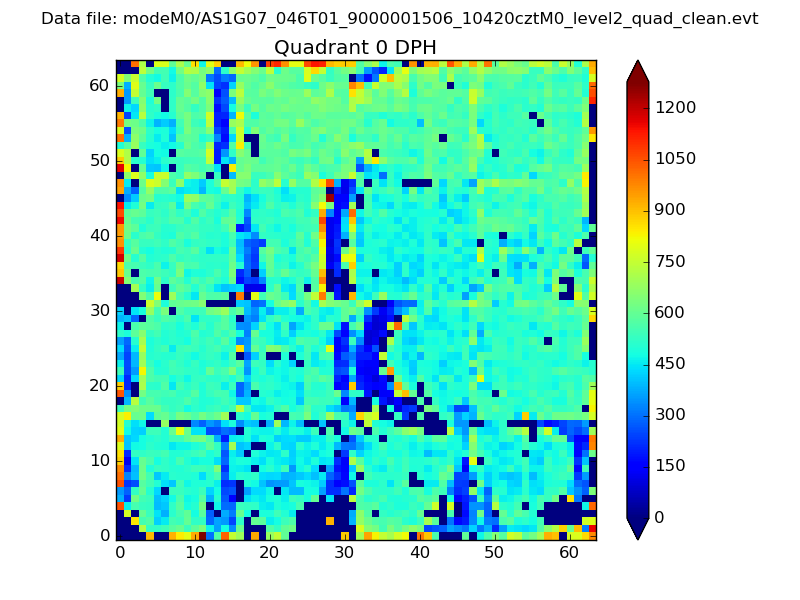 |
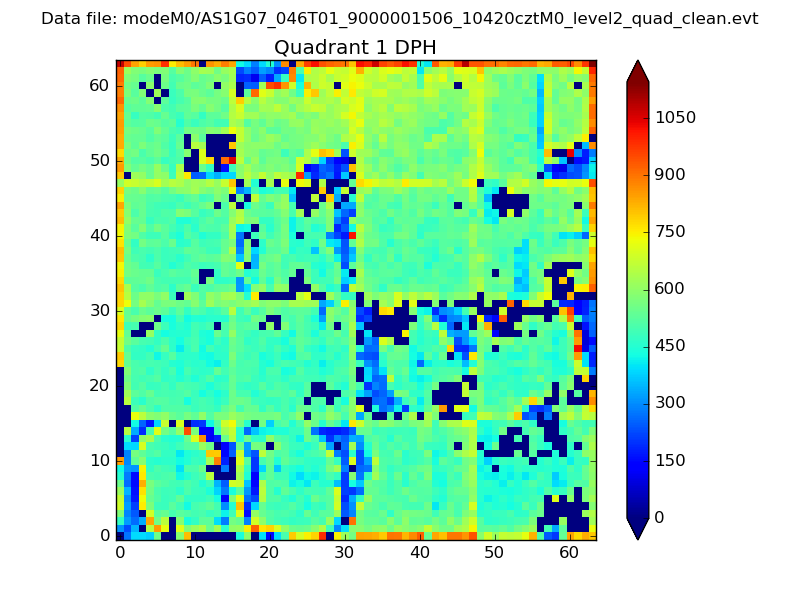 |
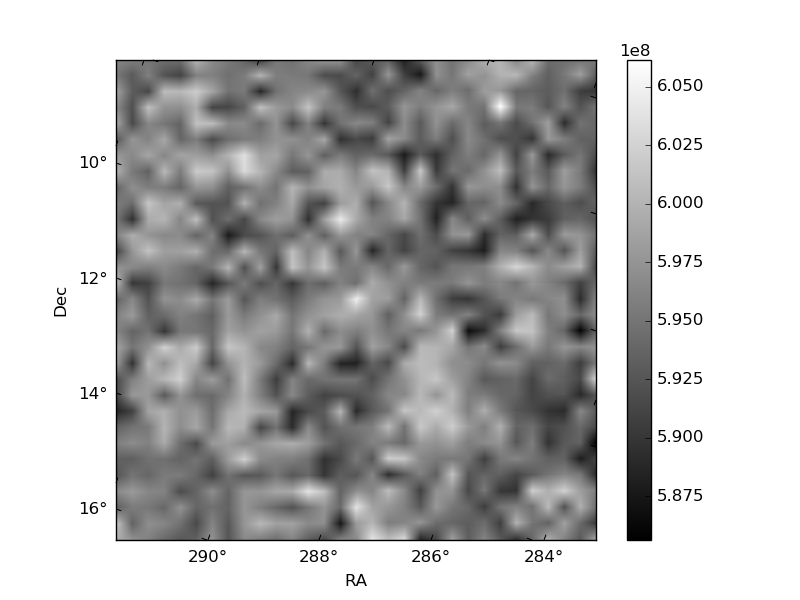
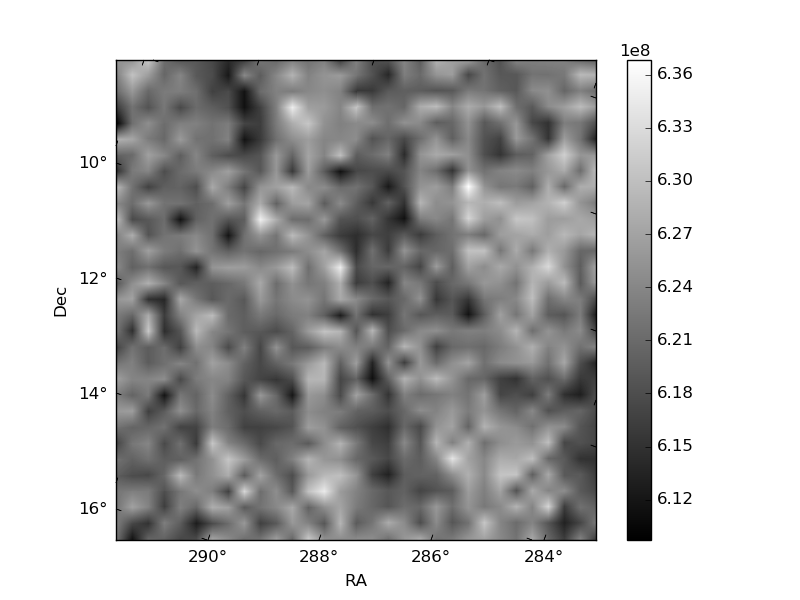
Quadrant B |
|---|---|---|---|
| Quadrant D | 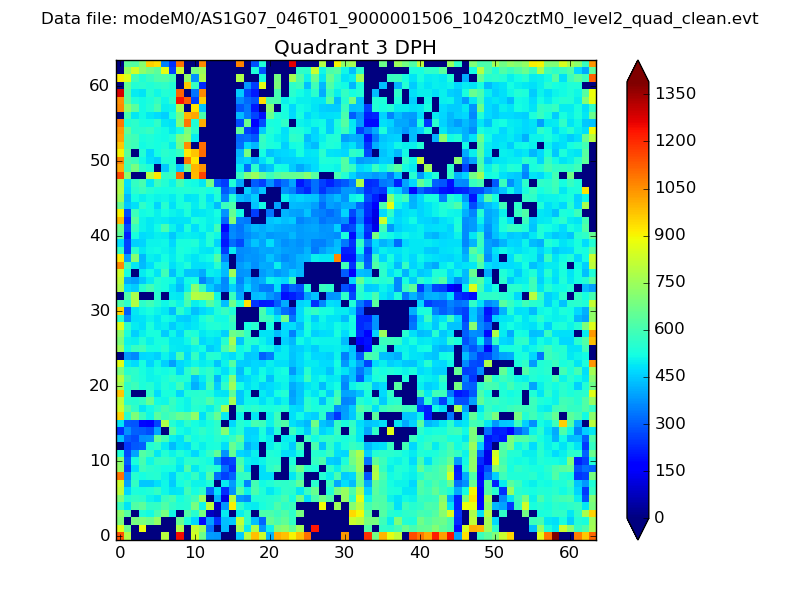 |
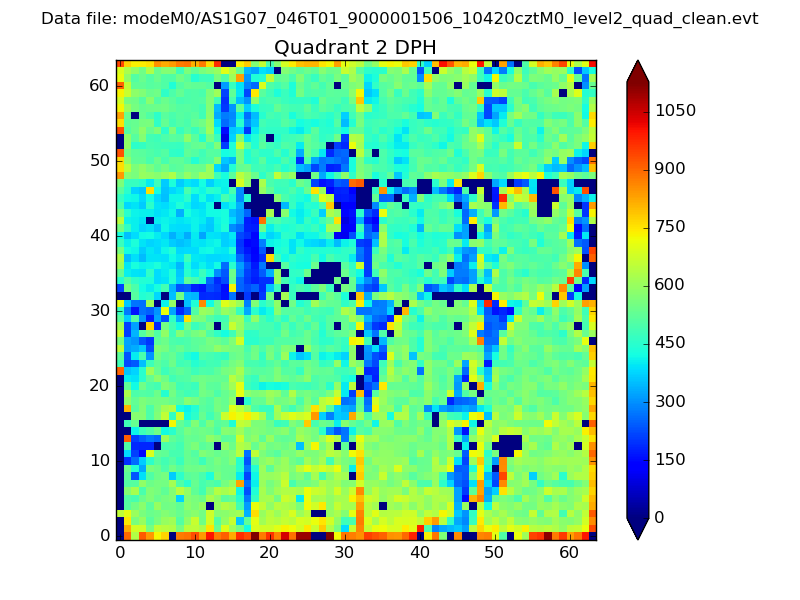 |
Quadrant C |
| Plot type | Count rate plots | Images |
|---|---|---|
| Comparison with Poisson distribution Blue bars denote a histogram of data divided into 1 sec bins. Red curve is a Poisson curve with rate = median count rate of data. |
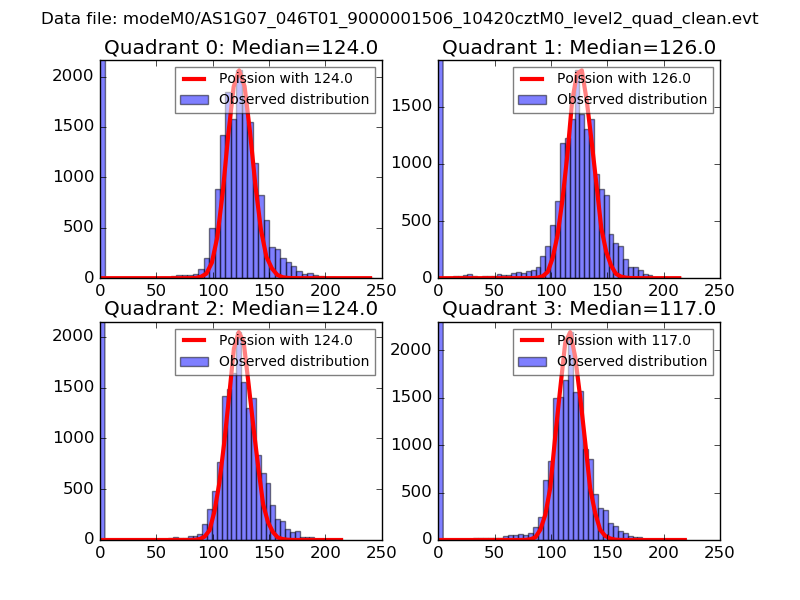 |
 |
| Quadrant-wise count rates Data is divided into 100 sec bins |
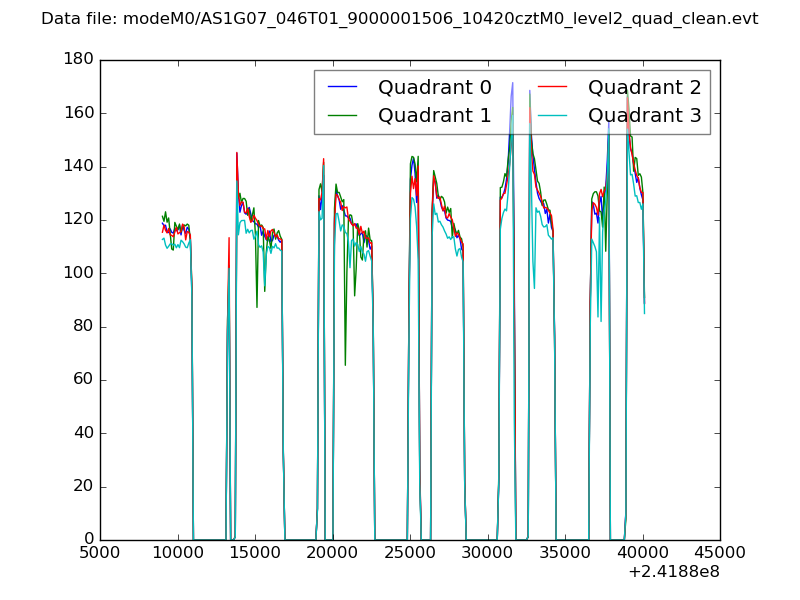 |
|
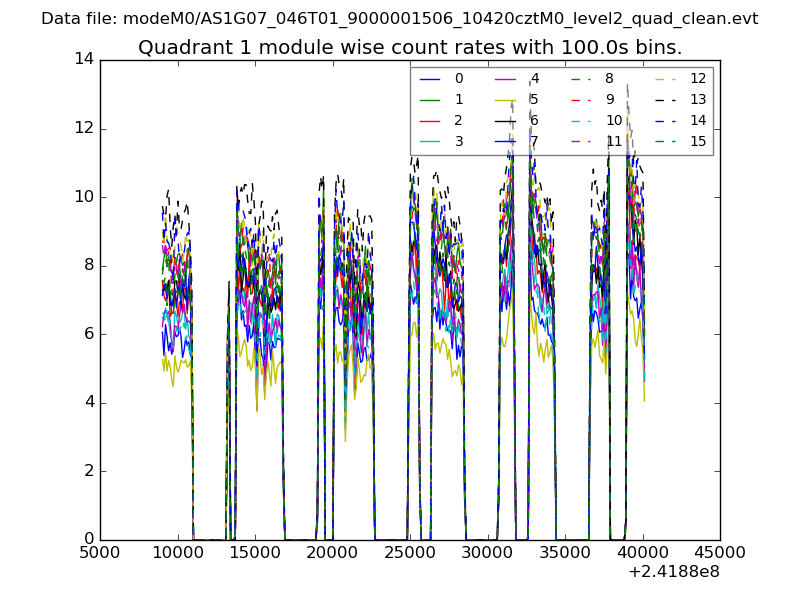
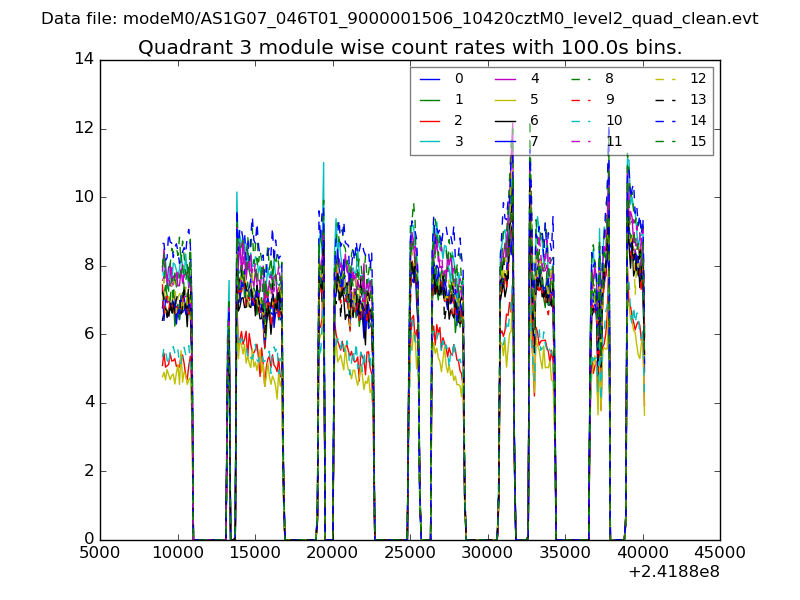
| Module-wise count rates for Quadrant A Data is divided into 100 sec bins |
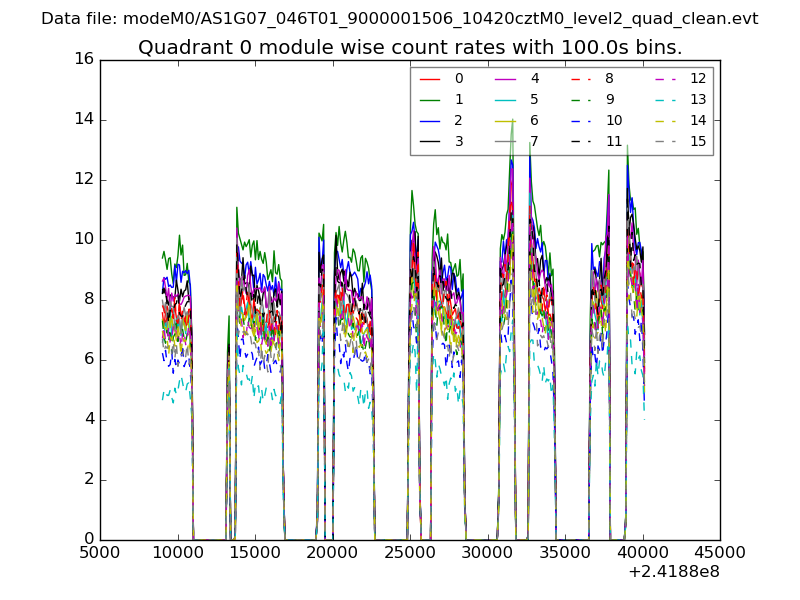 |
 |
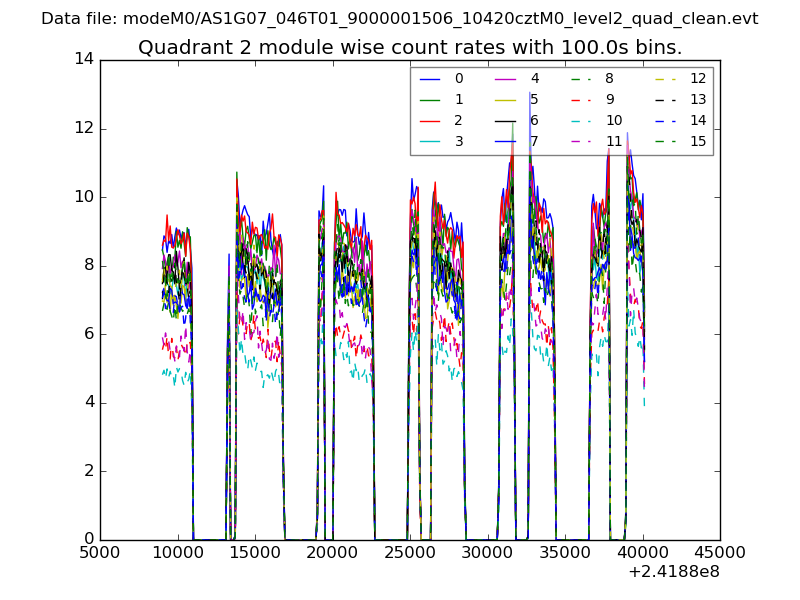
| Module-wise count rates for Quadrant B Data is divided into 100 sec bins |
 |
 |
| Module-wise count rates for Quadrant C Data is divided into 100 sec bins |
 |
 |
| Module-wise count rates for Quadrant D Data is divided into 100 sec bins |
 |
 |
| Parameter | Plot |
|---|---|
| CZT HV Monitor |  |
| D_VDD | 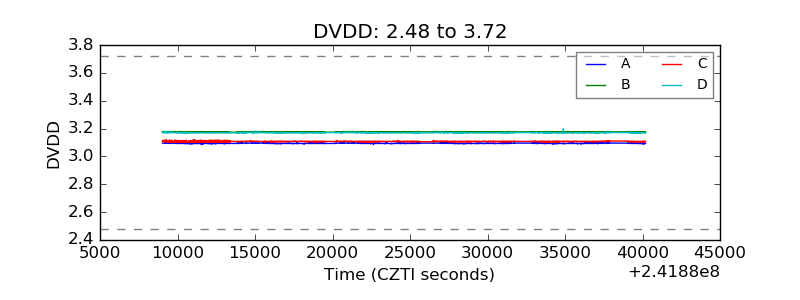 |
| Temperature 1 | 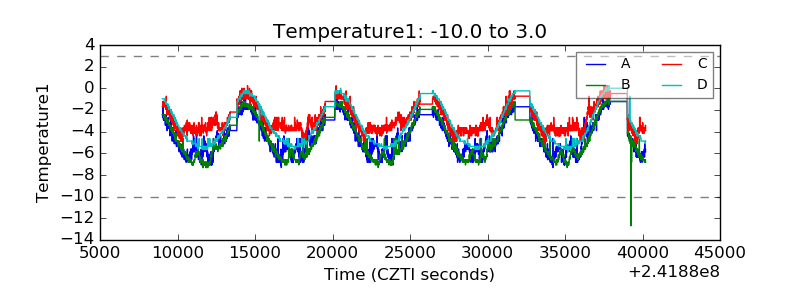 |
| Veto HV Monitor | 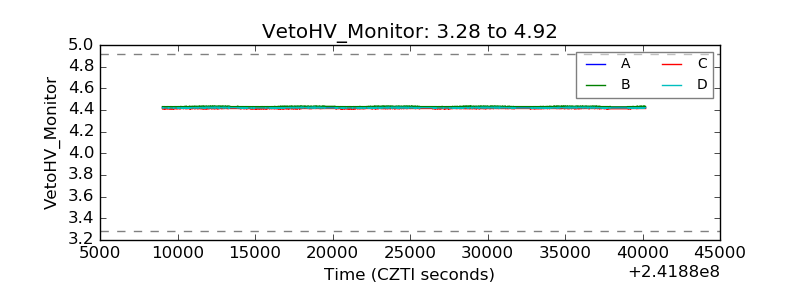 |
| Veto LLD | 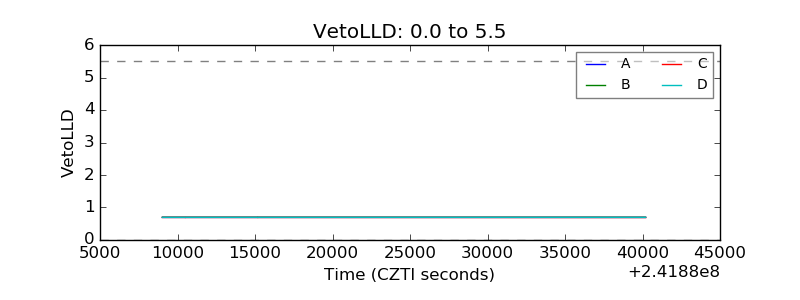 |
| Alpha Counter | 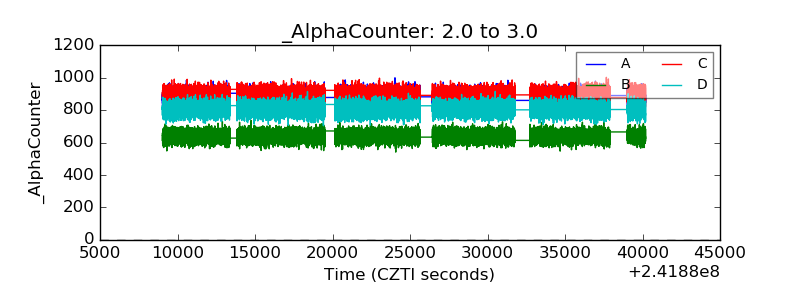 |
| _CPM_Rate | 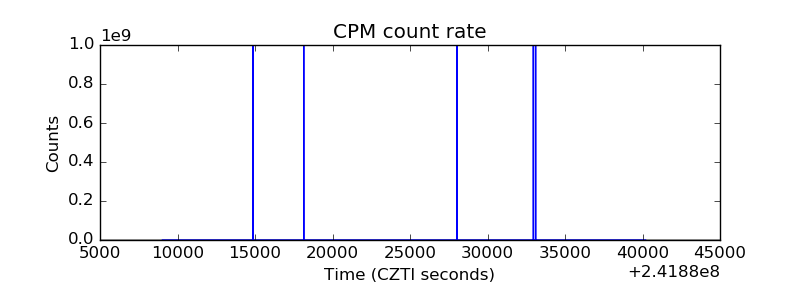 |
| CZT Counter | 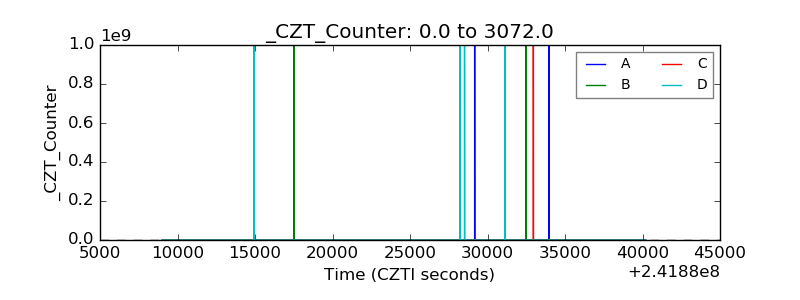 |
| +2.5 Volts monitor |  |
| +5 Volts monitor |  |
| _ROLL_ROT | 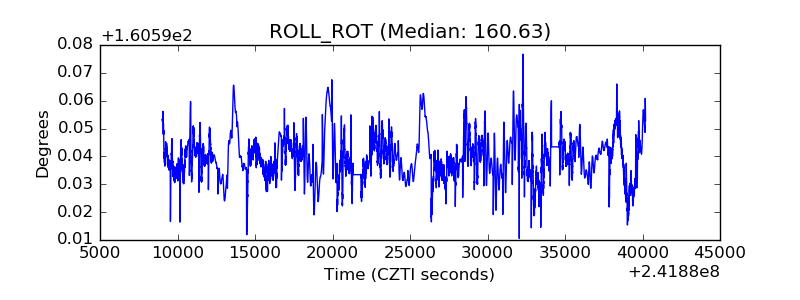 |
| _Roll_DEC | 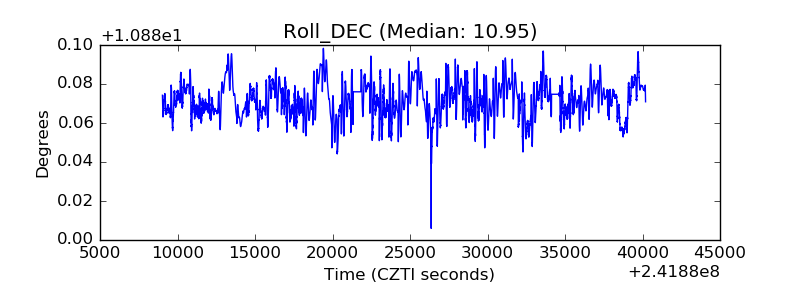 |
| _Roll_RA | 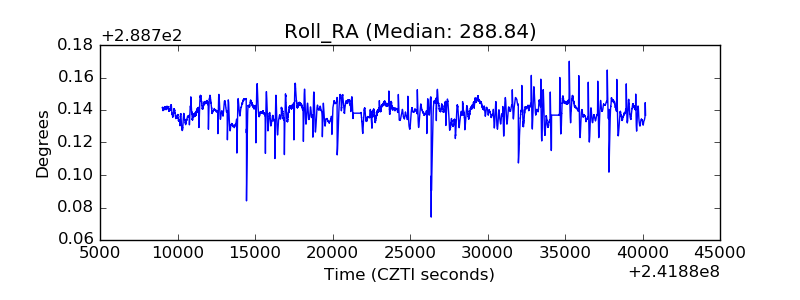 |
| Veto Counter | 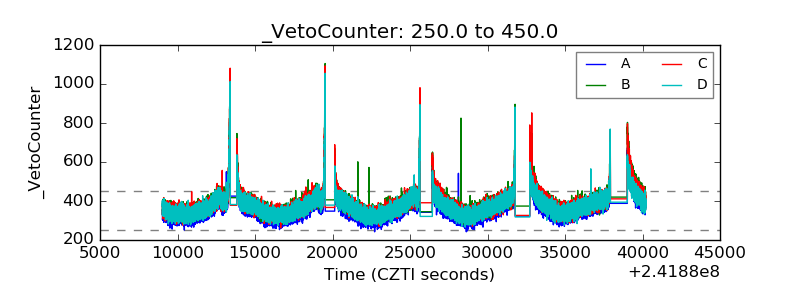 |