| Param | Original file | Final file |
|---|---|---|
| Filename | modeM0/AS1A03_126T01_9000001512_10435cztM0_level2.evt | modeM0/AS1A03_126T01_9000001512_10435cztM0_level2_quad_clean.evt |
| Size (bytes) | 1,114,439,040 | 192,859,200 |
| Size | 1.0 GB | 183.9 MB |
| Events in quadrant A | 8,924,755 | 1,138,081 |
| Events in quadrant B | 8,123,842 | 1,244,678 |
| Events in quadrant C | 6,631,864 | 1,262,941 |
| Events in quadrant D | 9,128,369 | 1,232,703 |
| Mode SS | |||
|---|---|---|---|
| Quadrant | BADHDUFLAG | Total packets | Discarded packets |
| A | 0 | 444 | 142 |
| B | 0 | 444 | 144 |
| C | 0 | 444 | 147 |
| D | 0 | 436 | 133 |
| Mode M0 | |||
|---|---|---|---|
| Quadrant | BADHDUFLAG | Total packets | Discarded packets |
| A | 0 | 65184 | 30108 |
| B | 0 | 53031 | 19701 |
| C | 0 | 44866 | 15869 |
| D | 0 | 53721 | 16766 |
| Mode M9 | |||
|---|---|---|---|
| Quadrant | BADHDUFLAG | Total packets | Discarded packets |
| A | 0 | 55 | 18 |
| B | 0 | 62 | 25 |
| C | 0 | 62 | 25 |
| D | 0 | 54 | 17 |
| Quadrant | Total seconds | Saturated seconds | Saturation percentage |
|---|---|---|---|
| A | 12875 | 252 | 1.957282% |
| B | 13850 | 288 | 2.079422% |
| C | 14178 | 42 | 0.296234% |
| D | 14733 | 106 | 0.719473% |
Noise dominated data is calculated using 1-second bins in cleaned event files. If a bin has >2000 counts, and if more than 50% of those come from <1% of pixels, then it is considered to be noise-dominated and hence unusable.
| Quadrant | # 1 sec bins | Bins with >0 counts | Bins with >2000 counts | High rate bins dominated by noise | Noise dominated (total time) | Noise dominated (detector-on time) | Marked lightcurve |
|---|---|---|---|---|---|---|---|
| A | 18905 | 13903 | 164 | 164 | 0.87% | 1.18% | 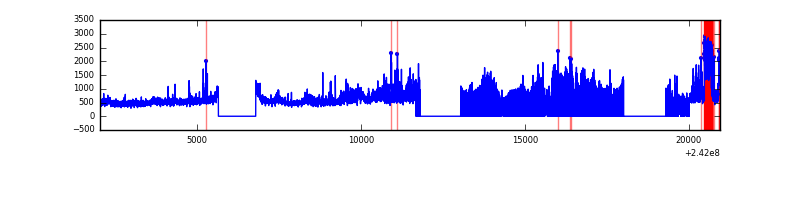 |
| B | 18905 | 14732 | 153 | 153 | 0.81% | 1.04% | 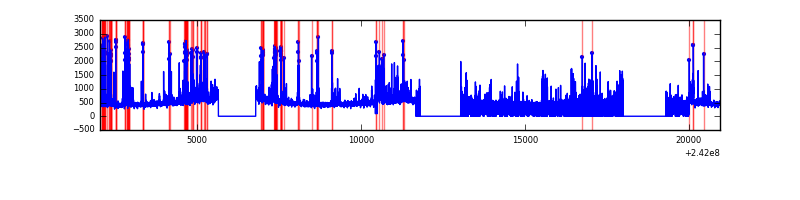 |
| C | 18905 | 14975 | 1 | 1 | 0.01% | 0.01% | 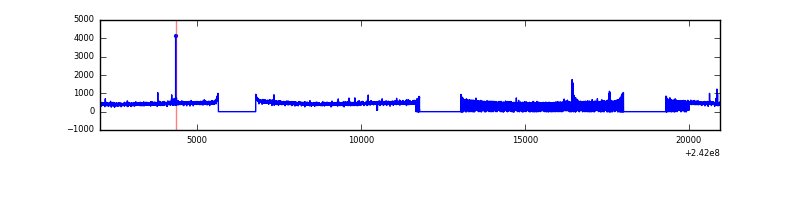 |
| D | 18905 | 15106 | 65 | 65 | 0.34% | 0.43% | 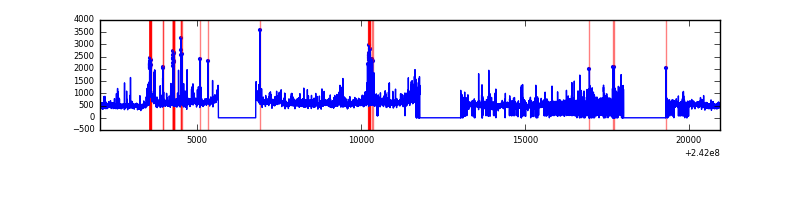 |
Top three noisy pixels from each quadrant. If the there are fewer than three noisy pixels in the level2.evt file, extra rows are filled as -1
| Pixel properties | Quadrant properties | ||||||
|---|---|---|---|---|---|---|---|
| Quadrant | DetID | PixID | Counts | Sigma | Mean | Median | Sigma |
| A | 13 | 251 | 2518395 | 8129.68 | 1541 | 1508 | 309.6 |
| A | 3 | 80 | 273710 | 879.23 | 1541 | 1508 | 309.6 |
| A | 8 | 5 | 143951 | 460.1 | 1541 | 1508 | 309.6 |
| B | 4 | 239 | 1396949 | 4457.62 | 1667 | 1627 | 313.0 |
| B | 11 | 51 | 89660 | 281.24 | 1667 | 1627 | 313.0 |
| B | 0 | 214 | 74636 | 233.24 | 1667 | 1627 | 313.0 |
| C | 14 | 234 | 30927 | 75.1 | 1692 | 1704 | 389.1 |
| C | 13 | 61 | 12464 | 27.65 | 1692 | 1704 | 389.1 |
| C | 14 | 67 | 5502 | 9.76 | 1692 | 1704 | 389.1 |
| D | 8 | 195 | 1061887 | 2552.23 | 1740 | 1696 | 415.4 |
| D | 1 | 20 | 705375 | 1693.99 | 1740 | 1696 | 415.4 |
| D | 13 | 104 | 281419 | 673.38 | 1740 | 1696 | 415.4 |
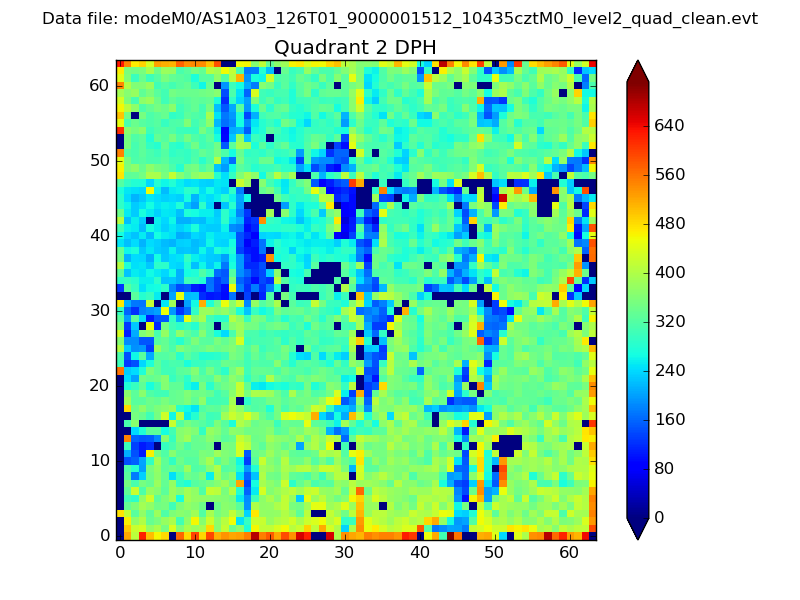
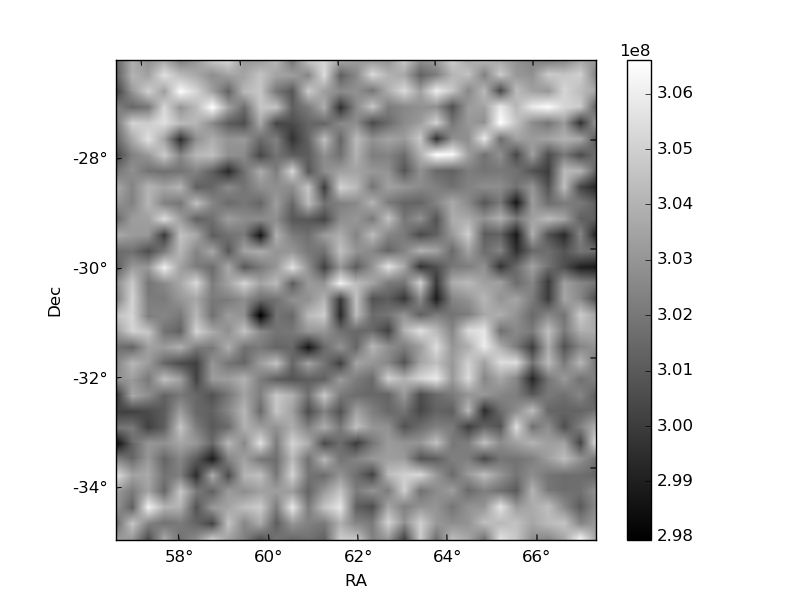
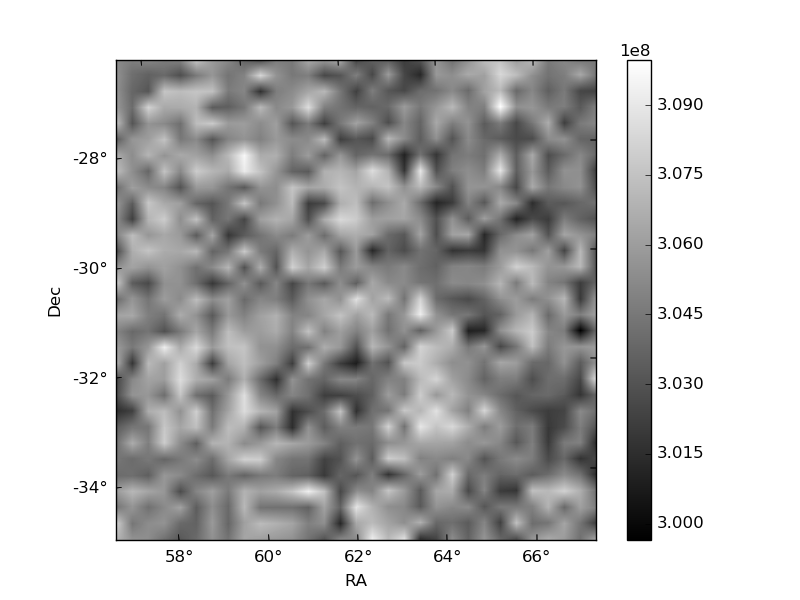
Histogram calculated using DETX and DETY for each event in the final _common_clean file
| Quadrant A |  |
 |
Quadrant B |
|---|---|---|---|
| Quadrant D |  |
 |
Quadrant C |
| Plot type | Count rate plots | Images |
|---|---|---|
| Comparison with Poisson distribution Blue bars denote a histogram of data divided into 1 sec bins. Red curve is a Poisson curve with rate = median count rate of data. |
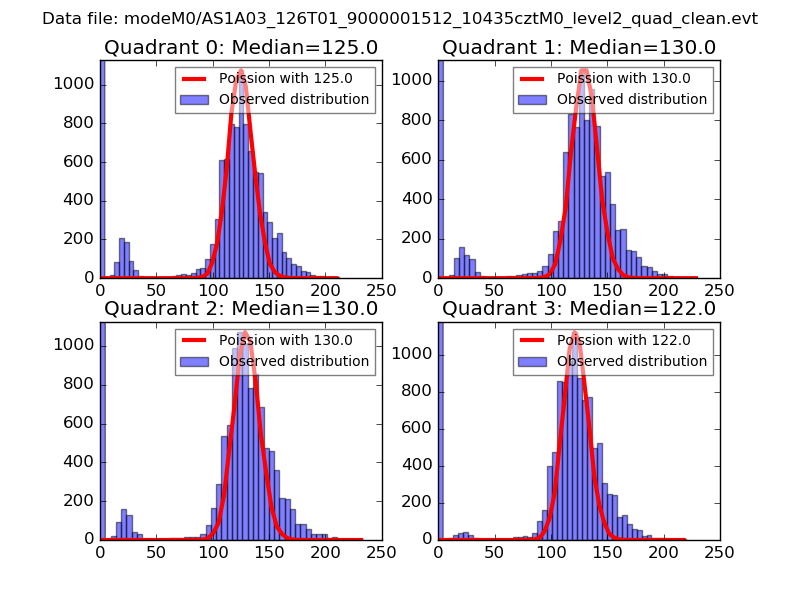 |
 |
| Quadrant-wise count rates Data is divided into 100 sec bins |
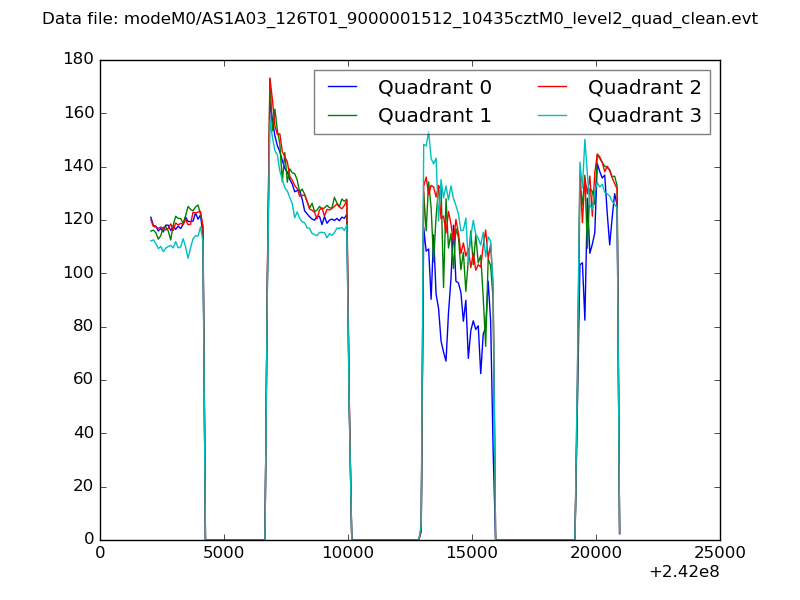 |
|
| Module-wise count rates for Quadrant A Data is divided into 100 sec bins |
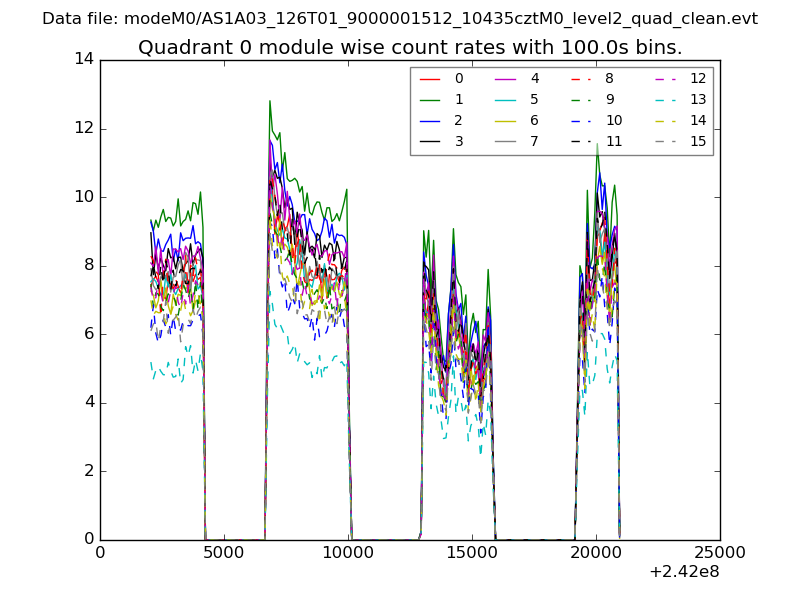 |
 |
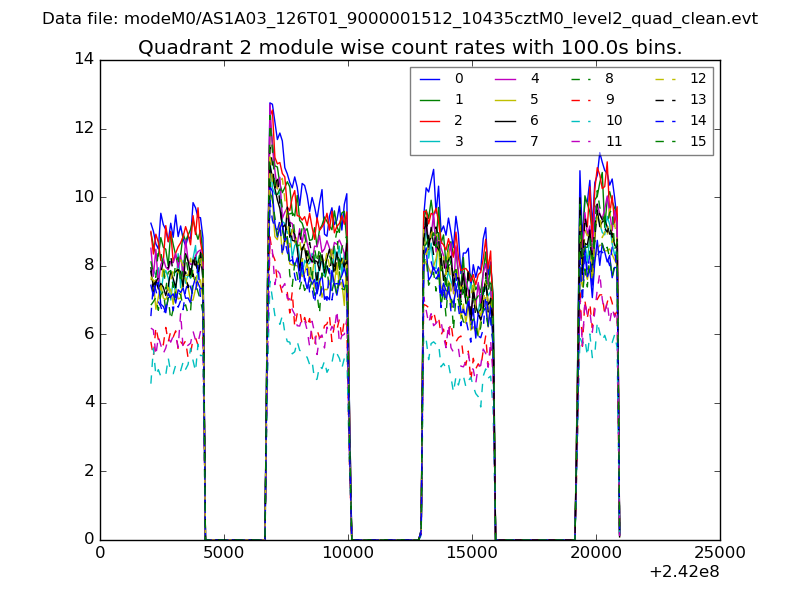
| Module-wise count rates for Quadrant B Data is divided into 100 sec bins |
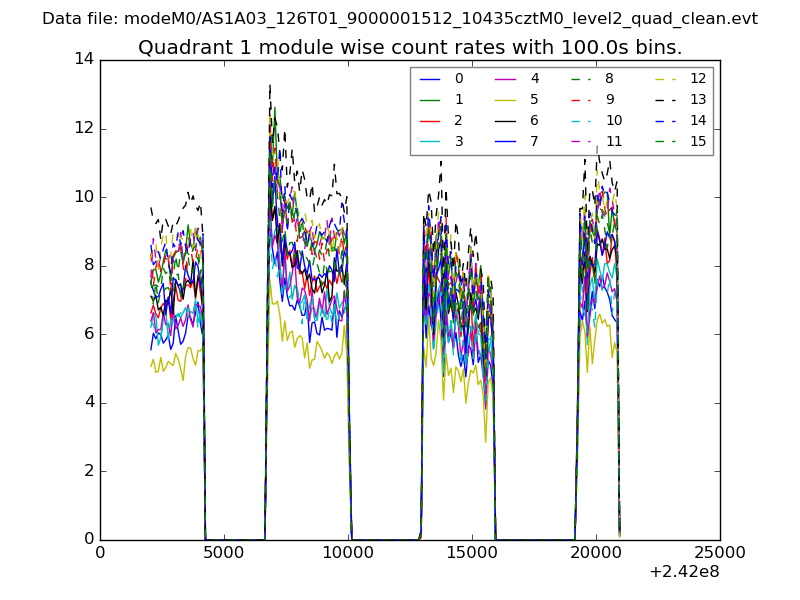 |
 |
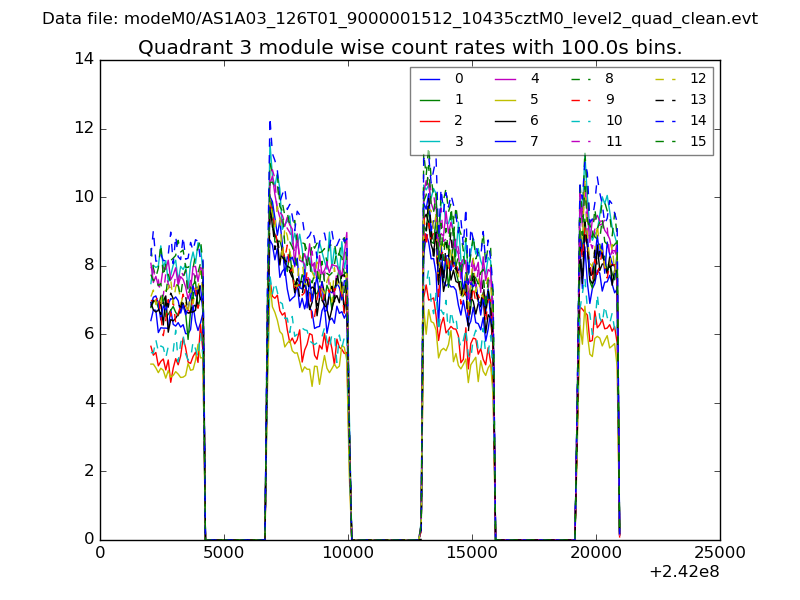
| Module-wise count rates for Quadrant C Data is divided into 100 sec bins |
 |
 |
| Module-wise count rates for Quadrant D Data is divided into 100 sec bins |
 |
 |
| Parameter | Plot |
|---|---|
| CZT HV Monitor | 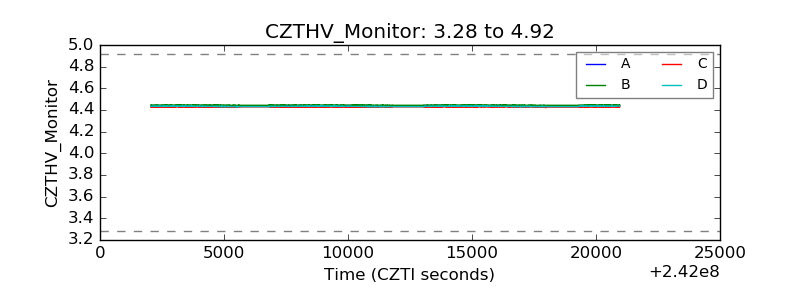 |
| D_VDD | 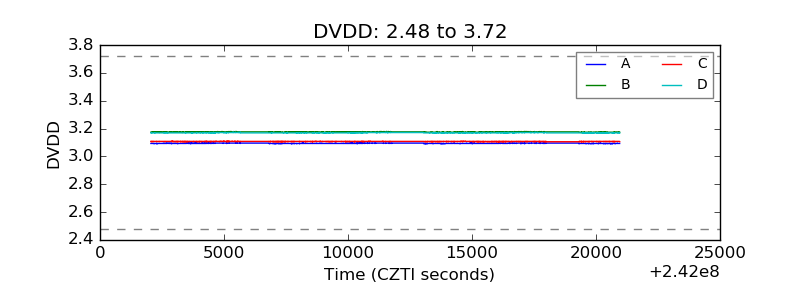 |
| Temperature 1 | 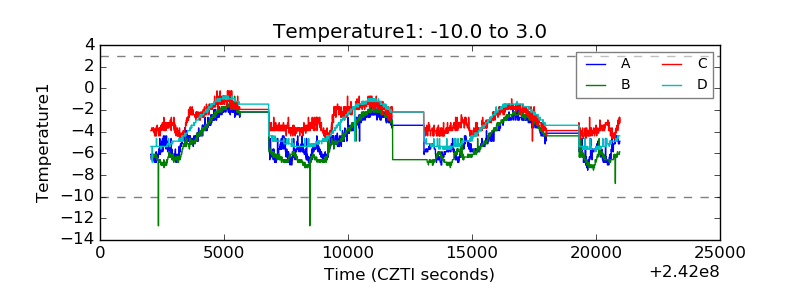 |
| Veto HV Monitor | 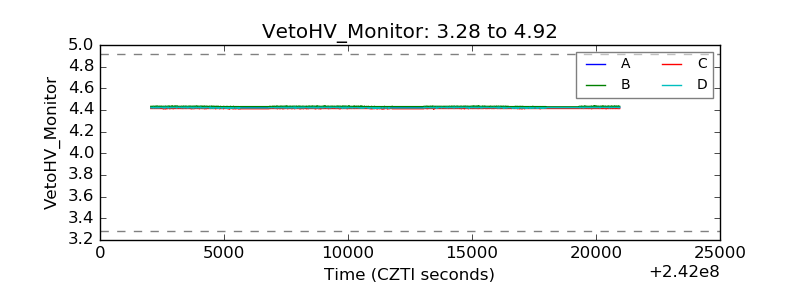 |
| Veto LLD | 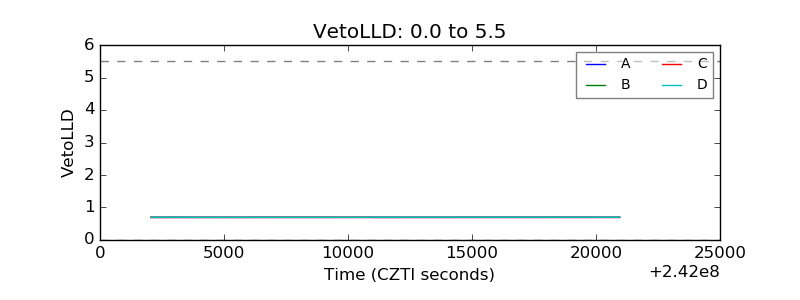 |
| Alpha Counter | 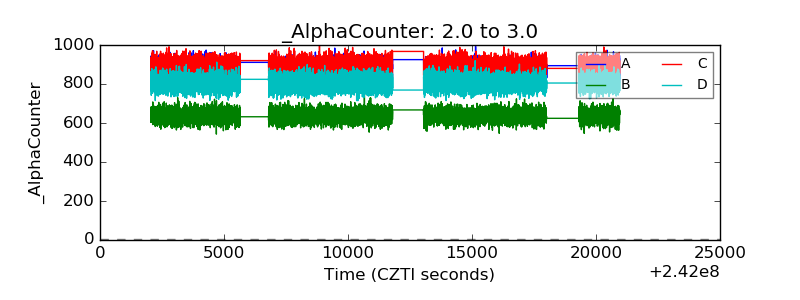 |
| _CPM_Rate | 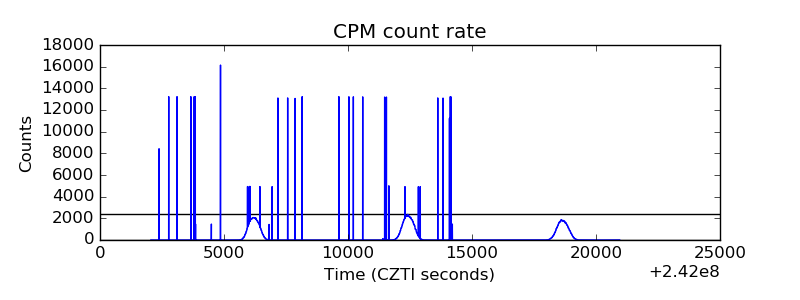 |
| CZT Counter | 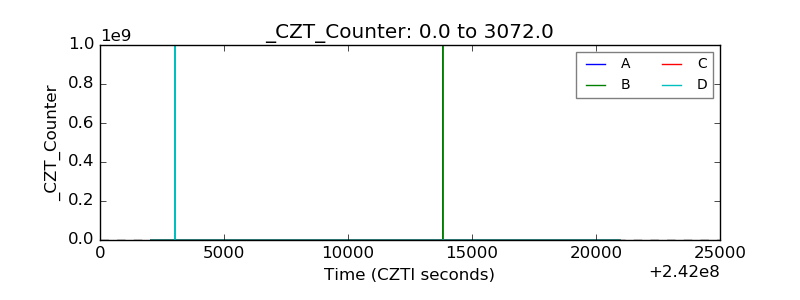 |
| +2.5 Volts monitor |  |
| +5 Volts monitor | 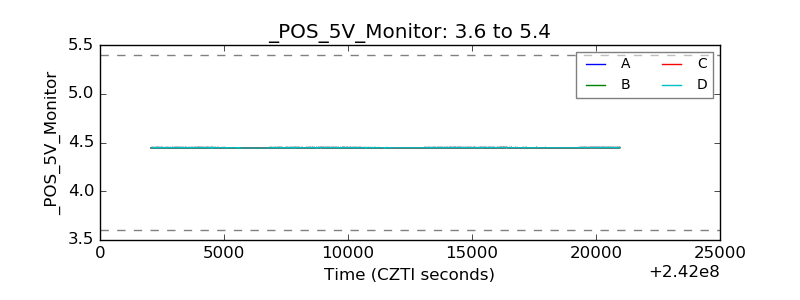 |
| _ROLL_ROT | 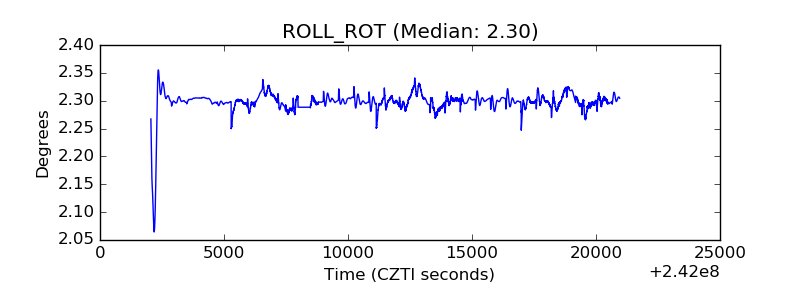 |
| _Roll_DEC | 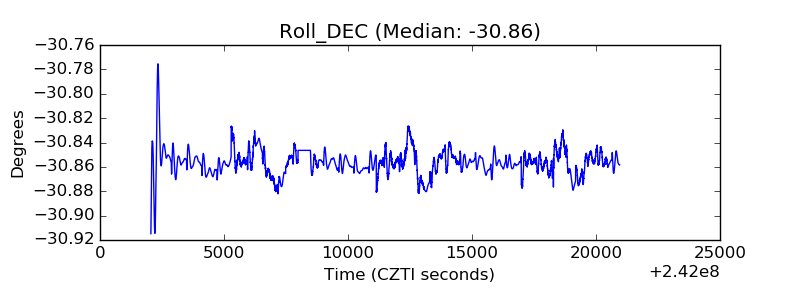 |
| _Roll_RA | 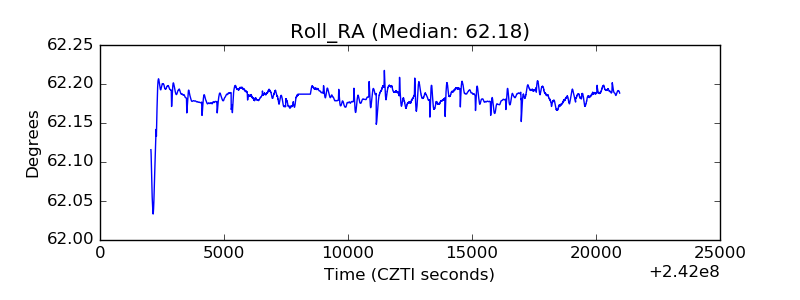 |
| Veto Counter | 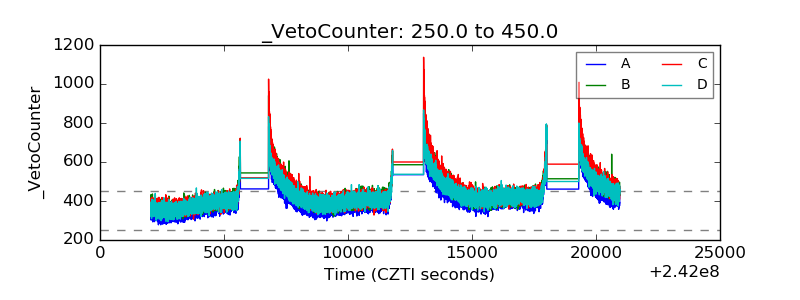 |