| Param | Original file | Final file |
|---|---|---|
| Filename | modeM0/AS1A03_126T01_9000001512_10437cztM0_level2.evt | modeM0/AS1A03_126T01_9000001512_10437cztM0_level2_quad_clean.evt |
| Size (bytes) | 366,632,640 | 63,532,800 |
| Size | 349.6 MB | 60.6 MB |
| Events in quadrant A | 2,797,172 | 330,698 |
| Events in quadrant B | 2,472,692 | 398,191 |
| Events in quadrant C | 2,326,841 | 433,256 |
| Events in quadrant D | 3,186,982 | 432,396 |
| Mode SS | |||
|---|---|---|---|
| Quadrant | BADHDUFLAG | Total packets | Discarded packets |
| A | 0 | 264 | 164 |
| B | 0 | 264 | 157 |
| C | 0 | 264 | 156 |
| D | 0 | 252 | 144 |
| Mode M0 | |||
|---|---|---|---|
| Quadrant | BADHDUFLAG | Total packets | Discarded packets |
| A | 0 | 36146 | 25067 |
| B | 0 | 31114 | 20882 |
| C | 0 | 26683 | 16619 |
| D | 0 | 31534 | 18706 |
| Mode M9 | |||
|---|---|---|---|
| Quadrant | BADHDUFLAG | Total packets | Discarded packets |
| A | 0 | 24 | 10 |
| B | 0 | 26 | 11 |
| C | 0 | 26 | 12 |
| D | 0 | 26 | 10 |
| Quadrant | Total seconds | Saturated seconds | Saturation percentage |
|---|---|---|---|
| A | 3952 | 49 | 1.239879% |
| B | 4580 | 48 | 1.048035% |
| C | 4898 | 27 | 0.551245% |
| D | 5216 | 40 | 0.766871% |
Noise dominated data is calculated using 1-second bins in cleaned event files. If a bin has >2000 counts, and if more than 50% of those come from <1% of pixels, then it is considered to be noise-dominated and hence unusable.
| Quadrant | # 1 sec bins | Bins with >0 counts | Bins with >2000 counts | High rate bins dominated by noise | Noise dominated (total time) | Noise dominated (detector-on time) | Marked lightcurve |
|---|---|---|---|---|---|---|---|
| A | 7578 | 5184 | 0 | 0 | 0.00% | 0.00% | 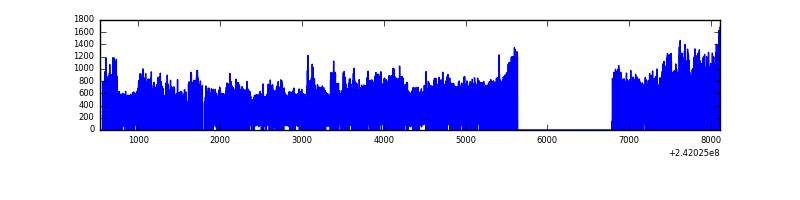 |
| B | 7578 | 5638 | 3 | 3 | 0.04% | 0.05% | 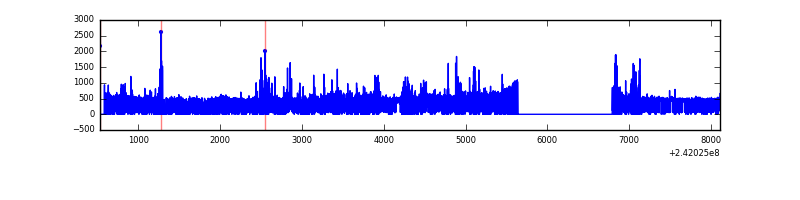 |
| C | 7578 | 5914 | 0 | 0 | 0.00% | 0.00% | 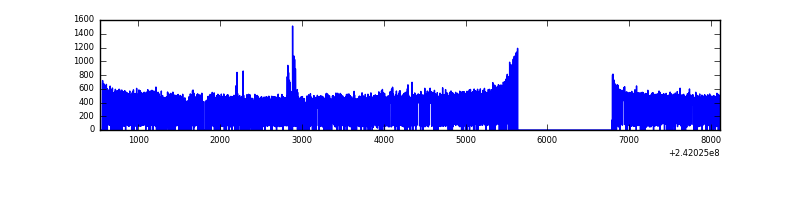 |
| D | 7578 | 5976 | 0 | 0 | 0.00% | 0.00% | 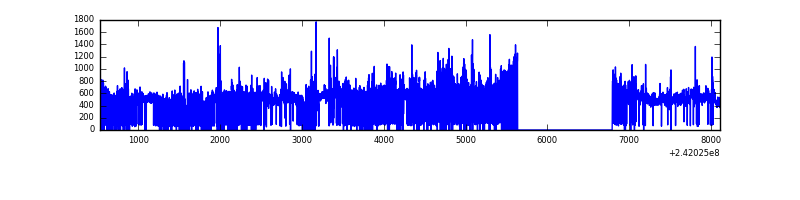 |
Top three noisy pixels from each quadrant. If the there are fewer than three noisy pixels in the level2.evt file, extra rows are filled as -1
| Pixel properties | Quadrant properties | ||||||
|---|---|---|---|---|---|---|---|
| Quadrant | DetID | PixID | Counts | Sigma | Mean | Median | Sigma |
| A | 13 | 251 | 845692 | 8465.0 | 483 | 473 | 99.8 |
| A | 3 | 80 | 84031 | 836.85 | 483 | 473 | 99.8 |
| A | 8 | 5 | 8041 | 75.79 | 483 | 473 | 99.8 |
| B | 4 | 239 | 226077 | 2121.02 | 557 | 543 | 106.3 |
| B | 11 | 51 | 47849 | 444.89 | 557 | 543 | 106.3 |
| B | 4 | 81 | 17944 | 163.65 | 557 | 543 | 106.3 |
| C | 14 | 234 | 20287 | 143.63 | 591 | 595 | 137.1 |
| C | 13 | 61 | 4299 | 27.02 | 591 | 595 | 137.1 |
| C | 14 | 67 | 3487 | 21.09 | 591 | 595 | 137.1 |
| D | 8 | 195 | 341802 | 2255.32 | 625 | 609 | 151.3 |
| D | 1 | 20 | 334515 | 2207.15 | 625 | 609 | 151.3 |
| D | 1 | 52 | 64000 | 419.02 | 625 | 609 | 151.3 |
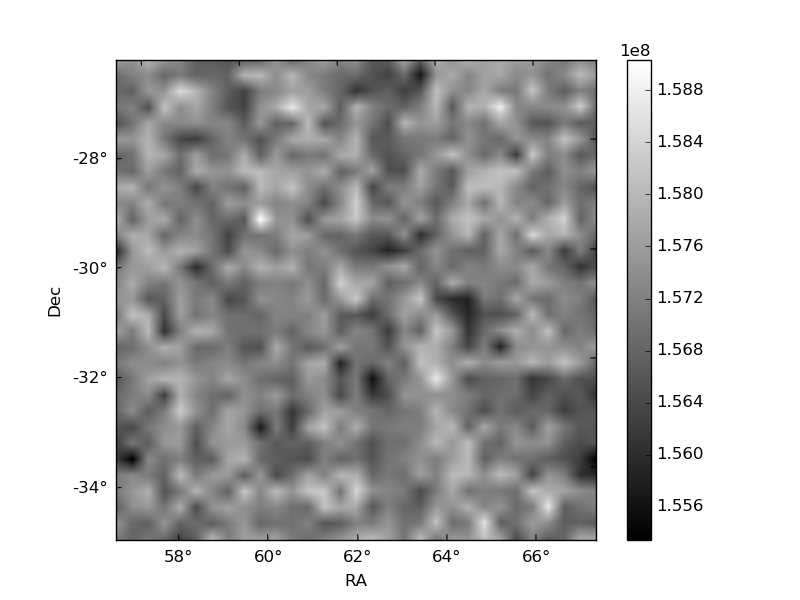
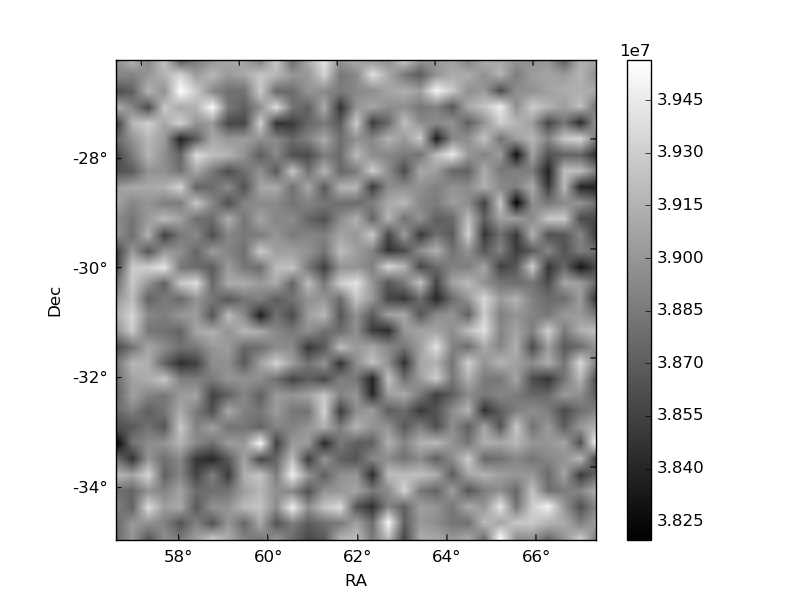
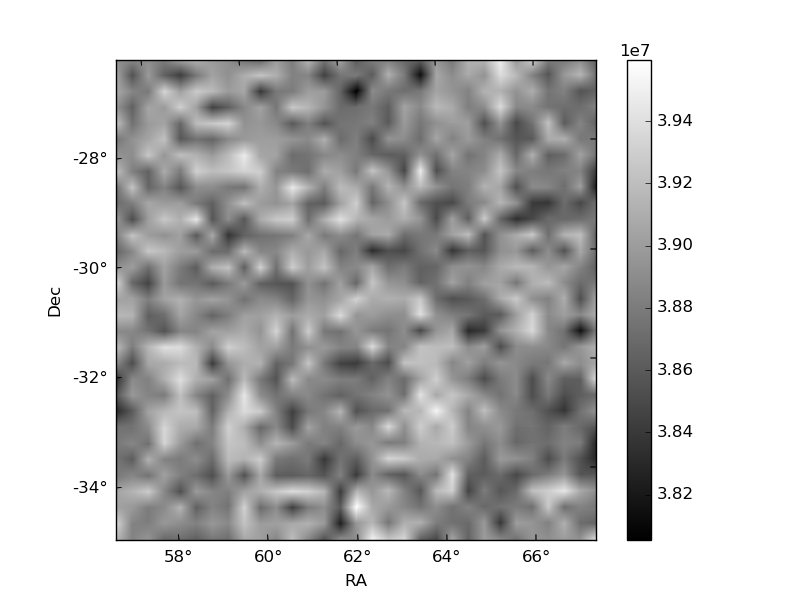
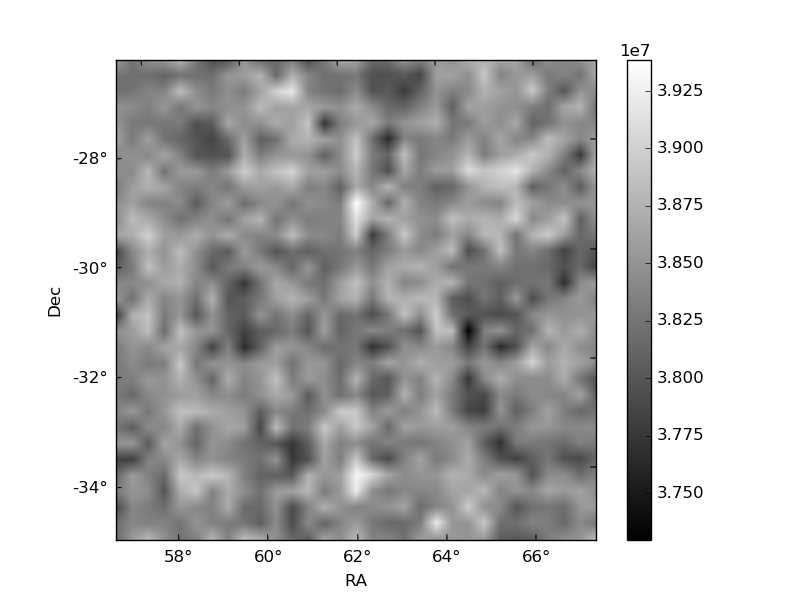
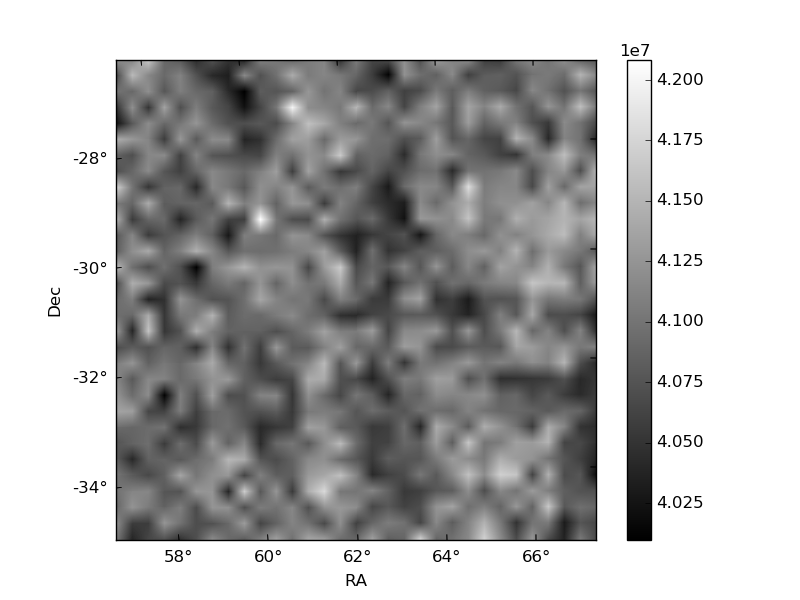
Histogram calculated using DETX and DETY for each event in the final _common_clean file
| Quadrant A | 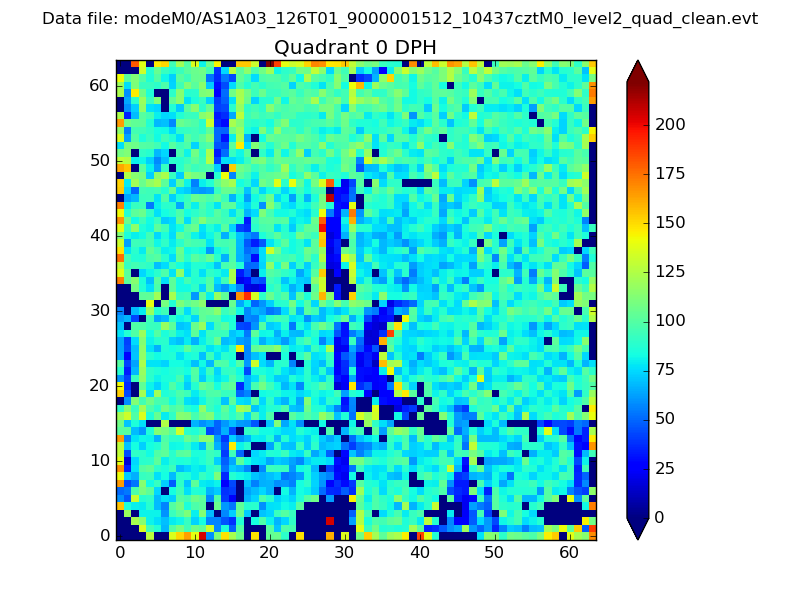 |
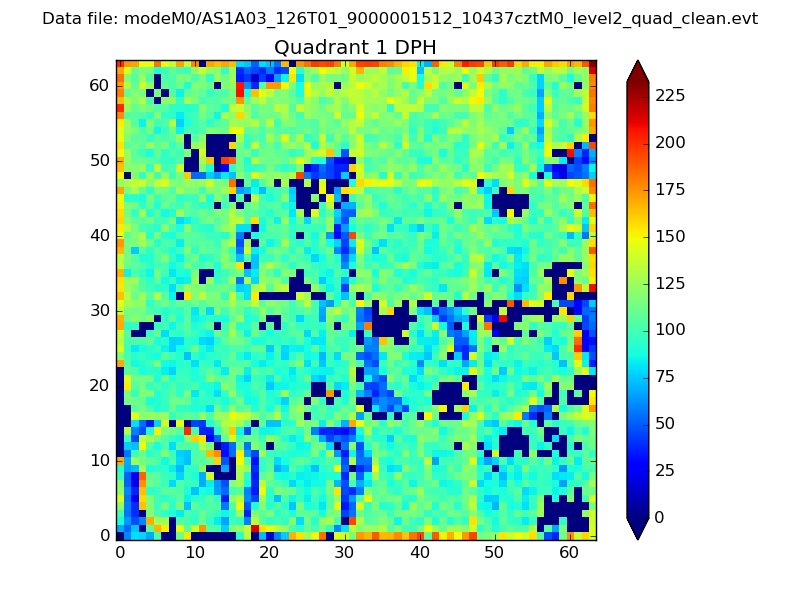 |
Quadrant B |
|---|---|---|---|
| Quadrant D | 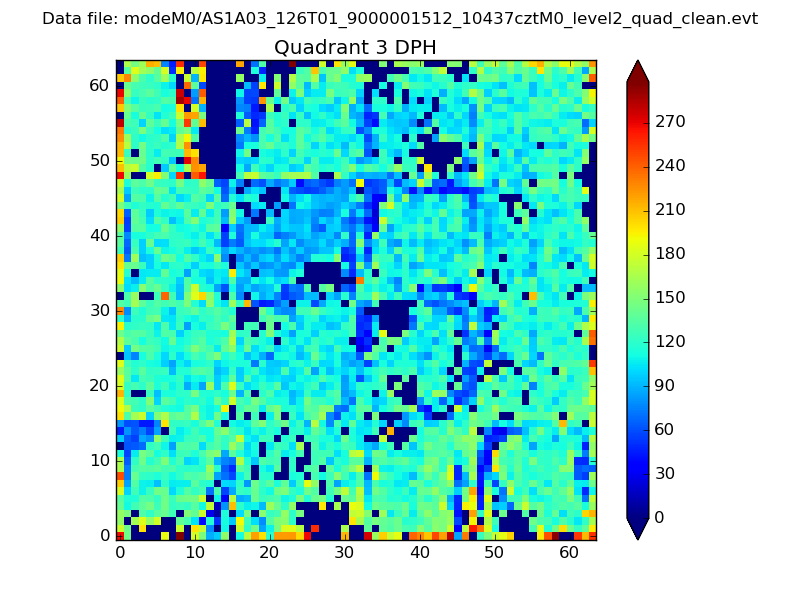 |
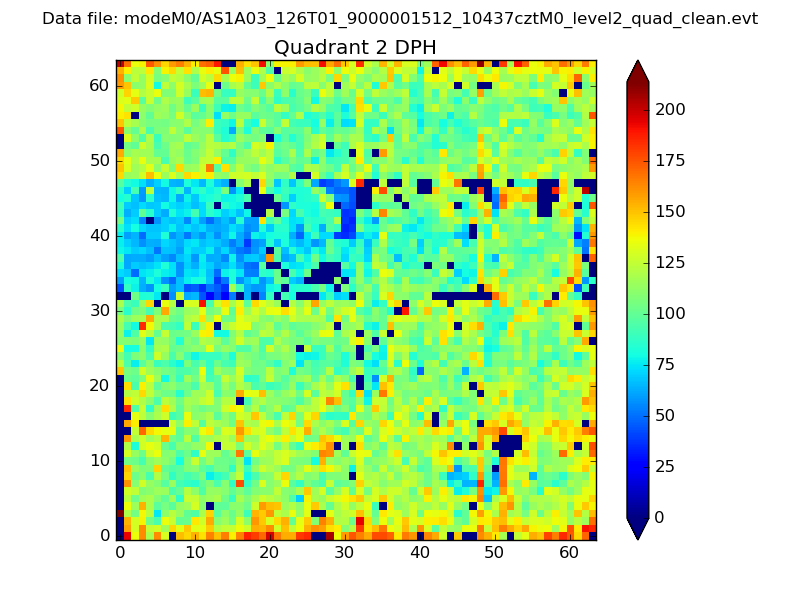 |
Quadrant C |
| Plot type | Count rate plots | Images |
|---|---|---|
| Comparison with Poisson distribution Blue bars denote a histogram of data divided into 1 sec bins. Red curve is a Poisson curve with rate = median count rate of data. |
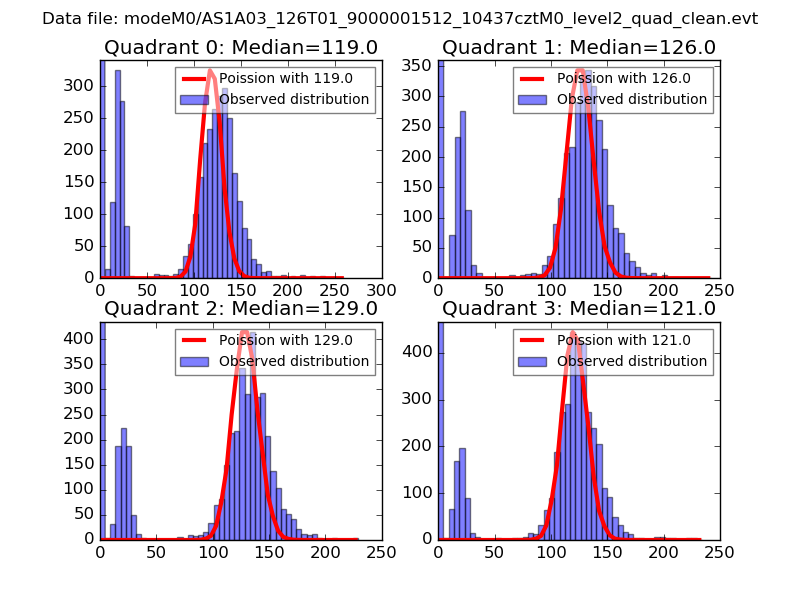 |
 |
| Quadrant-wise count rates Data is divided into 100 sec bins |
 |
|
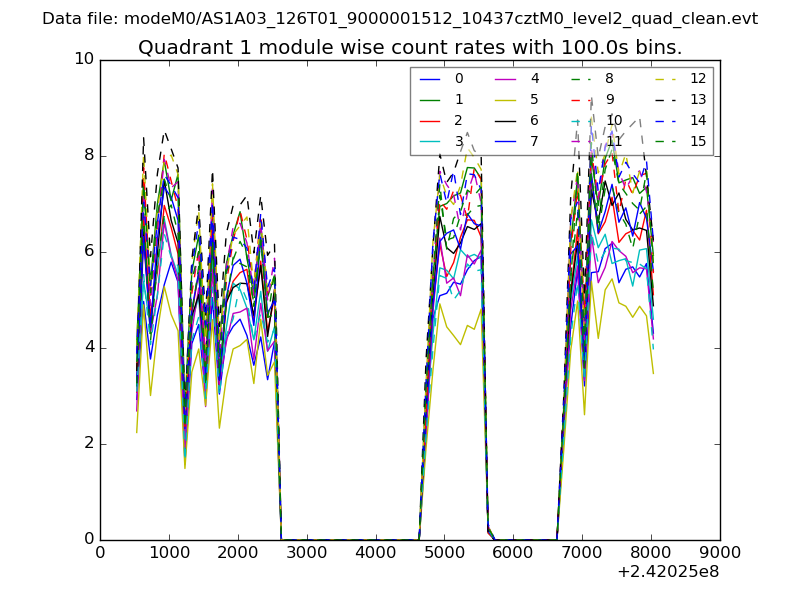
| Module-wise count rates for Quadrant A Data is divided into 100 sec bins |
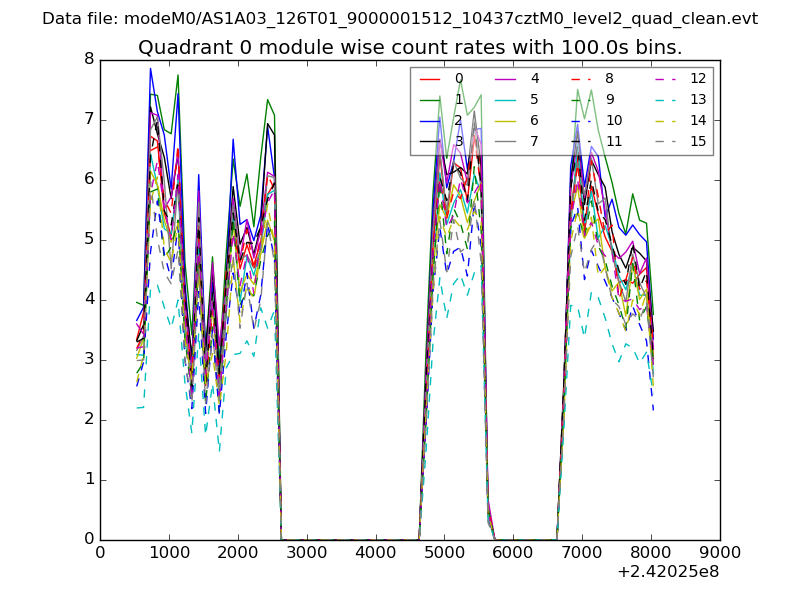 |
 |
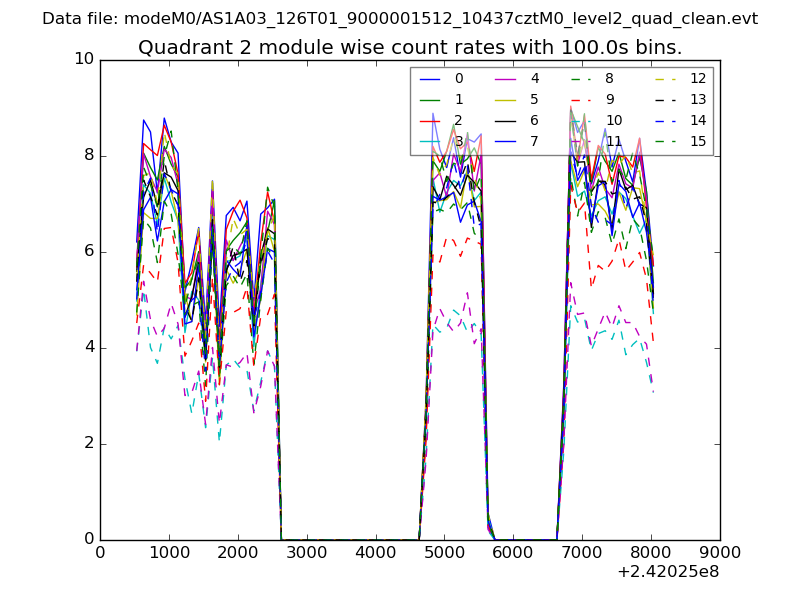
| Module-wise count rates for Quadrant B Data is divided into 100 sec bins |
 |
 |
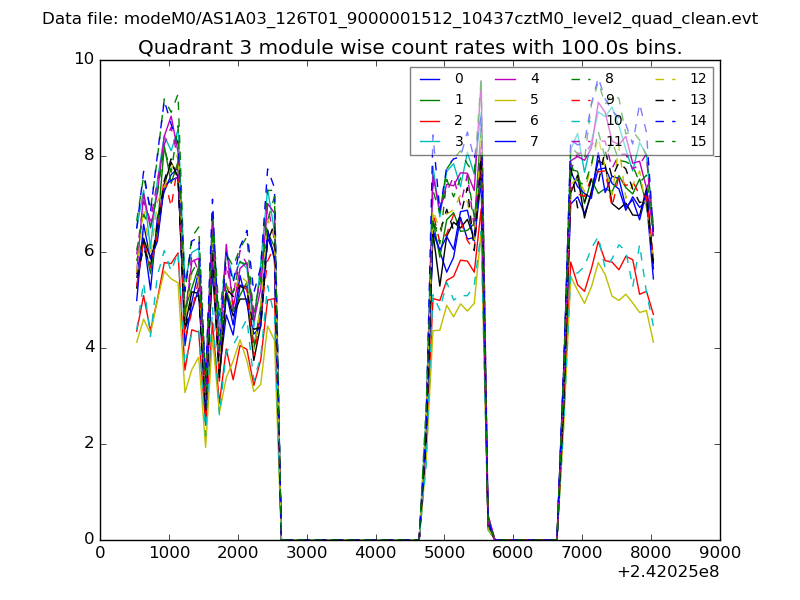
| Module-wise count rates for Quadrant C Data is divided into 100 sec bins |
 |
 |
| Module-wise count rates for Quadrant D Data is divided into 100 sec bins |
 |
 |
| Parameter | Plot |
|---|---|
| CZT HV Monitor | 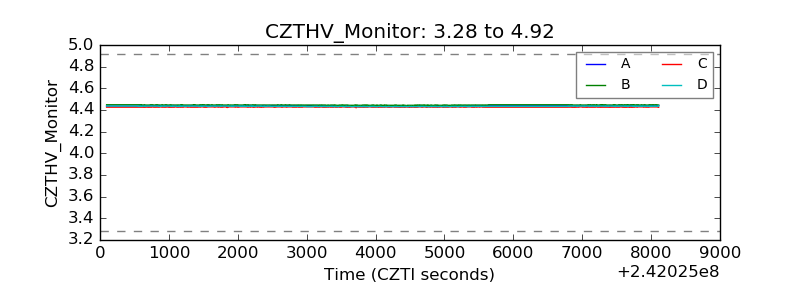 |
| D_VDD | 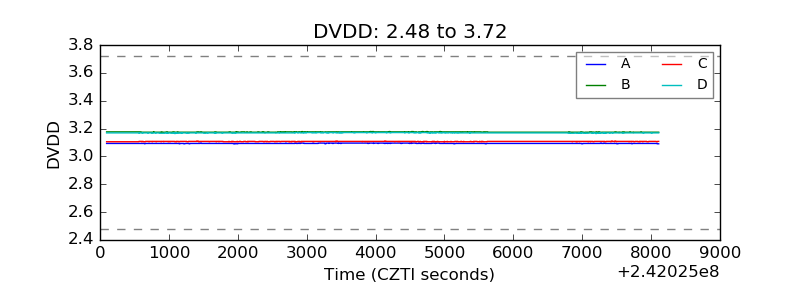 |
| Temperature 1 | 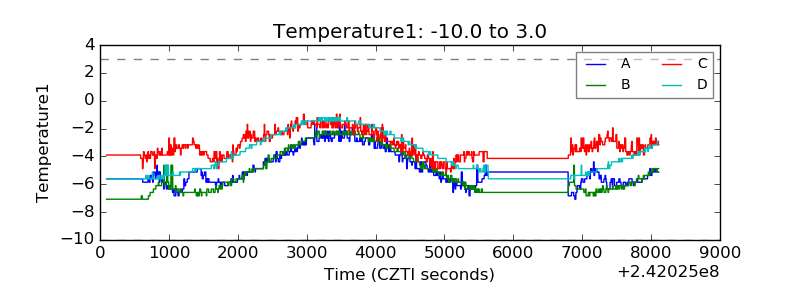 |
| Veto HV Monitor | 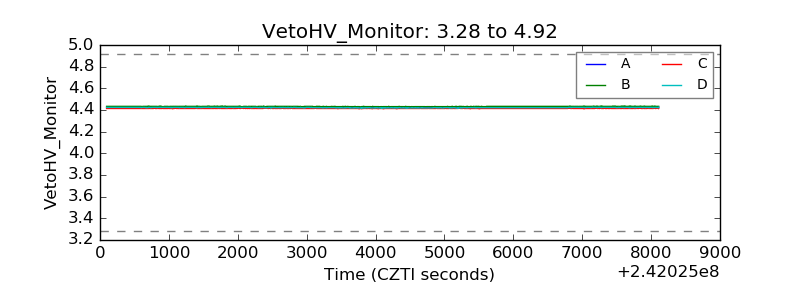 |
| Veto LLD | 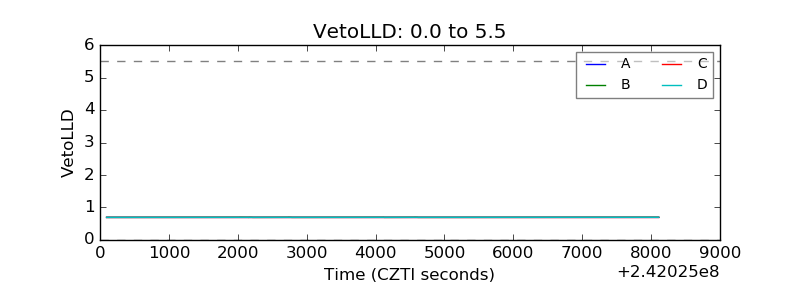 |
| Alpha Counter |  |
| _CPM_Rate | 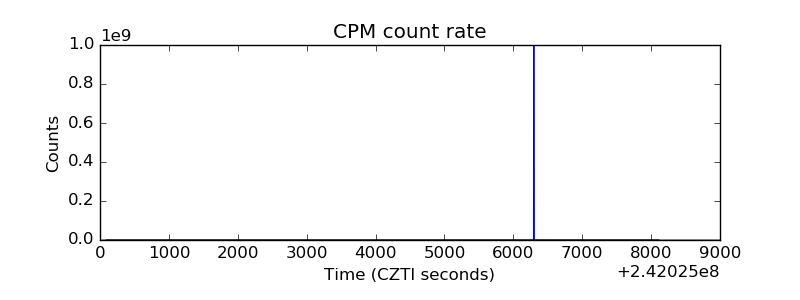 |
| CZT Counter | 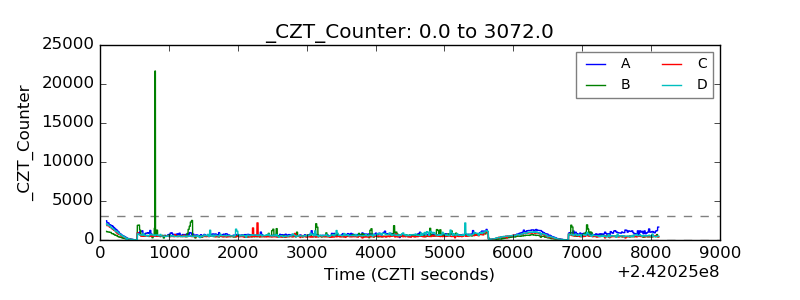 |
| +2.5 Volts monitor |  |
| +5 Volts monitor |  |
| _ROLL_ROT | 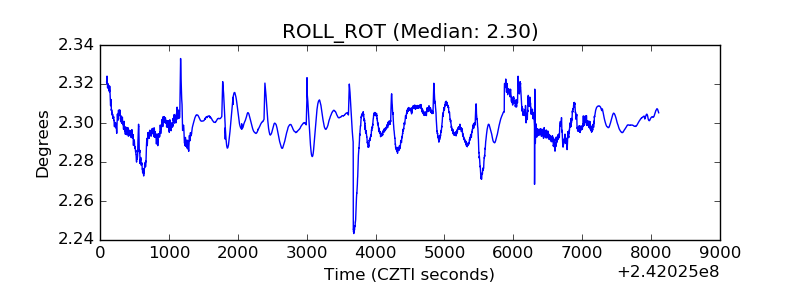 |
| _Roll_DEC | 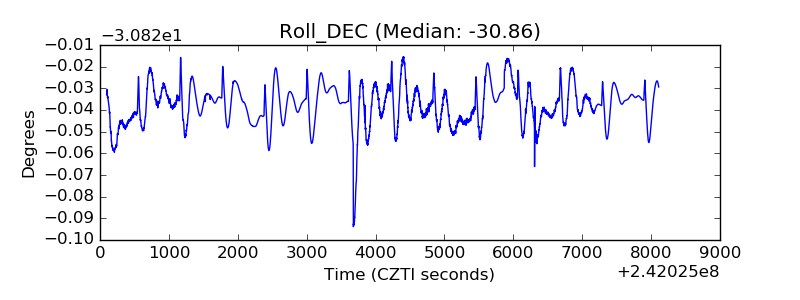 |
| _Roll_RA | 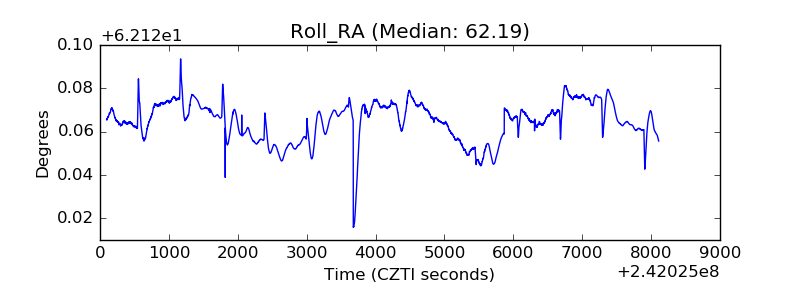 |
| Veto Counter | 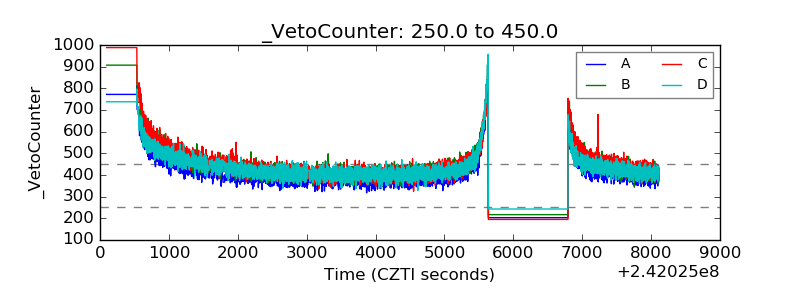 |