| Param | Original file | Final file |
|---|---|---|
| Filename | modeM0/AS1A03_126T01_9000001512_10438cztM0_level2.evt | modeM0/AS1A03_126T01_9000001512_10438cztM0_level2_quad_clean.evt |
| Size (bytes) | 1,279,431,360 | 214,686,720 |
| Size | 1.2 GB | 204.7 MB |
| Events in quadrant A | 11,966,990 | 1,442,720 |
| Events in quadrant B | 9,883,069 | 1,488,175 |
| Events in quadrant C | 7,572,192 | 1,475,118 |
| Events in quadrant D | 8,278,147 | 1,024,876 |
| Mode SS | |||
|---|---|---|---|
| Quadrant | BADHDUFLAG | Total packets | Discarded packets |
| A | 0 | 334 | 2 |
| B | 0 | 334 | 4 |
| C | 0 | 334 | 2 |
| D | 0 | 334 | 6 |
| Mode M0 | |||
|---|---|---|---|
| Quadrant | BADHDUFLAG | Total packets | Discarded packets |
| A | 0 | 47656 | 1097 |
| B | 0 | 40734 | 571 |
| C | 0 | 33733 | 360 |
| D | 0 | 42538 | 8933 |
| Mode M9 | |||
|---|---|---|---|
| Quadrant | BADHDUFLAG | Total packets | Discarded packets |
| A | 0 | 33 | 0 |
| B | 0 | 33 | 0 |
| C | 0 | 33 | 0 |
| D | 0 | 33 | 0 |
| Quadrant | Total seconds | Saturated seconds | Saturation percentage |
|---|---|---|---|
| A | 16132 | 220 | 1.363749% |
| B | 16229 | 519 | 3.197979% |
| C | 16252 | 68 | 0.418410% |
| D | 13309 | 125 | 0.939214% |
Noise dominated data is calculated using 1-second bins in cleaned event files. If a bin has >2000 counts, and if more than 50% of those come from <1% of pixels, then it is considered to be noise-dominated and hence unusable.
| Quadrant | # 1 sec bins | Bins with >0 counts | Bins with >2000 counts | High rate bins dominated by noise | Noise dominated (total time) | Noise dominated (detector-on time) | Marked lightcurve |
|---|---|---|---|---|---|---|---|
| A | 37292 | 16380 | 8 | 8 | 0.02% | 0.05% | 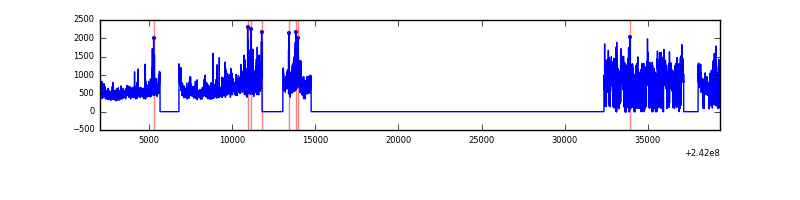 |
| B | 37292 | 16391 | 300 | 300 | 0.80% | 1.83% | 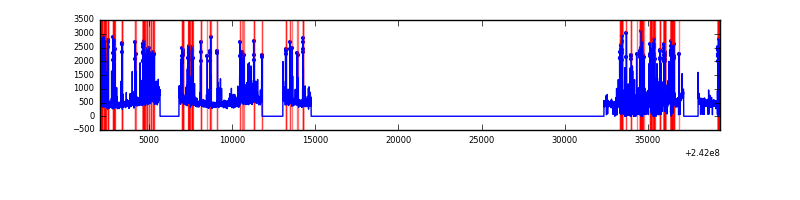 |
| C | 37292 | 16409 | 5 | 5 | 0.01% | 0.03% | 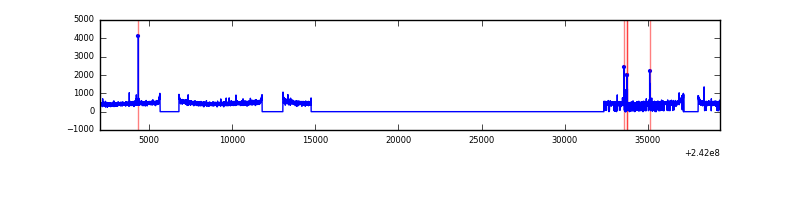 |
| D | 33461 | 13436 | 103 | 103 | 0.31% | 0.77% | 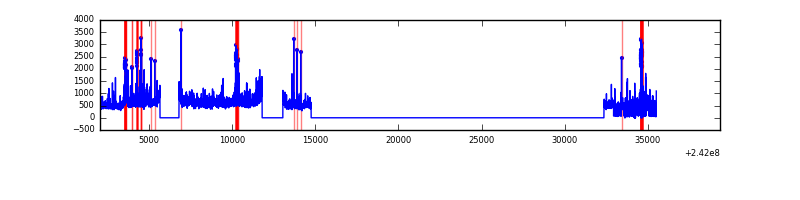 |
Top three noisy pixels from each quadrant. If the there are fewer than three noisy pixels in the level2.evt file, extra rows are filled as -1
| Pixel properties | Quadrant properties | ||||||
|---|---|---|---|---|---|---|---|
| Quadrant | DetID | PixID | Counts | Sigma | Mean | Median | Sigma |
| A | 13 | 251 | 3945843 | 10055.45 | 1941 | 1899 | 392.2 |
| A | 3 | 80 | 327136 | 829.22 | 1941 | 1899 | 392.2 |
| A | 8 | 5 | 166237 | 418.99 | 1941 | 1899 | 392.2 |
| B | 4 | 239 | 2020619 | 5536.13 | 1942 | 1895 | 364.6 |
| B | 11 | 51 | 118860 | 320.76 | 1942 | 1895 | 364.6 |
| B | 0 | 214 | 83373 | 223.44 | 1942 | 1895 | 364.6 |
| C | 14 | 234 | 55201 | 120.03 | 1925 | 1935 | 443.8 |
| C | 13 | 61 | 14242 | 27.73 | 1925 | 1935 | 443.8 |
| C | 14 | 67 | 8624 | 15.07 | 1925 | 1935 | 443.8 |
| D | 8 | 195 | 968875 | 2651.24 | 1537 | 1495 | 364.9 |
| D | 1 | 20 | 638205 | 1744.99 | 1537 | 1495 | 364.9 |
| D | 13 | 104 | 291775 | 795.55 | 1537 | 1495 | 364.9 |
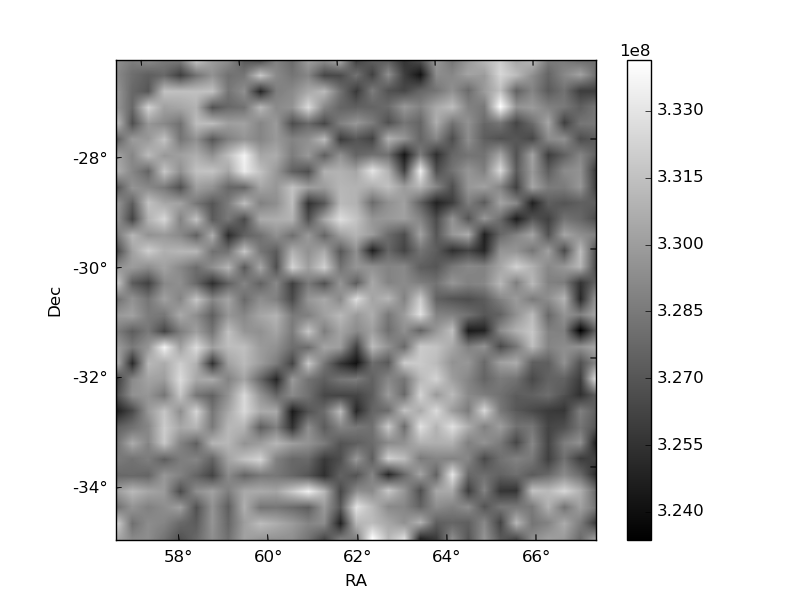
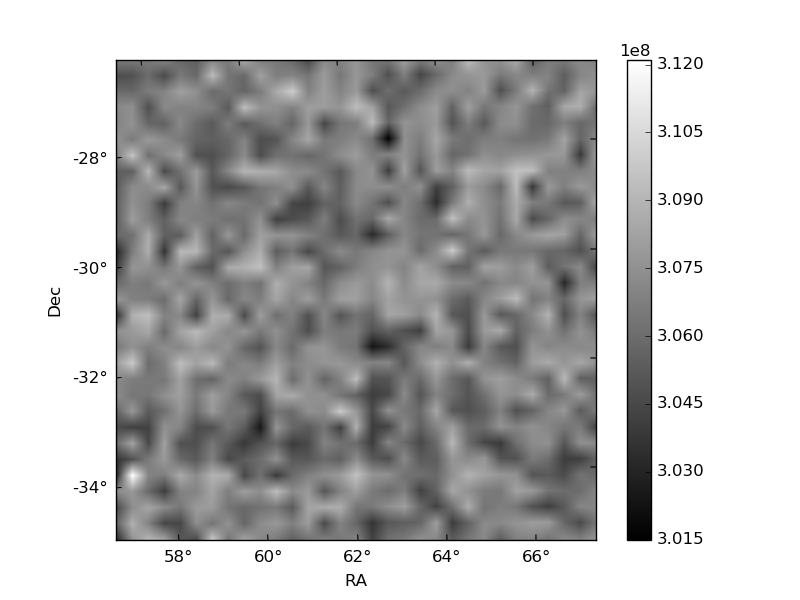
Histogram calculated using DETX and DETY for each event in the final _common_clean file
| Quadrant A | 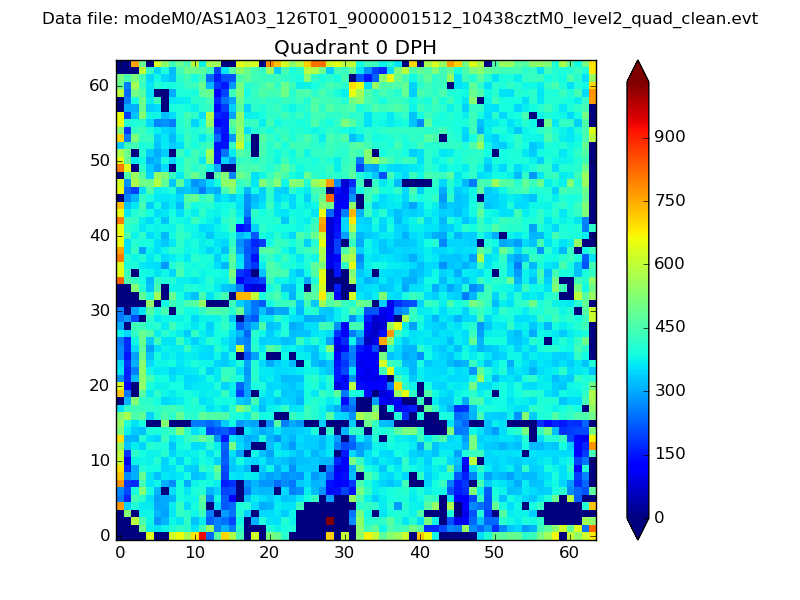 |
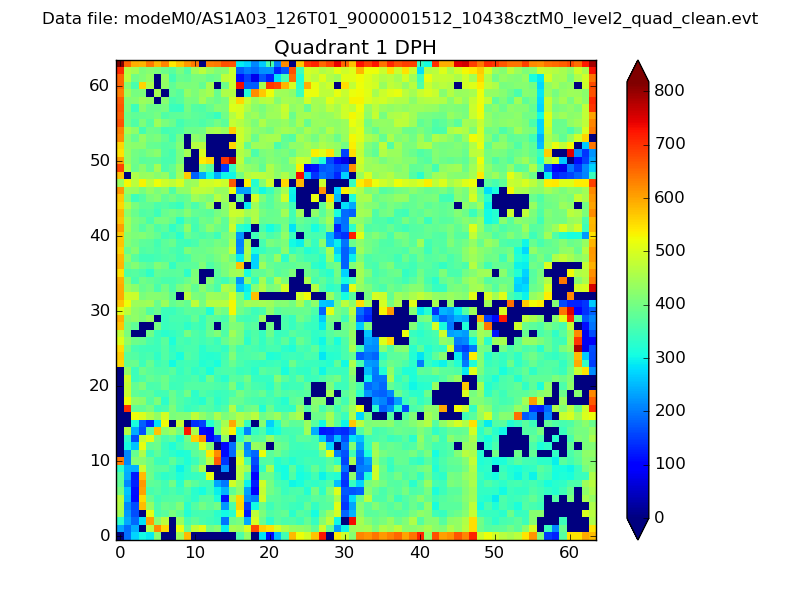 |
Quadrant B |
|---|---|---|---|
| Quadrant D | 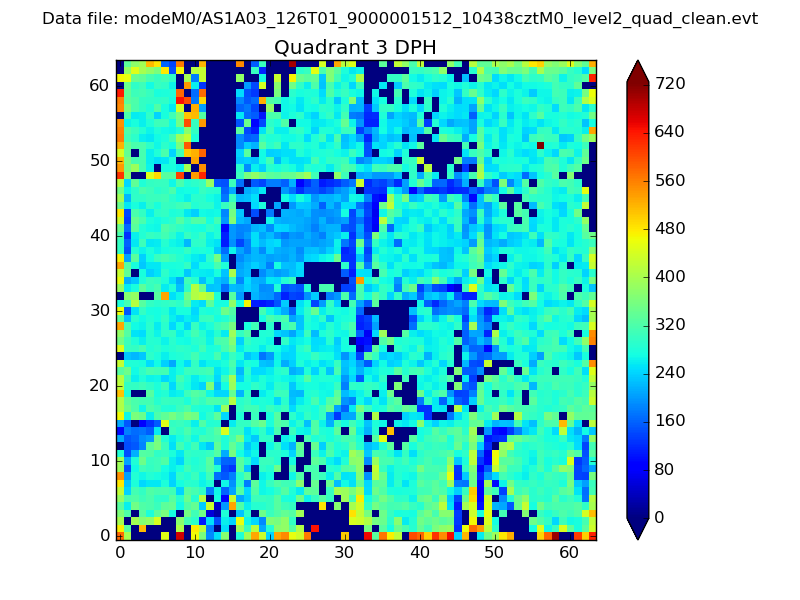 |
 |
Quadrant C |
| Plot type | Count rate plots | Images |
|---|---|---|
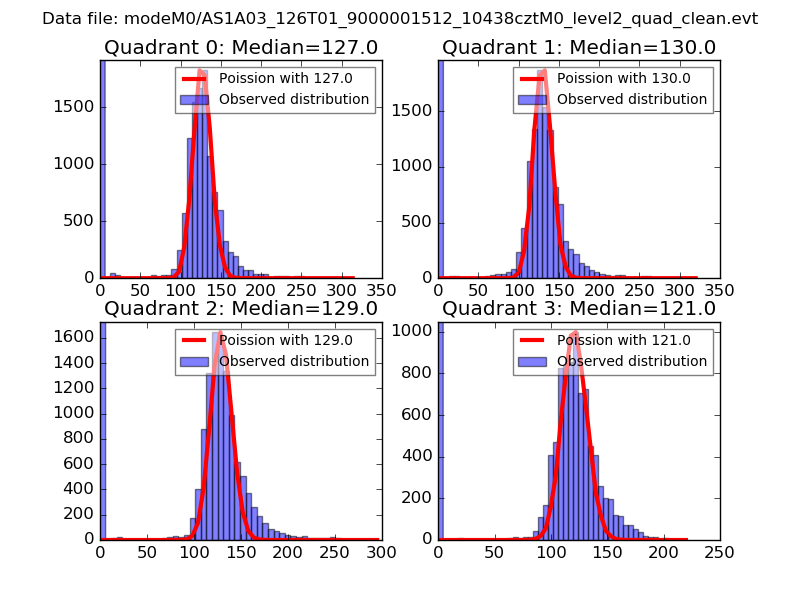
| Comparison with Poisson distribution Blue bars denote a histogram of data divided into 1 sec bins. Red curve is a Poisson curve with rate = median count rate of data. |
 |
 |
| Quadrant-wise count rates Data is divided into 100 sec bins |
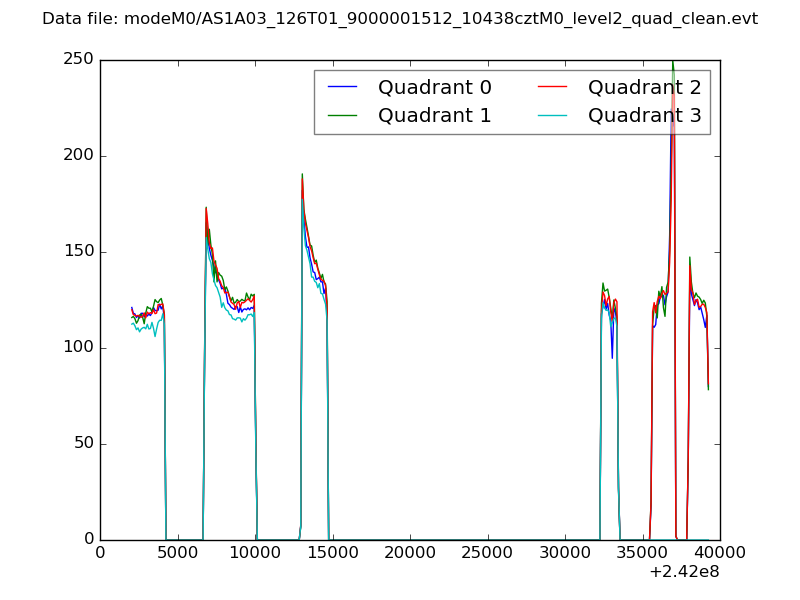 |
|
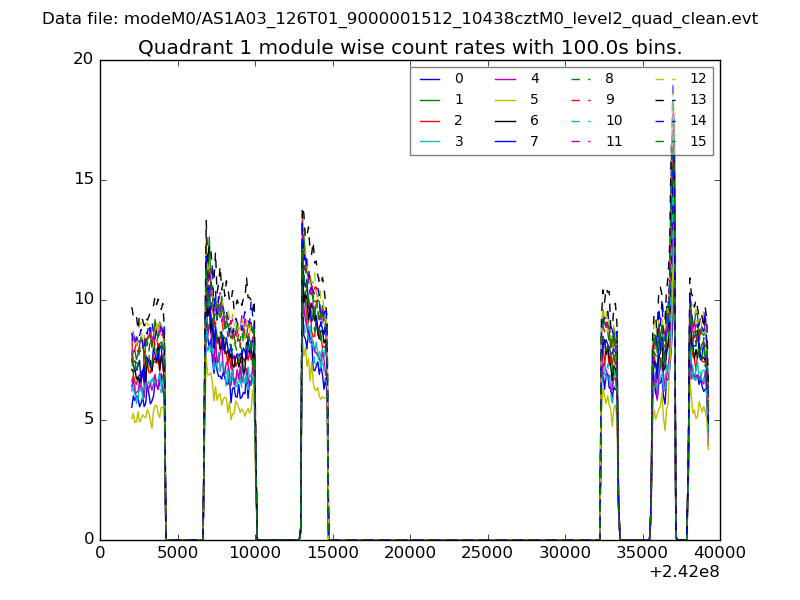
| Module-wise count rates for Quadrant A Data is divided into 100 sec bins |
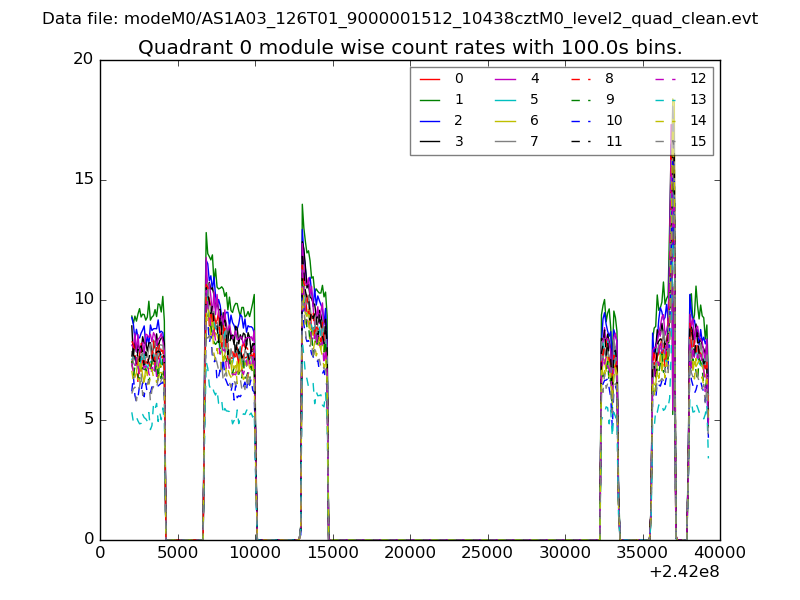 |
 |
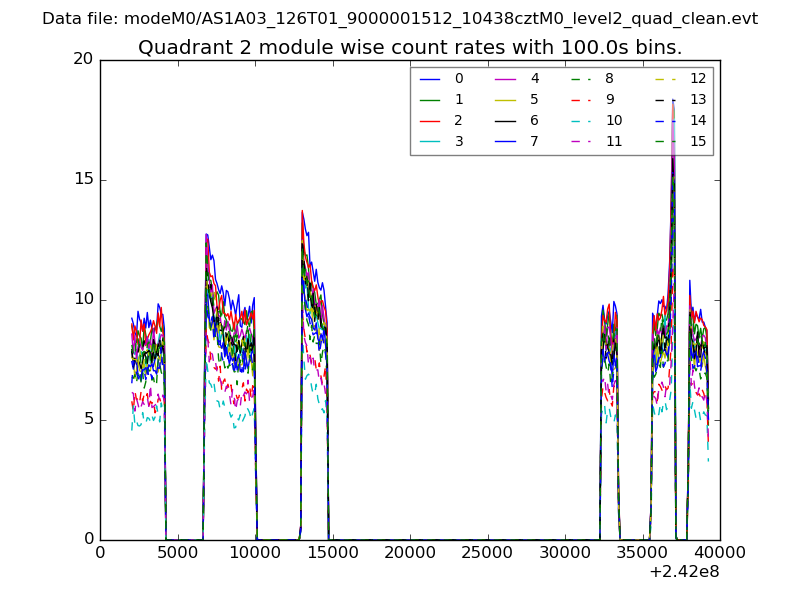
| Module-wise count rates for Quadrant B Data is divided into 100 sec bins |
 |
 |
| Module-wise count rates for Quadrant C Data is divided into 100 sec bins |
 |
 |
| Module-wise count rates for Quadrant D Data is divided into 100 sec bins |
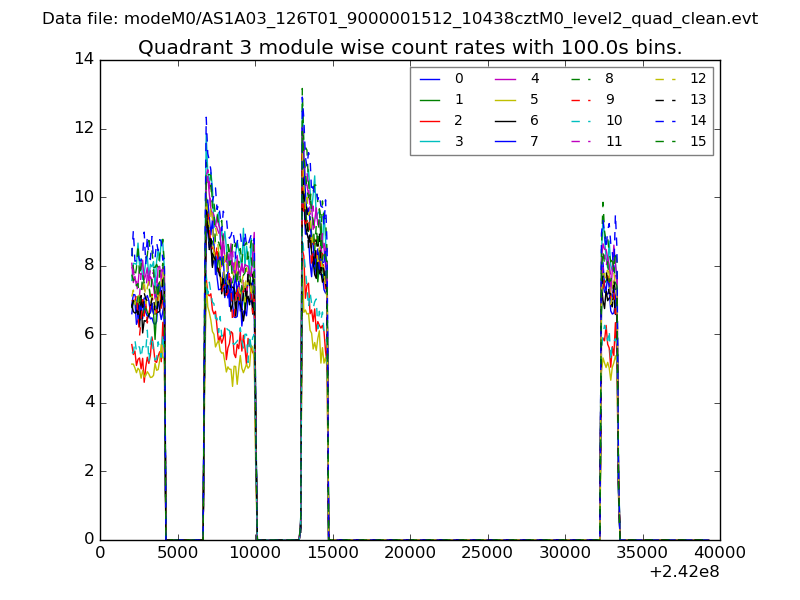 |
 |
| Parameter | Plot |
|---|---|
| CZT HV Monitor | 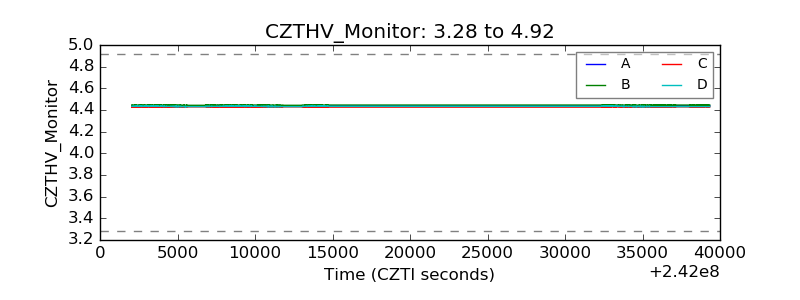 |
| D_VDD | 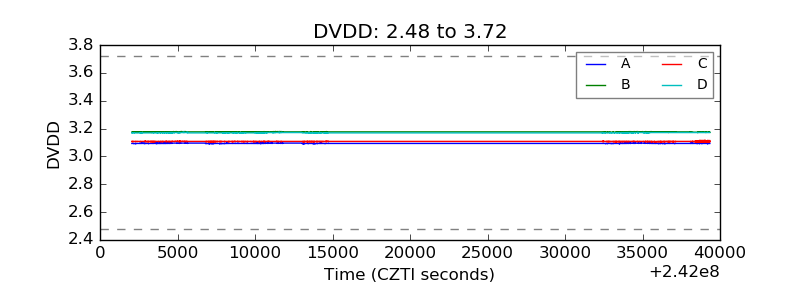 |
| Temperature 1 | 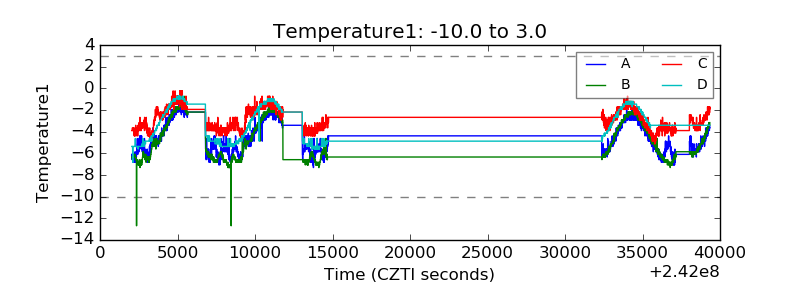 |
| Veto HV Monitor | 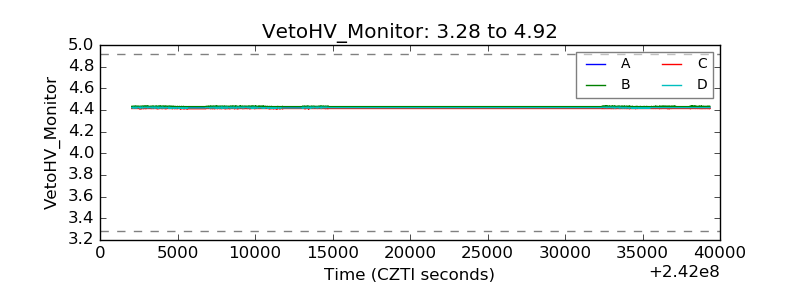 |
| Veto LLD | 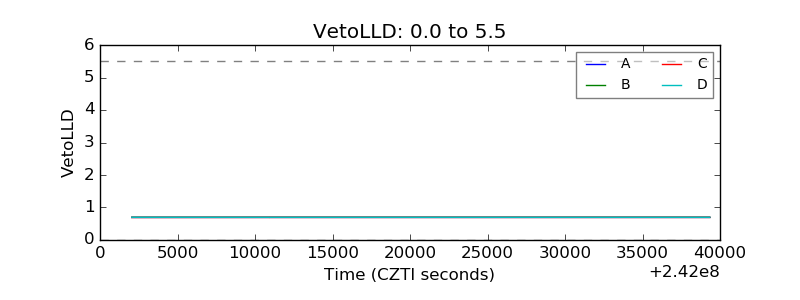 |
| Alpha Counter | 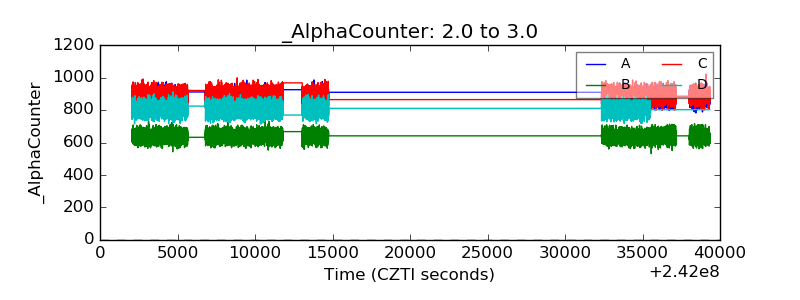 |
| _CPM_Rate | 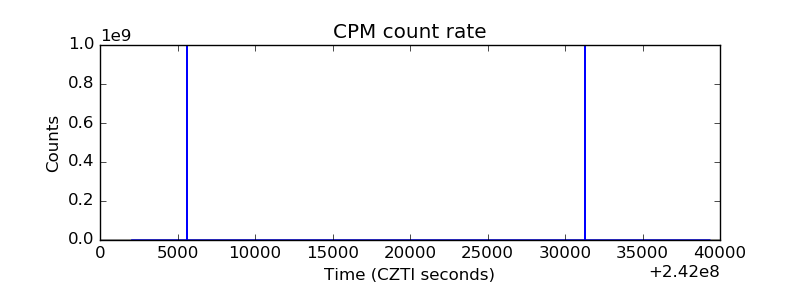 |
| CZT Counter | 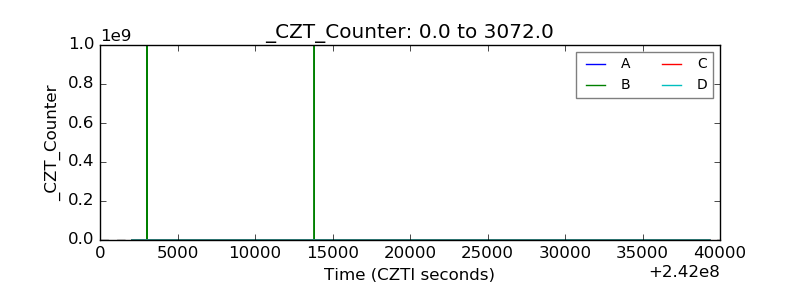 |
| +2.5 Volts monitor |  |
| +5 Volts monitor | 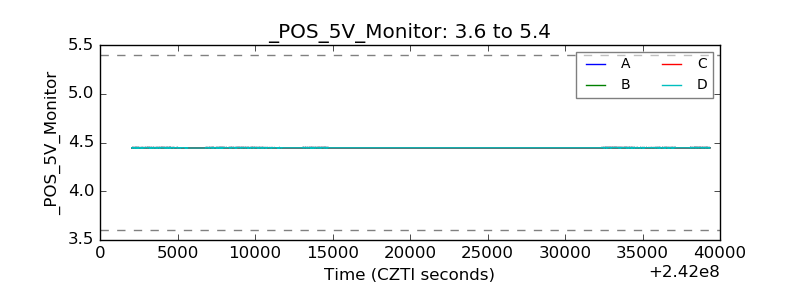 |
| _ROLL_ROT | 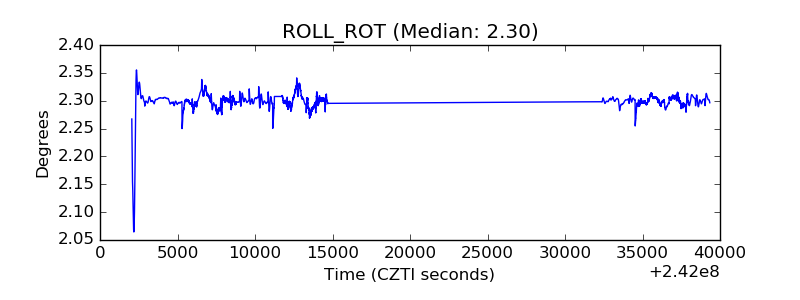 |
| _Roll_DEC | 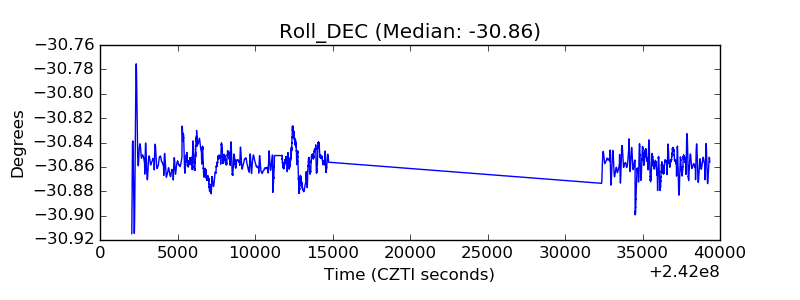 |
| _Roll_RA | 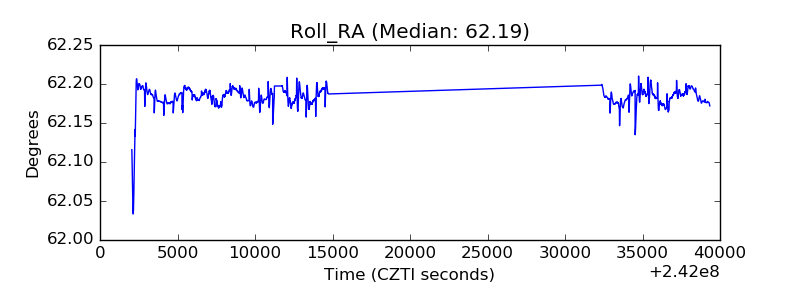 |
| Veto Counter | 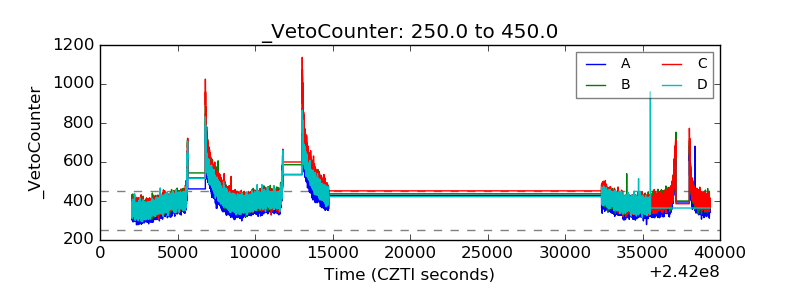 |