| Param | Original file | Final file |
|---|---|---|
| Filename | modeM0/AS1A03_126T01_9000001512_10439cztM0_level2.evt | modeM0/AS1A03_126T01_9000001512_10439cztM0_level2_quad_clean.evt |
| Size (bytes) | 655,372,800 | 85,726,080 |
| Size | 625.0 MB | 81.8 MB |
| Events in quadrant A | 6,612,319 | 519,006 |
| Events in quadrant B | 4,251,699 | 537,856 |
| Events in quadrant C | 3,326,835 | 535,883 |
| Events in quadrant D | 5,169,786 | 501,051 |
| Mode SS | |||
|---|---|---|---|
| Quadrant | BADHDUFLAG | Total packets | Discarded packets |
| A | 0 | 146 | 0 |
| B | 0 | 146 | 0 |
| C | 0 | 146 | 0 |
| D | 0 | 146 | 0 |
| Mode M0 | |||
|---|---|---|---|
| Quadrant | BADHDUFLAG | Total packets | Discarded packets |
| A | 0 | 24981 | 91 |
| B | 0 | 17322 | 41 |
| C | 0 | 14882 | 33 |
| D | 0 | 20276 | 35 |
| Mode M9 | |||
|---|---|---|---|
| Quadrant | BADHDUFLAG | Total packets | Discarded packets |
| A | 0 | 4 | 0 |
| B | 0 | 4 | 0 |
| C | 0 | 4 | 0 |
| D | 0 | 4 | 0 |
| Quadrant | Total seconds | Saturated seconds | Saturation percentage |
|---|---|---|---|
| A | 7198 | 323 | 4.487358% |
| B | 7211 | 322 | 4.465400% |
| C | 7210 | 130 | 1.803051% |
| D | 7215 | 262 | 3.631324% |
Noise dominated data is calculated using 1-second bins in cleaned event files. If a bin has >2000 counts, and if more than 50% of those come from <1% of pixels, then it is considered to be noise-dominated and hence unusable.
| Quadrant | # 1 sec bins | Bins with >0 counts | Bins with >2000 counts | High rate bins dominated by noise | Noise dominated (total time) | Noise dominated (detector-on time) | Marked lightcurve |
|---|---|---|---|---|---|---|---|
| A | 7626 | 7223 | 32 | 32 | 0.42% | 0.44% | 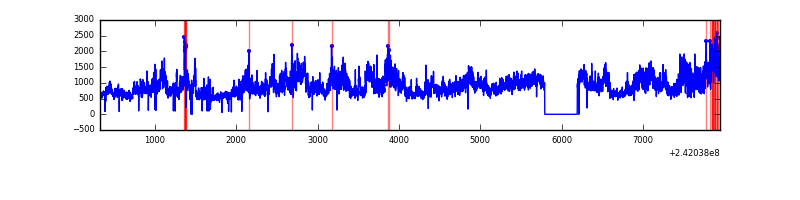 |
| B | 7626 | 7225 | 106 | 106 | 1.39% | 1.47% | 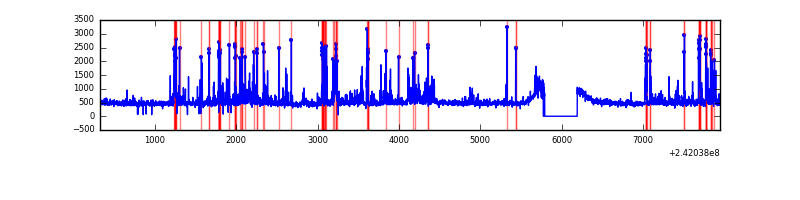 |
| C | 7626 | 7226 | 2 | 2 | 0.03% | 0.03% | 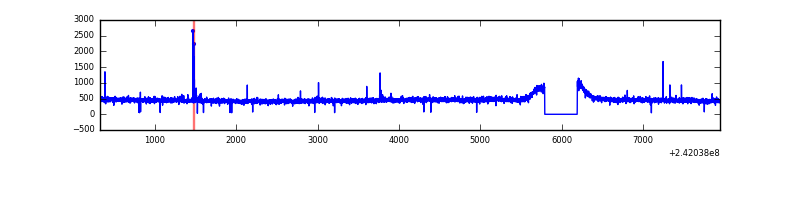 |
| D | 7626 | 7226 | 99 | 99 | 1.30% | 1.37% | 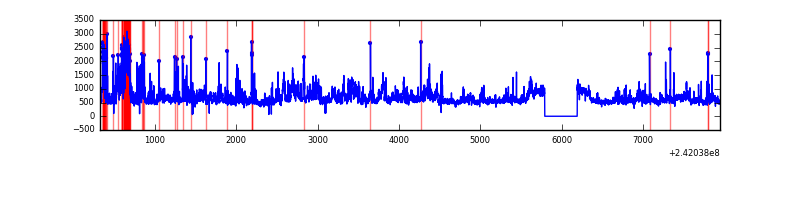 |
Top three noisy pixels from each quadrant. If the there are fewer than three noisy pixels in the level2.evt file, extra rows are filled as -1
| Pixel properties | Quadrant properties | ||||||
|---|---|---|---|---|---|---|---|
| Quadrant | DetID | PixID | Counts | Sigma | Mean | Median | Sigma |
| A | 13 | 251 | 3113036 | 17928.23 | 849 | 829 | 173.6 |
| A | 3 | 80 | 154721 | 886.51 | 849 | 829 | 173.6 |
| A | 8 | 5 | 45572 | 257.74 | 849 | 829 | 173.6 |
| B | 4 | 239 | 728508 | 4457.95 | 848 | 827 | 163.2 |
| B | 11 | 51 | 85215 | 516.98 | 848 | 827 | 163.2 |
| B | 0 | 214 | 42744 | 256.79 | 848 | 827 | 163.2 |
| C | 14 | 234 | 20424 | 100.24 | 841 | 843 | 195.3 |
| C | 8 | 128 | 12716 | 60.78 | 841 | 843 | 195.3 |
| C | 8 | 112 | 6435 | 28.63 | 841 | 843 | 195.3 |
| D | 1 | 20 | 768620 | 3810.37 | 833 | 807 | 201.5 |
| D | 8 | 195 | 443052 | 2194.7 | 833 | 807 | 201.5 |
| D | 5 | 222 | 287088 | 1420.71 | 833 | 807 | 201.5 |
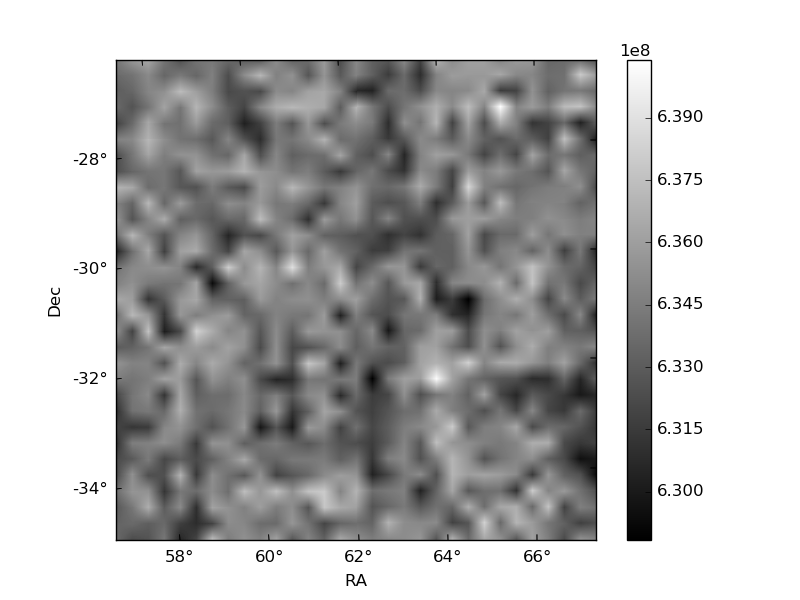
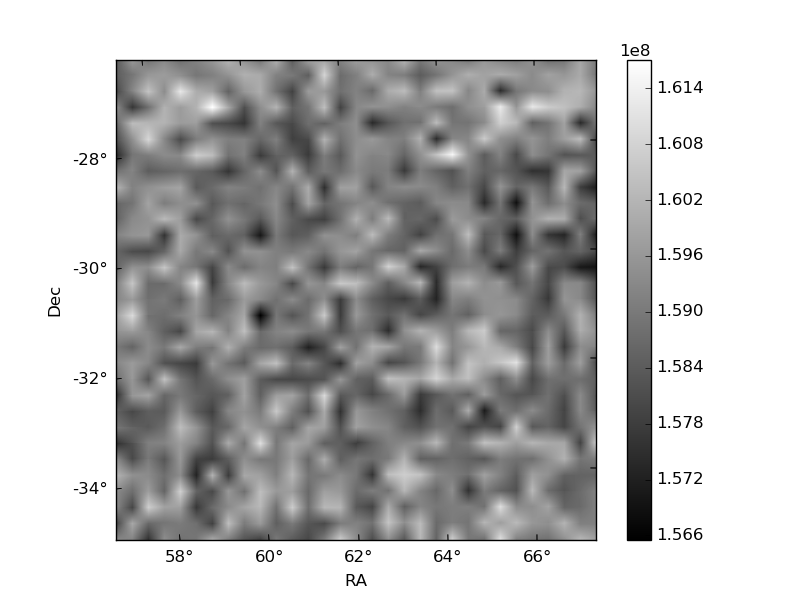
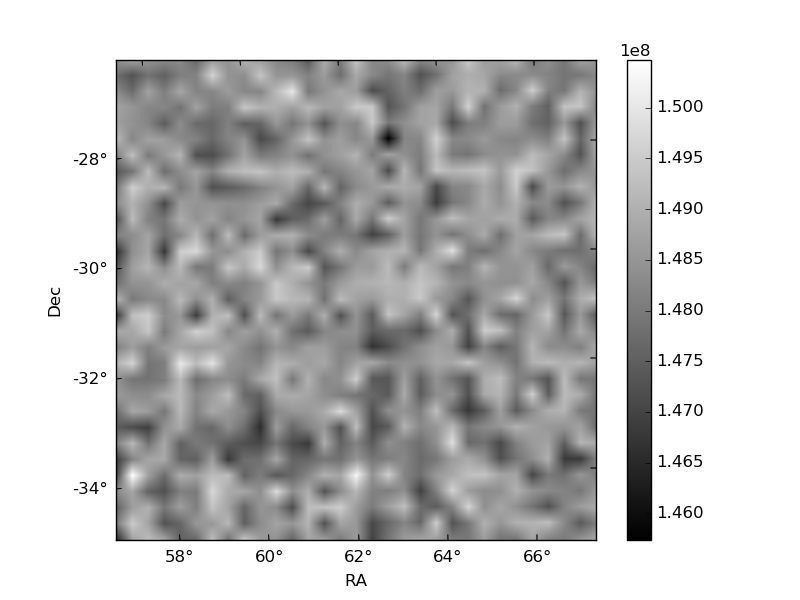
Histogram calculated using DETX and DETY for each event in the final _common_clean file
| Quadrant A | 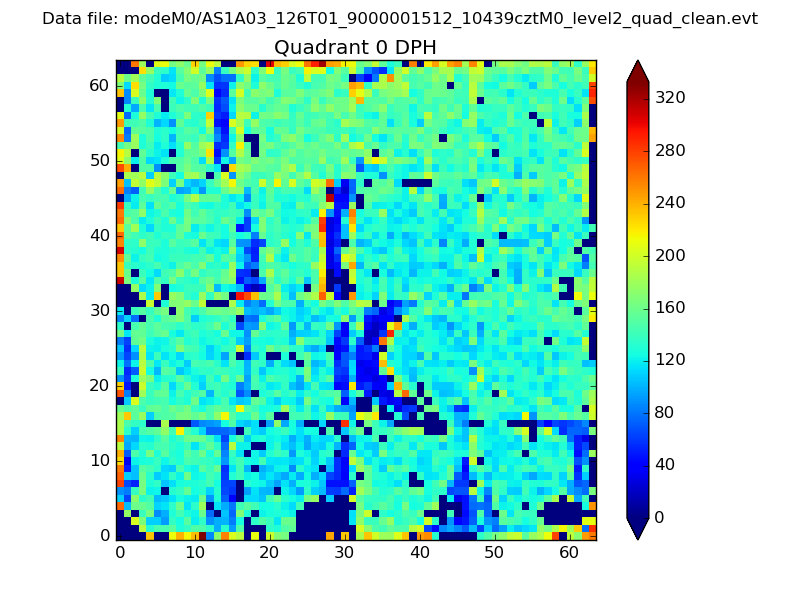 |
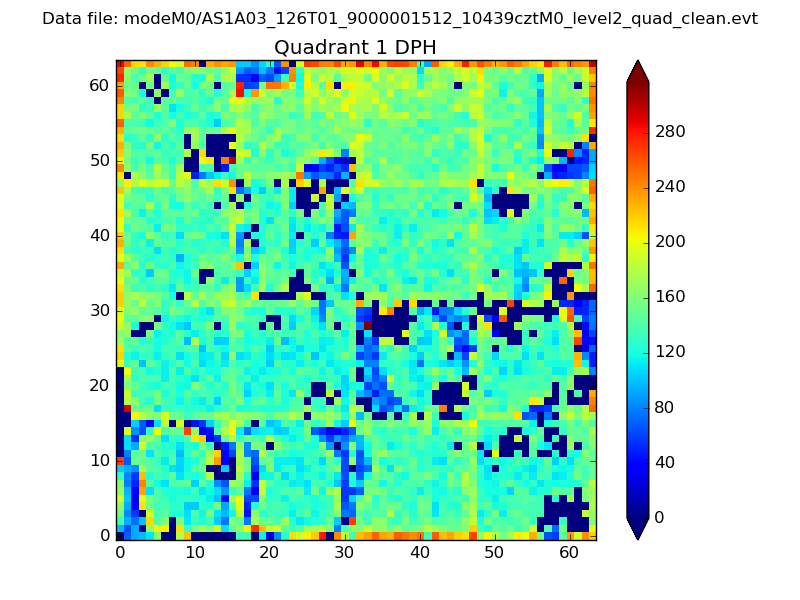 |
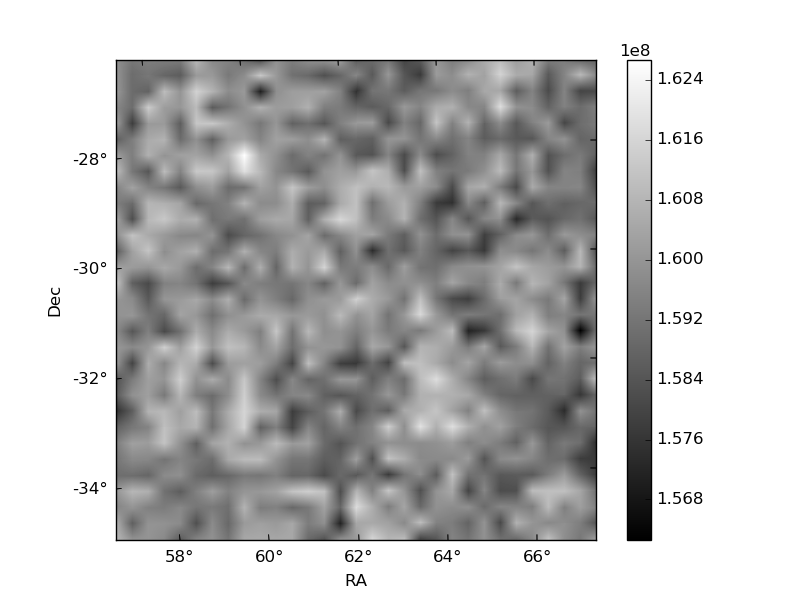
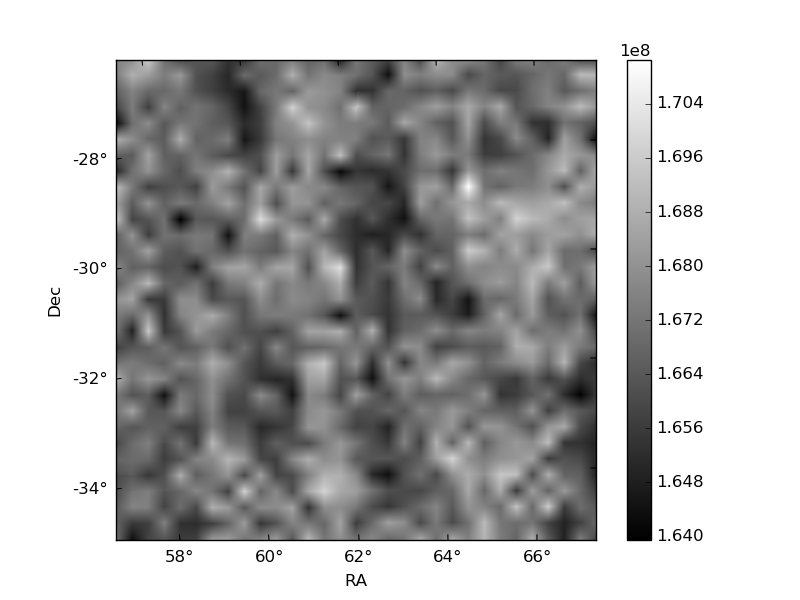
Quadrant B |
|---|---|---|---|
| Quadrant D | 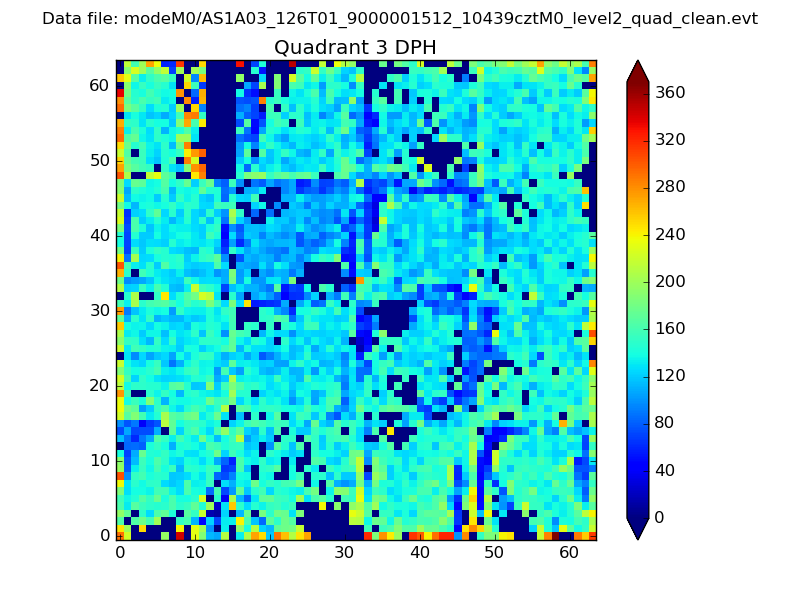 |
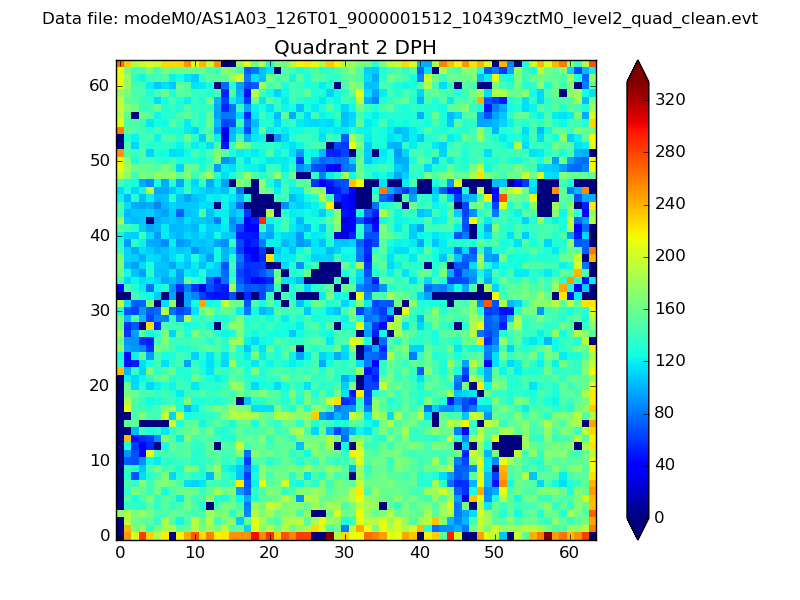 |
Quadrant C |
| Plot type | Count rate plots | Images |
|---|---|---|
| Comparison with Poisson distribution Blue bars denote a histogram of data divided into 1 sec bins. Red curve is a Poisson curve with rate = median count rate of data. |
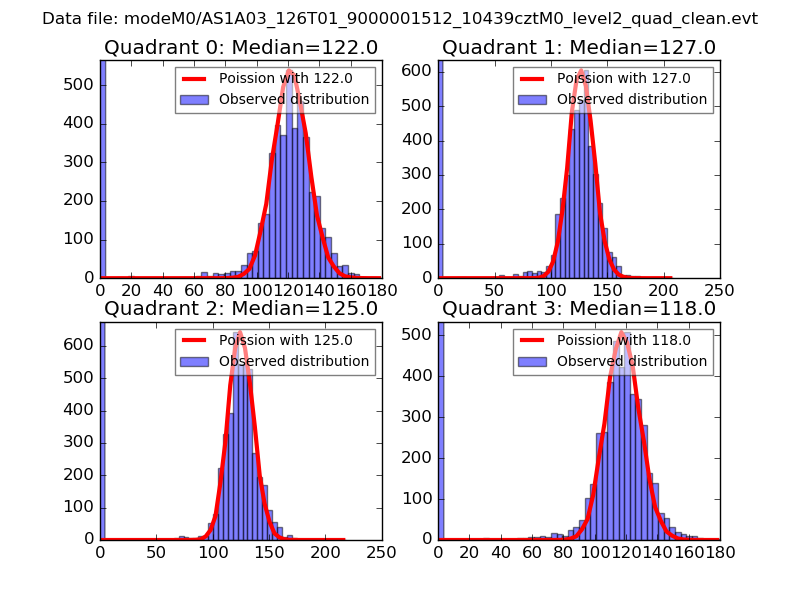 |
 |
| Quadrant-wise count rates Data is divided into 100 sec bins |
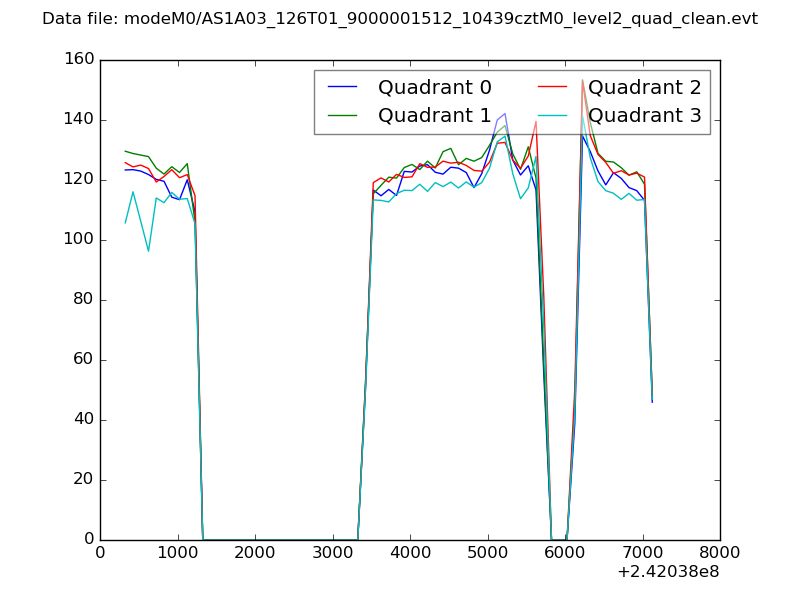 |
|
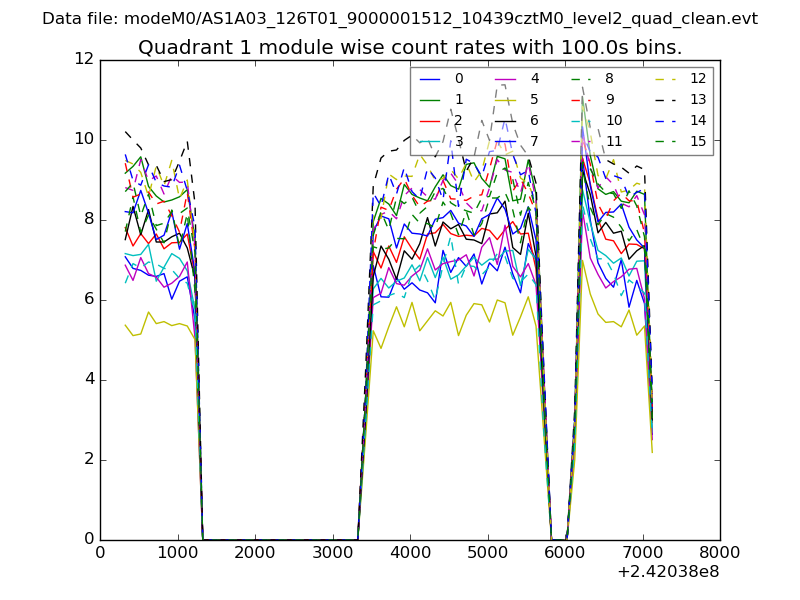
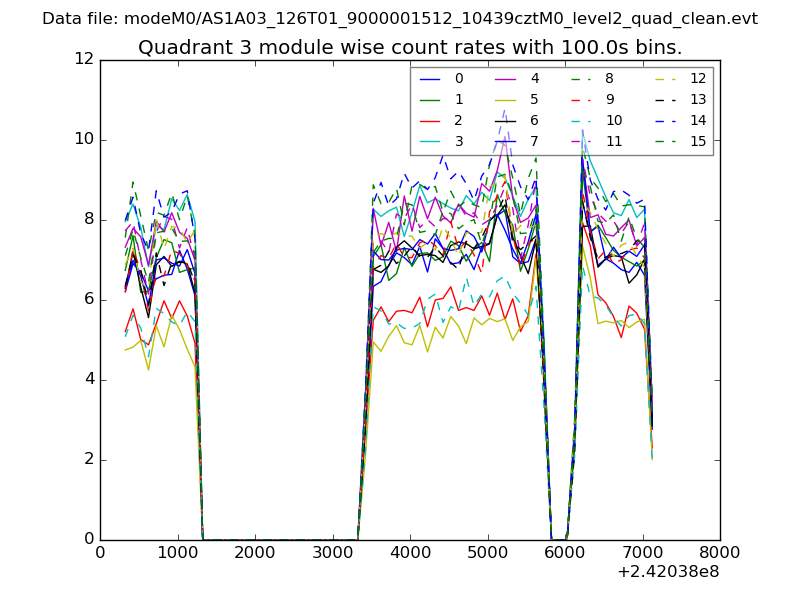
| Module-wise count rates for Quadrant A Data is divided into 100 sec bins |
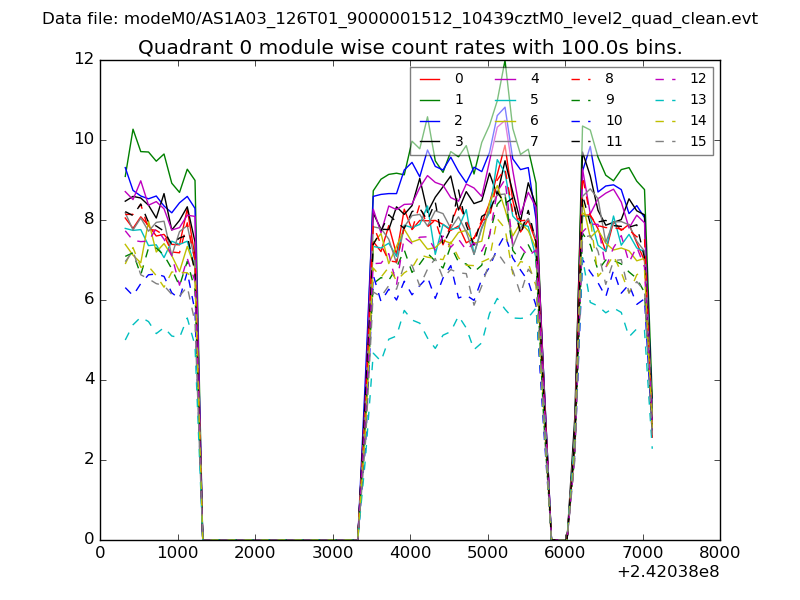 |
 |
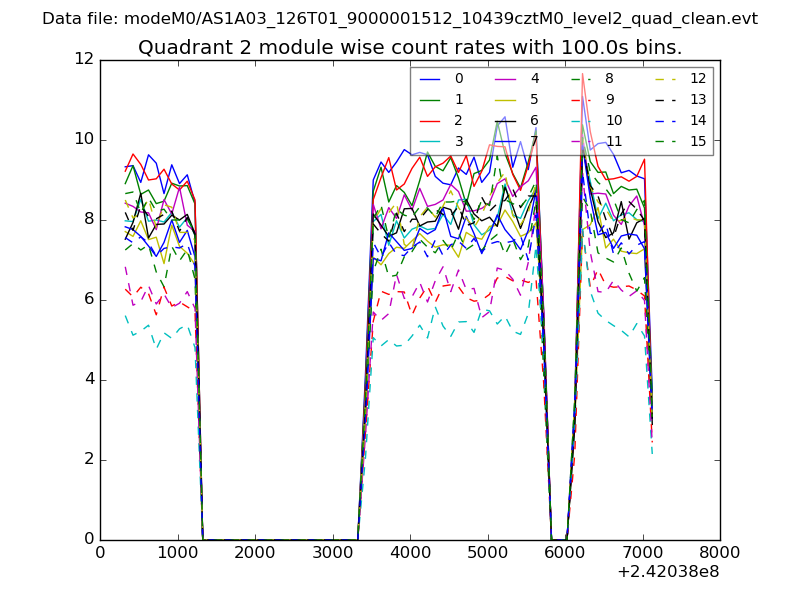
| Module-wise count rates for Quadrant B Data is divided into 100 sec bins |
 |
 |
| Module-wise count rates for Quadrant C Data is divided into 100 sec bins |
 |
 |
| Module-wise count rates for Quadrant D Data is divided into 100 sec bins |
 |
 |
| Parameter | Plot |
|---|---|
| CZT HV Monitor | 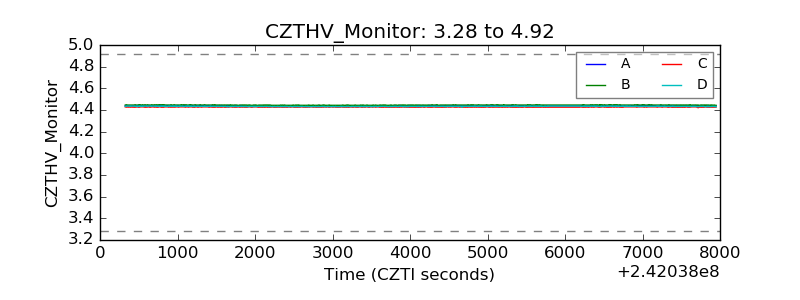 |
| D_VDD | 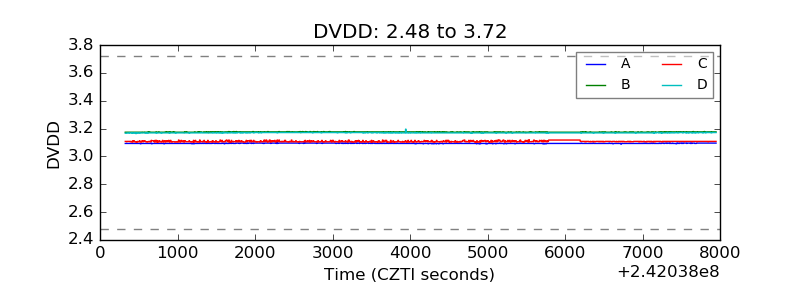 |
| Temperature 1 | 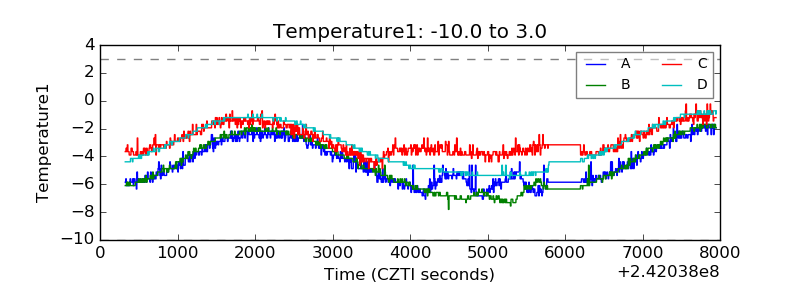 |
| Veto HV Monitor | 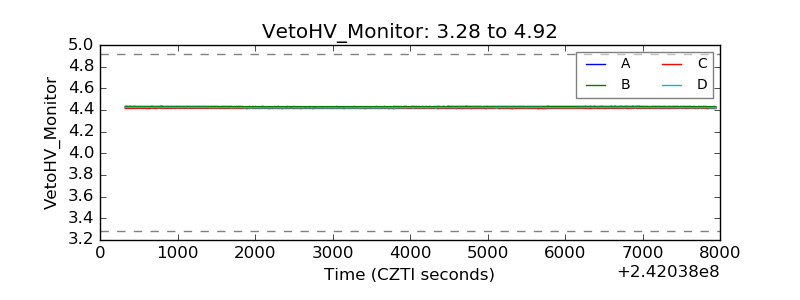 |
| Veto LLD | 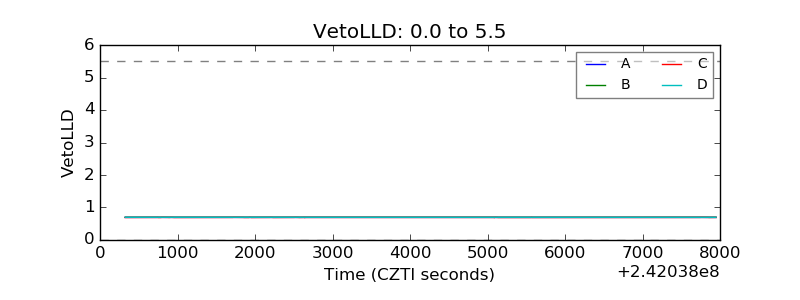 |
| Alpha Counter | 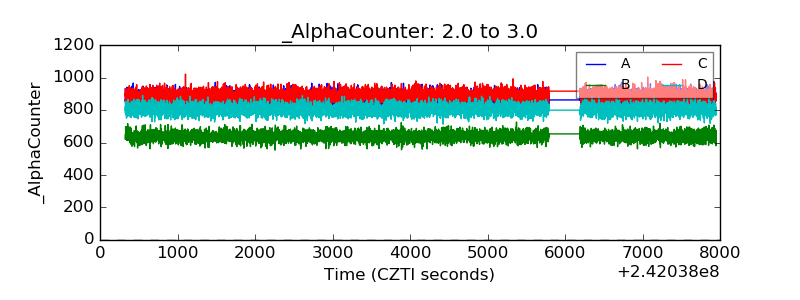 |
| _CPM_Rate | 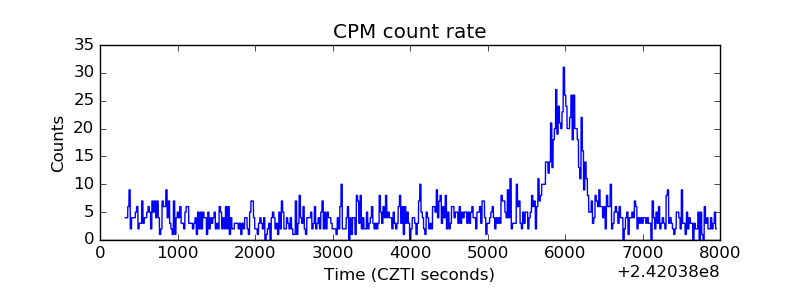 |
| CZT Counter | 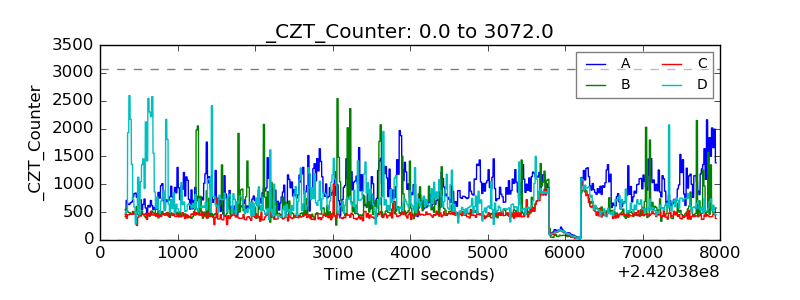 |
| +2.5 Volts monitor |  |
| +5 Volts monitor |  |
| _ROLL_ROT | 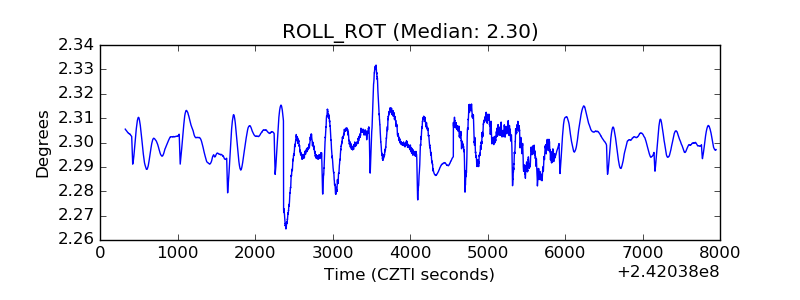 |
| _Roll_DEC | 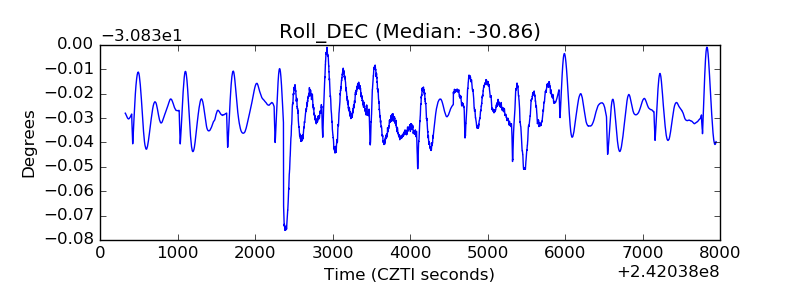 |
| _Roll_RA | 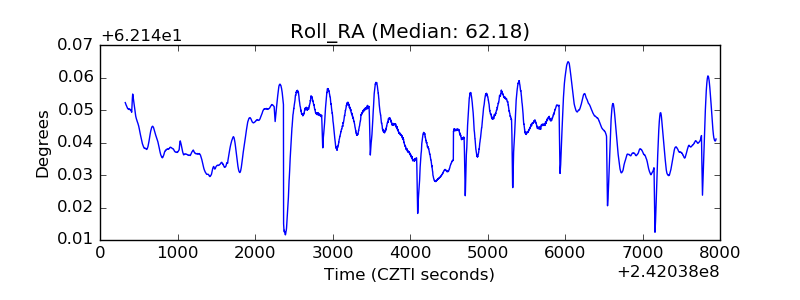 |
| Veto Counter | 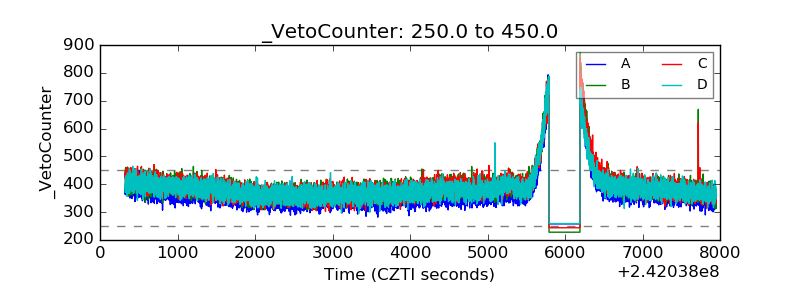 |