| Param | Original file | Final file |
|---|---|---|
| Filename | modeM0/AS1A03_126T01_9000001512_10440cztM0_level2.evt | modeM0/AS1A03_126T01_9000001512_10440cztM0_level2_quad_clean.evt |
| Size (bytes) | 416,004,480 | 61,611,840 |
| Size | 396.7 MB | 58.8 MB |
| Events in quadrant A | 3,250,817 | 326,764 |
| Events in quadrant B | 2,895,482 | 374,180 |
| Events in quadrant C | 2,606,834 | 391,952 |
| Events in quadrant D | 3,480,535 | 397,625 |
| Mode SS | |||
|---|---|---|---|
| Quadrant | BADHDUFLAG | Total packets | Discarded packets |
| A | 0 | 284 | 165 |
| B | 0 | 283 | 158 |
| C | 0 | 282 | 166 |
| D | 0 | 266 | 149 |
| Mode M0 | |||
|---|---|---|---|
| Quadrant | BADHDUFLAG | Total packets | Discarded packets |
| A | 0 | 44723 | 31965 |
| B | 0 | 33687 | 21699 |
| C | 0 | 29405 | 17639 |
| D | 0 | 34439 | 20309 |
| Mode M9 | |||
|---|---|---|---|
| Quadrant | BADHDUFLAG | Total packets | Discarded packets |
| A | 0 | 4 | 2 |
| B | 0 | 4 | 2 |
| C | 0 | 4 | 2 |
| D | 0 | 4 | 2 |
| Quadrant | Total seconds | Saturated seconds | Saturation percentage |
|---|---|---|---|
| A | 4373 | 154 | 3.521610% |
| B | 5373 | 147 | 2.735902% |
| C | 5690 | 78 | 1.370826% |
| D | 5919 | 93 | 1.571211% |
Noise dominated data is calculated using 1-second bins in cleaned event files. If a bin has >2000 counts, and if more than 50% of those come from <1% of pixels, then it is considered to be noise-dominated and hence unusable.
| Quadrant | # 1 sec bins | Bins with >0 counts | Bins with >2000 counts | High rate bins dominated by noise | Noise dominated (total time) | Noise dominated (detector-on time) | Marked lightcurve |
|---|---|---|---|---|---|---|---|
| A | 7516 | 5463 | 2 | 2 | 0.03% | 0.04% | 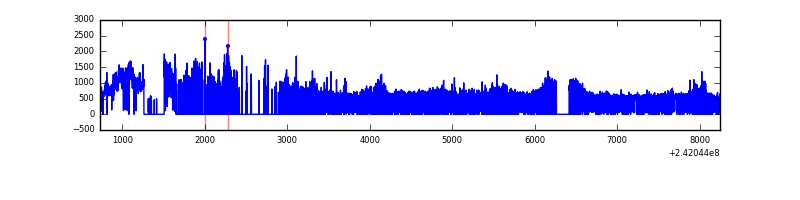 |
| B | 7517 | 6508 | 10 | 10 | 0.13% | 0.15% | 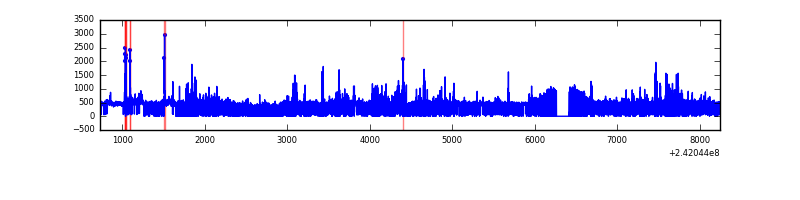 |
| C | 7517 | 6766 | 0 | 0 | 0.00% | 0.00% | 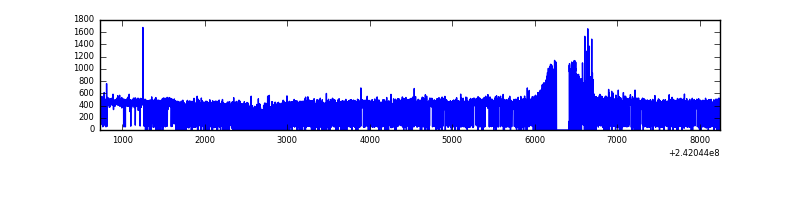 |
| D | 7517 | 6714 | 3 | 3 | 0.04% | 0.04% | 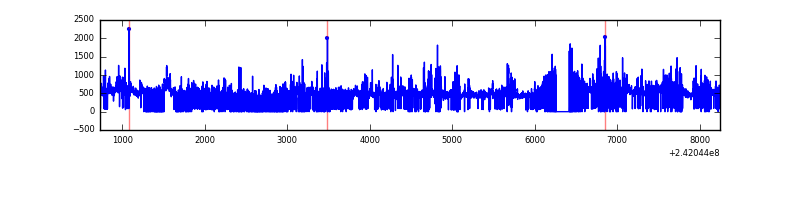 |
Top three noisy pixels from each quadrant. If the there are fewer than three noisy pixels in the level2.evt file, extra rows are filled as -1
| Pixel properties | Quadrant properties | ||||||
|---|---|---|---|---|---|---|---|
| Quadrant | DetID | PixID | Counts | Sigma | Mean | Median | Sigma |
| A | 13 | 251 | 1133159 | 10397.89 | 524 | 511 | 108.9 |
| A | 3 | 80 | 75704 | 690.28 | 524 | 511 | 108.9 |
| A | 8 | 5 | 8342 | 71.89 | 524 | 511 | 108.9 |
| B | 4 | 239 | 260016 | 2096.29 | 638 | 622 | 123.7 |
| B | 11 | 51 | 68026 | 544.72 | 638 | 622 | 123.7 |
| B | 0 | 214 | 48532 | 387.18 | 638 | 622 | 123.7 |
| C | 14 | 234 | 20395 | 127.29 | 662 | 663 | 155.0 |
| C | 13 | 61 | 4888 | 27.25 | 662 | 663 | 155.0 |
| C | 14 | 67 | 4324 | 23.62 | 662 | 663 | 155.0 |
| D | 8 | 195 | 274777 | 1654.1 | 684 | 665 | 165.7 |
| D | 1 | 52 | 261547 | 1574.27 | 684 | 665 | 165.7 |
| D | 1 | 20 | 198495 | 1193.79 | 684 | 665 | 165.7 |
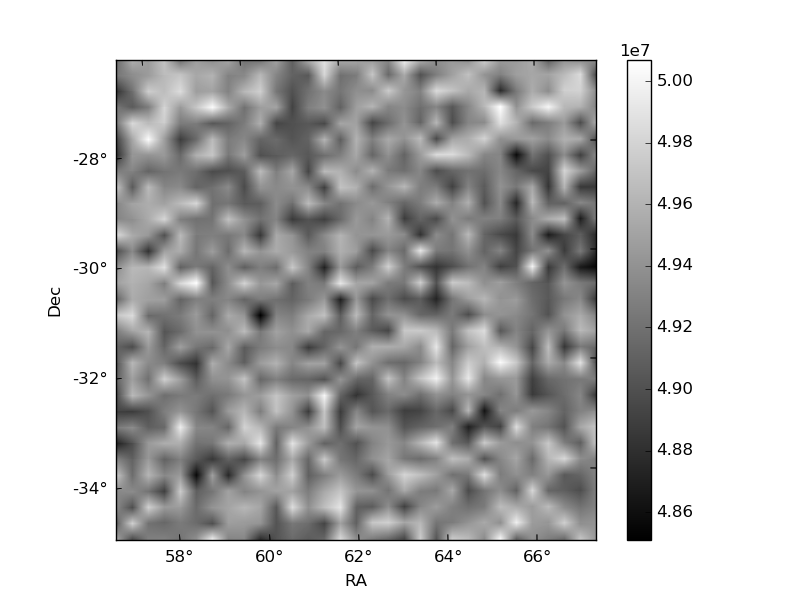
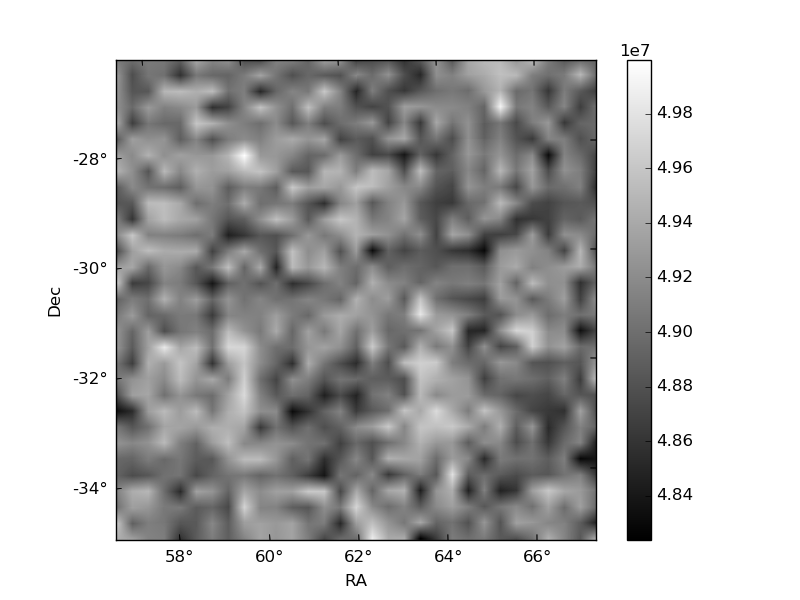
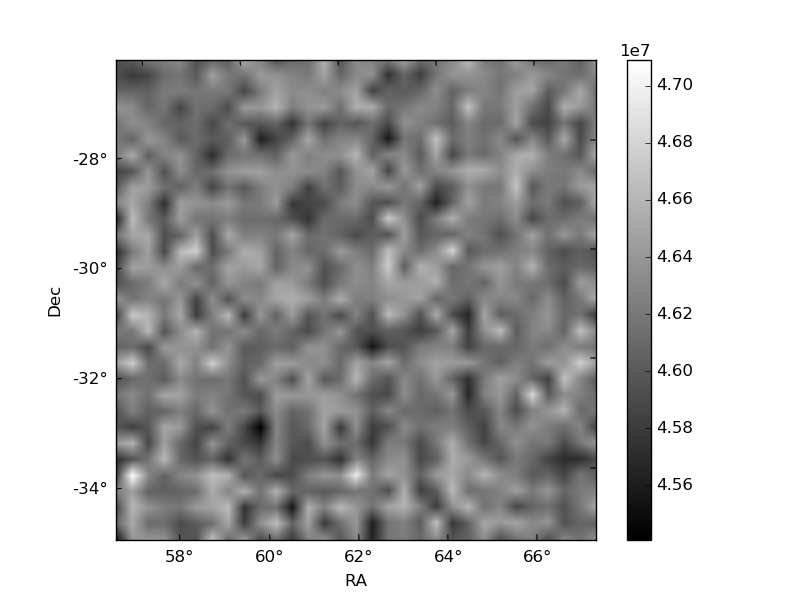
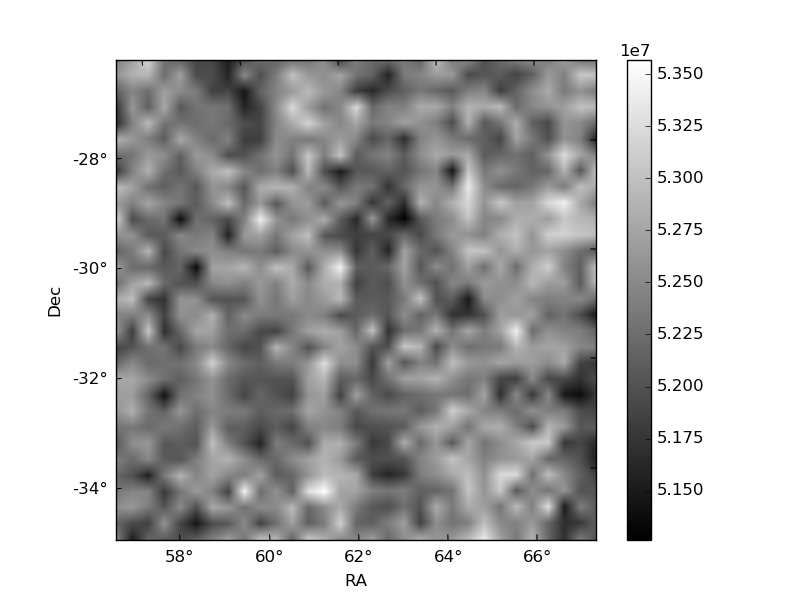
Histogram calculated using DETX and DETY for each event in the final _common_clean file
| Quadrant A | 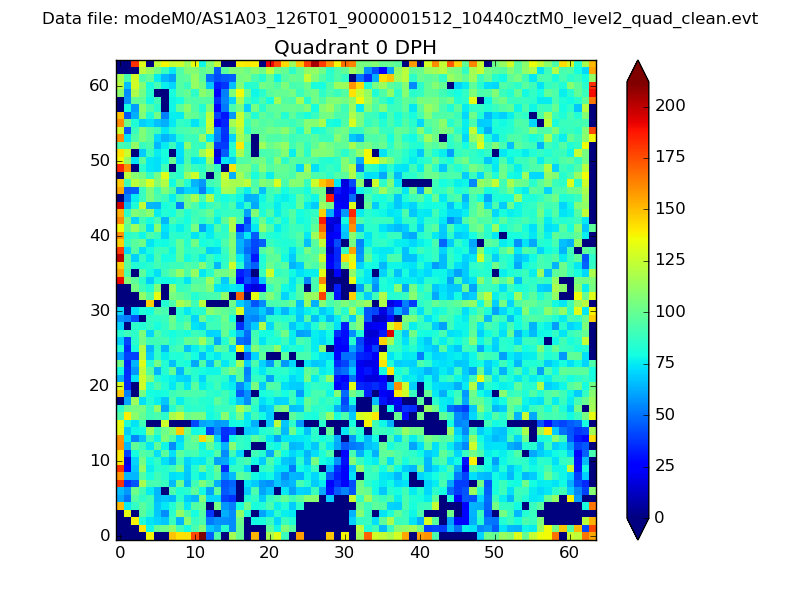 |
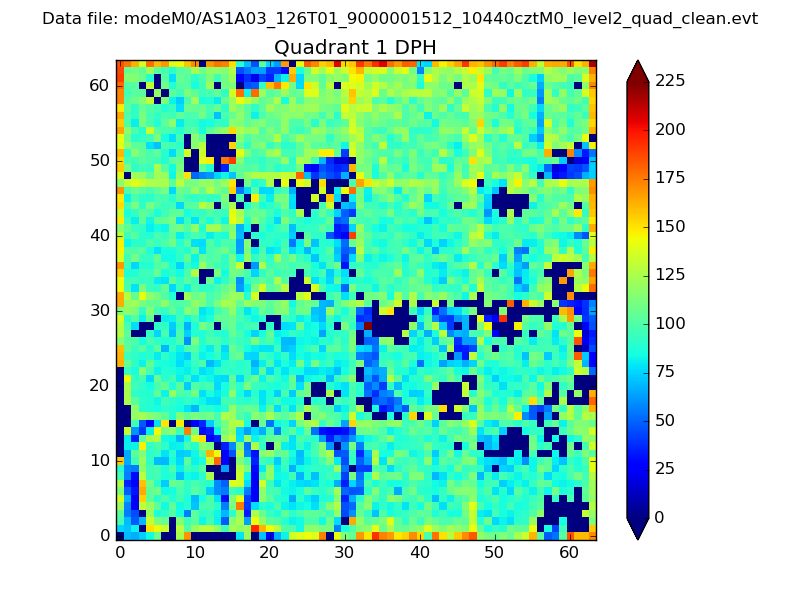 |
Quadrant B |
|---|---|---|---|
| Quadrant D |  |
 |
Quadrant C |
| Plot type | Count rate plots | Images |
|---|---|---|
| Comparison with Poisson distribution Blue bars denote a histogram of data divided into 1 sec bins. Red curve is a Poisson curve with rate = median count rate of data. |
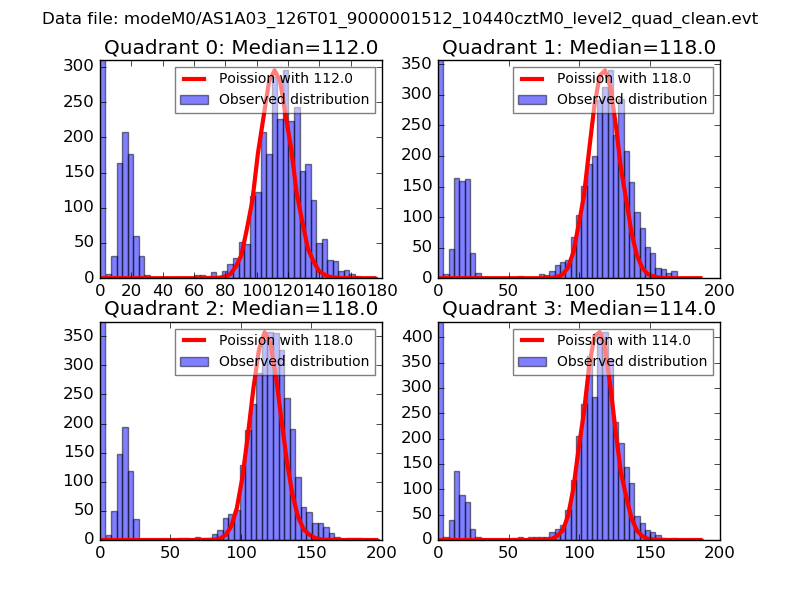 |
 |
| Quadrant-wise count rates Data is divided into 100 sec bins |
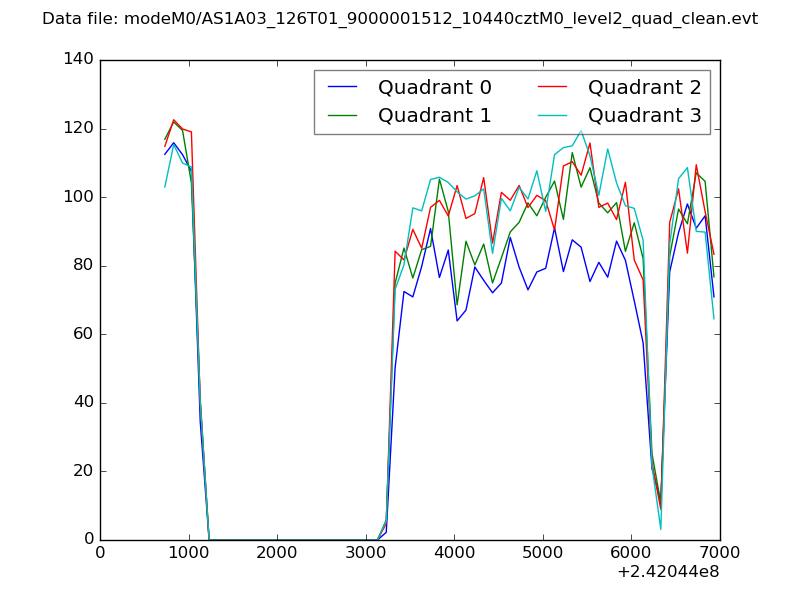 |
|
| Module-wise count rates for Quadrant A Data is divided into 100 sec bins |
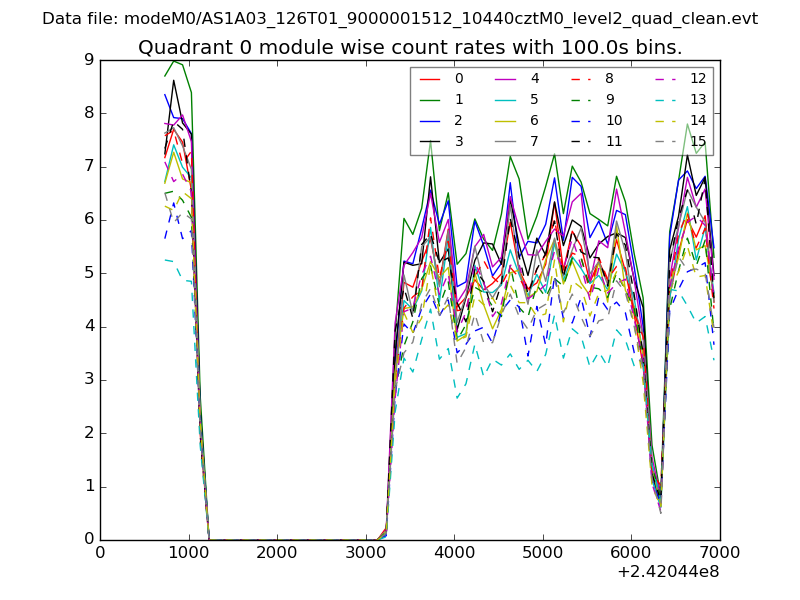 |
 |
| Module-wise count rates for Quadrant B Data is divided into 100 sec bins |
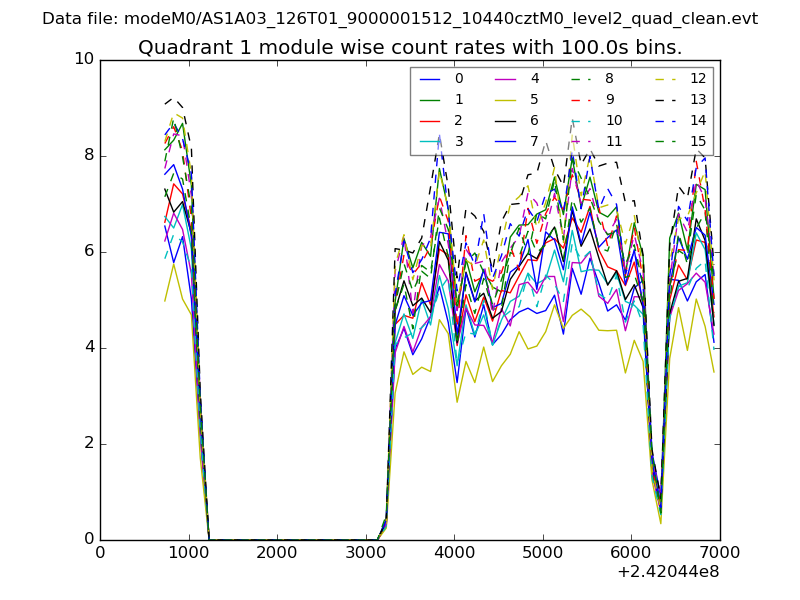 |
 |
| Module-wise count rates for Quadrant C Data is divided into 100 sec bins |
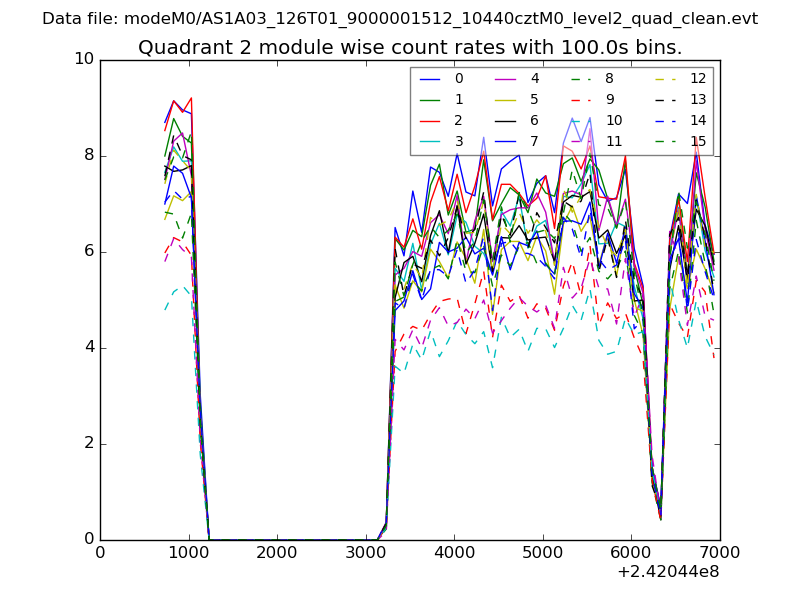 |
 |
| Module-wise count rates for Quadrant D Data is divided into 100 sec bins |
 |
 |
| Parameter | Plot |
|---|---|
| CZT HV Monitor | 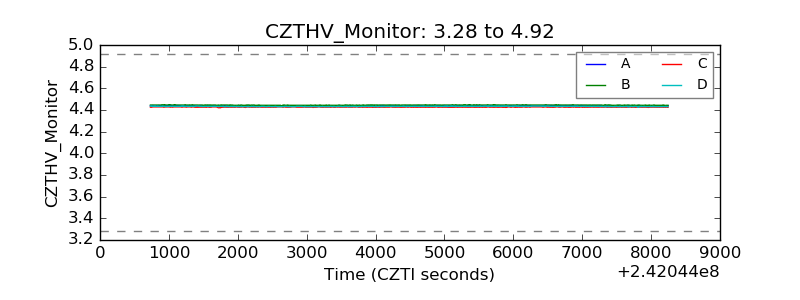 |
| D_VDD | 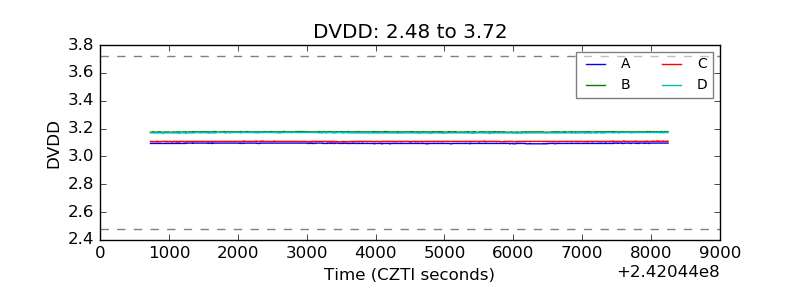 |
| Temperature 1 | 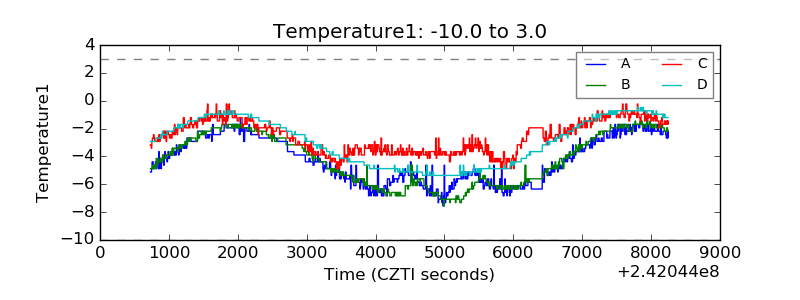 |
| Veto HV Monitor | 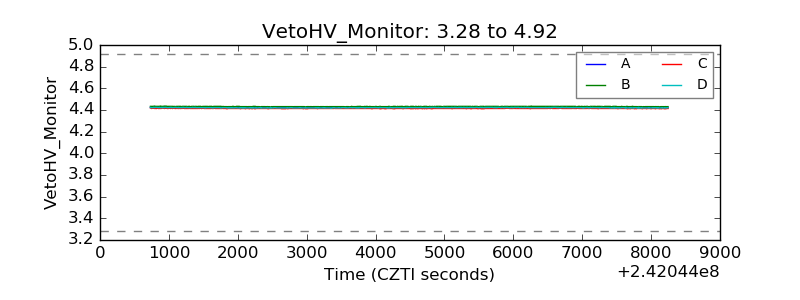 |
| Veto LLD | 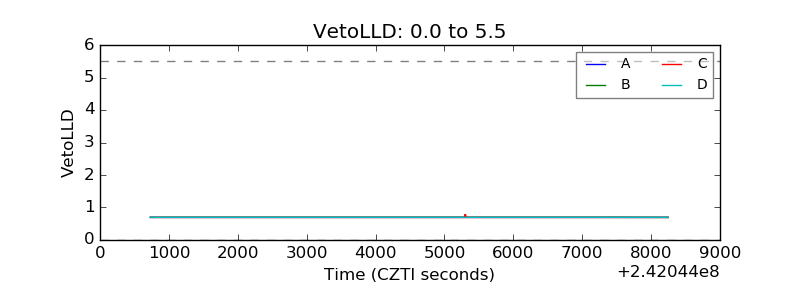 |
| Alpha Counter | 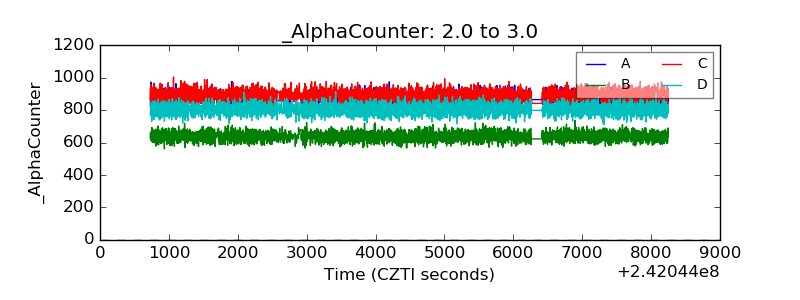 |
| _CPM_Rate | 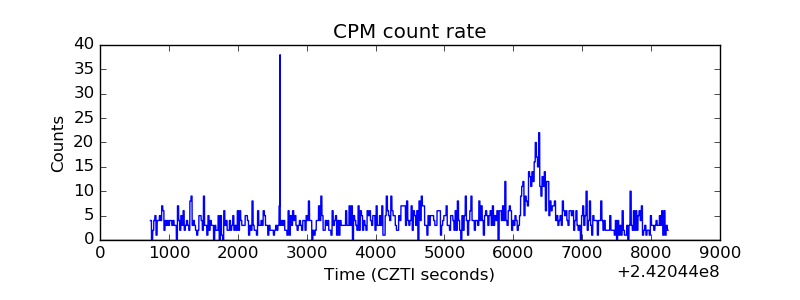 |
| CZT Counter |  |
| +2.5 Volts monitor |  |
| +5 Volts monitor | 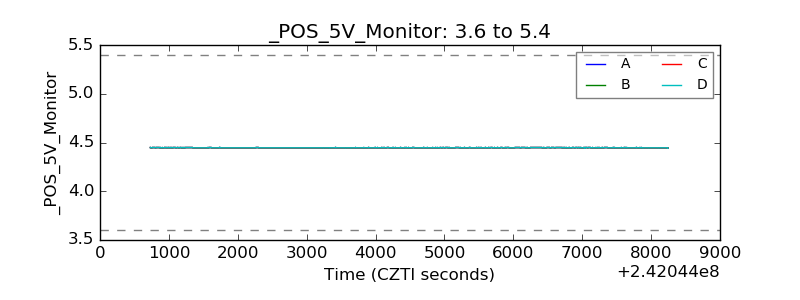 |
| _ROLL_ROT | 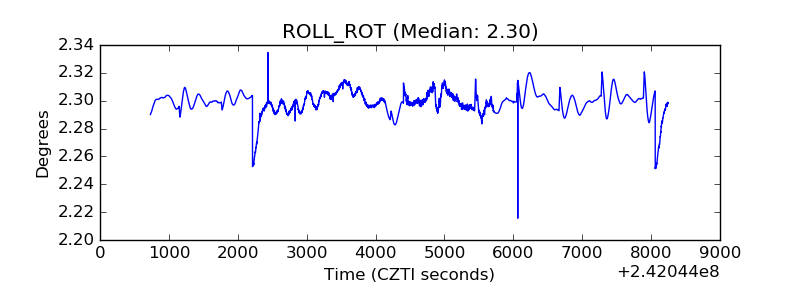 |
| _Roll_DEC | 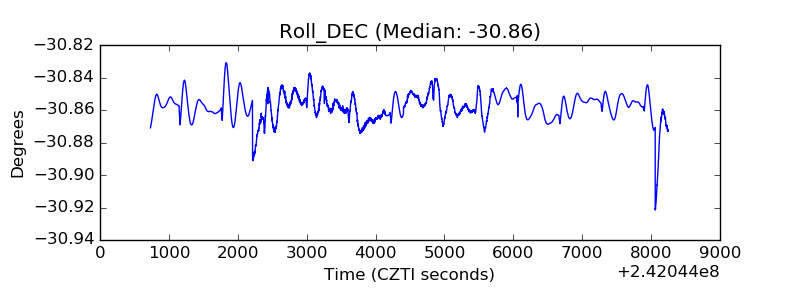 |
| _Roll_RA | 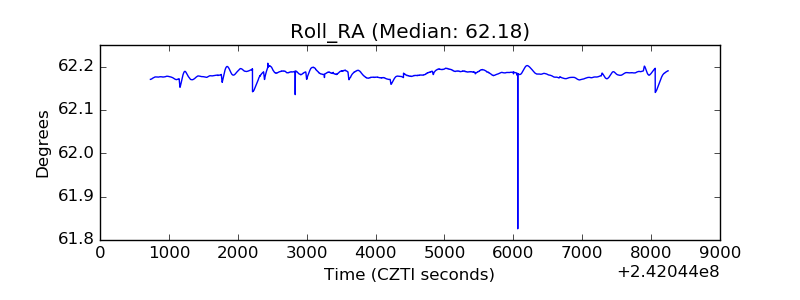 |
| Veto Counter | 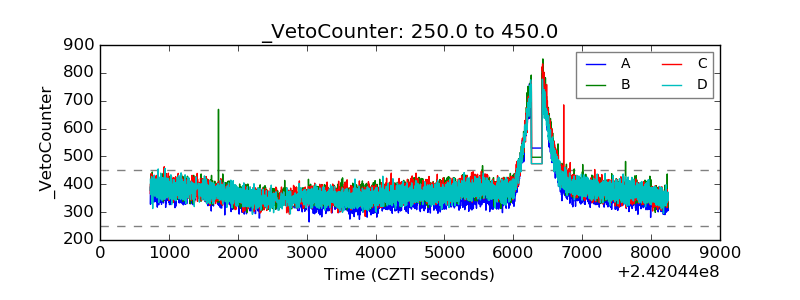 |