| Param | Original file | Final file |
|---|---|---|
| Filename | modeM0/AS1A03_126T01_9000001512_10441cztM0_level2.evt | modeM0/AS1A03_126T01_9000001512_10441cztM0_level2_quad_clean.evt |
| Size (bytes) | 380,410,560 | 47,871,360 |
| Size | 362.8 MB | 45.7 MB |
| Events in quadrant A | 2,790,391 | 252,804 |
| Events in quadrant B | 2,632,923 | 277,423 |
| Events in quadrant C | 2,494,719 | 296,090 |
| Events in quadrant D | 3,257,688 | 268,949 |
| Mode SS | |||
|---|---|---|---|
| Quadrant | BADHDUFLAG | Total packets | Discarded packets |
| A | 0 | 307 | 189 |
| B | 0 | 309 | 179 |
| C | 0 | 306 | 194 |
| D | 0 | 299 | 176 |
| Mode M0 | |||
|---|---|---|---|
| Quadrant | BADHDUFLAG | Total packets | Discarded packets |
| A | 0 | 41428 | 30327 |
| B | 0 | 37264 | 26338 |
| C | 0 | 31501 | 20270 |
| D | 0 | 39616 | 26515 |
| Mode M9 | |||
|---|---|---|---|
| Quadrant | BADHDUFLAG | Total packets | Discarded packets |
| A | 0 | 4 | 2 |
| B | 0 | 4 | 2 |
| C | 0 | 4 | 2 |
| D | 0 | 4 | 2 |
| Quadrant | Total seconds | Saturated seconds | Saturation percentage |
|---|---|---|---|
| A | 4400 | 111 | 2.522727% |
| B | 4942 | 101 | 2.043707% |
| C | 5393 | 74 | 1.372149% |
| D | 5265 | 93 | 1.766382% |
Noise dominated data is calculated using 1-second bins in cleaned event files. If a bin has >2000 counts, and if more than 50% of those come from <1% of pixels, then it is considered to be noise-dominated and hence unusable.
| Quadrant | # 1 sec bins | Bins with >0 counts | Bins with >2000 counts | High rate bins dominated by noise | Noise dominated (total time) | Noise dominated (detector-on time) | Marked lightcurve |
|---|---|---|---|---|---|---|---|
| A | 7953 | 5669 | 4 | 4 | 0.05% | 0.07% | 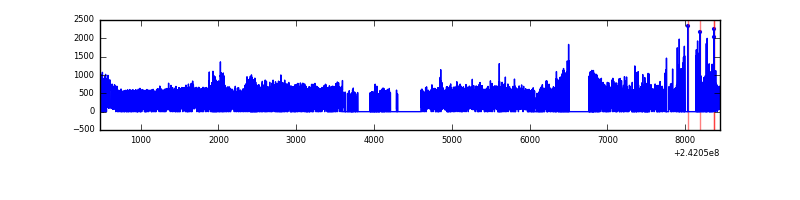 |
| B | 7970 | 6049 | 1 | 1 | 0.01% | 0.02% | 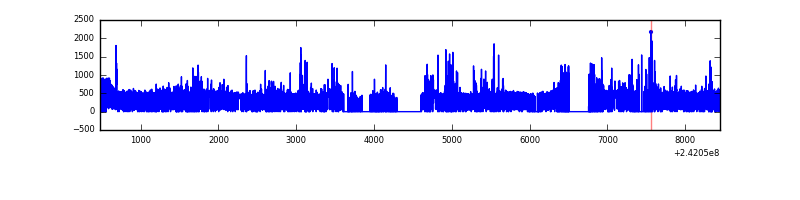 |
| C | 7946 | 6520 | 2 | 2 | 0.03% | 0.03% | 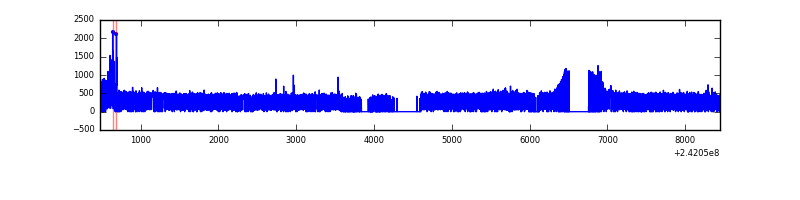 |
| D | 7950 | 6152 | 6 | 6 | 0.08% | 0.10% | 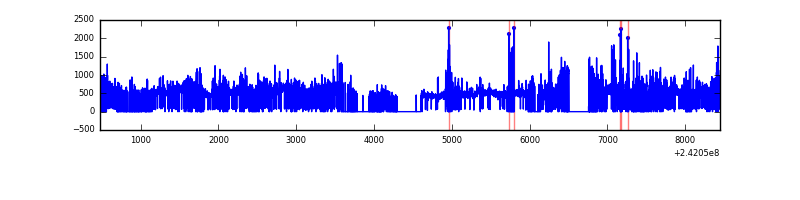 |
Top three noisy pixels from each quadrant. If the there are fewer than three noisy pixels in the level2.evt file, extra rows are filled as -1
| Pixel properties | Quadrant properties | ||||||
|---|---|---|---|---|---|---|---|
| Quadrant | DetID | PixID | Counts | Sigma | Mean | Median | Sigma |
| A | 13 | 251 | 656772 | 5930.11 | 528 | 514 | 110.7 |
| A | 3 | 80 | 74635 | 669.78 | 528 | 514 | 110.7 |
| A | 14 | 254 | 10031 | 86.0 | 528 | 514 | 110.7 |
| B | 4 | 239 | 211591 | 1818.25 | 589 | 574 | 116.1 |
| B | 0 | 214 | 34356 | 291.09 | 589 | 574 | 116.1 |
| B | 11 | 51 | 31428 | 265.86 | 589 | 574 | 116.1 |
| C | 14 | 234 | 31347 | 207.38 | 630 | 634 | 148.1 |
| C | 13 | 61 | 4697 | 27.43 | 630 | 634 | 148.1 |
| C | 14 | 67 | 2387 | 11.84 | 630 | 634 | 148.1 |
| D | 1 | 20 | 306248 | 2021.18 | 615 | 596 | 151.2 |
| D | 8 | 195 | 294427 | 1943.01 | 615 | 596 | 151.2 |
| D | 1 | 52 | 119390 | 785.55 | 615 | 596 | 151.2 |
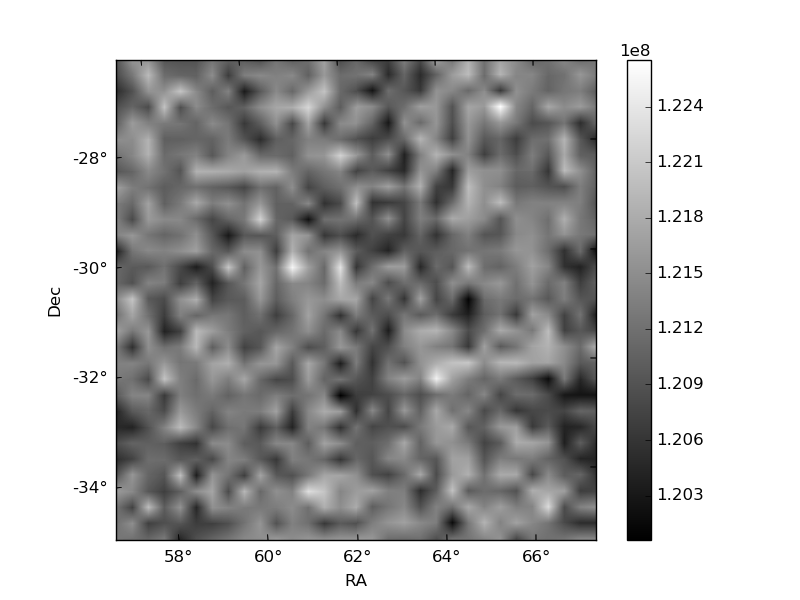
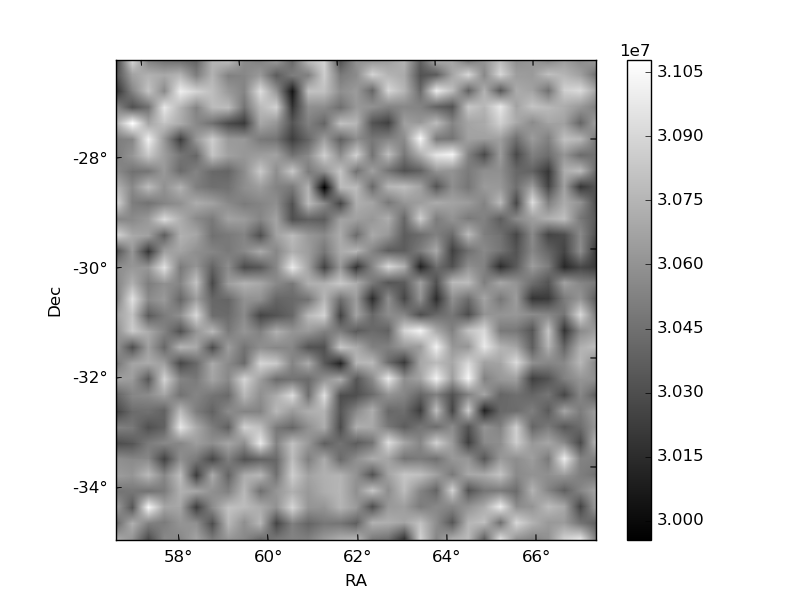
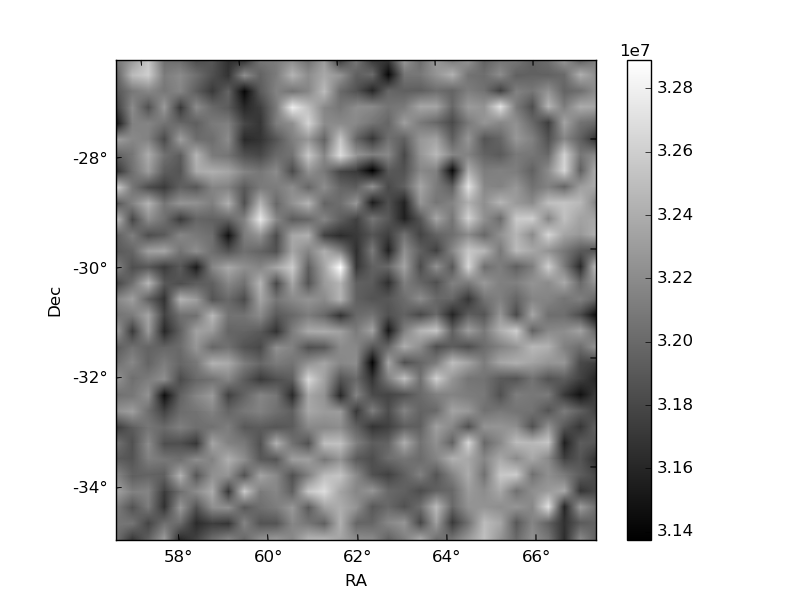
Histogram calculated using DETX and DETY for each event in the final _common_clean file
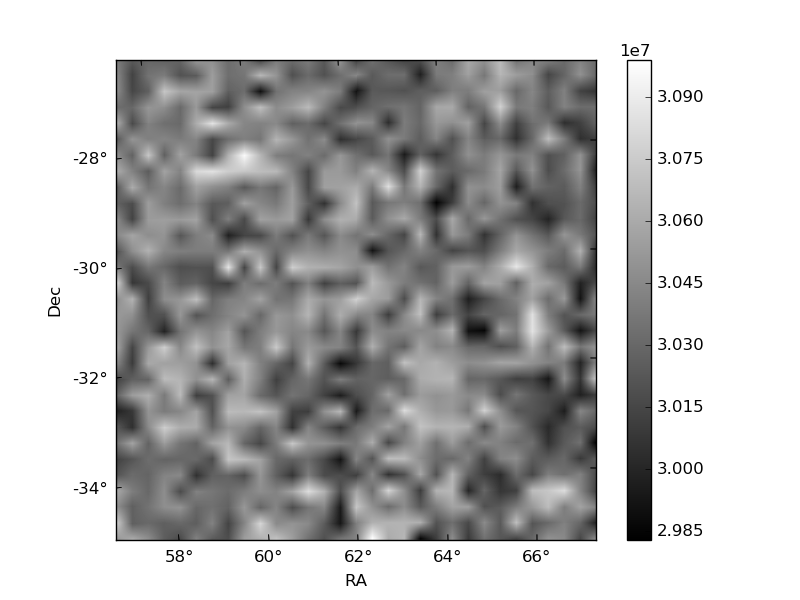
| Quadrant A | 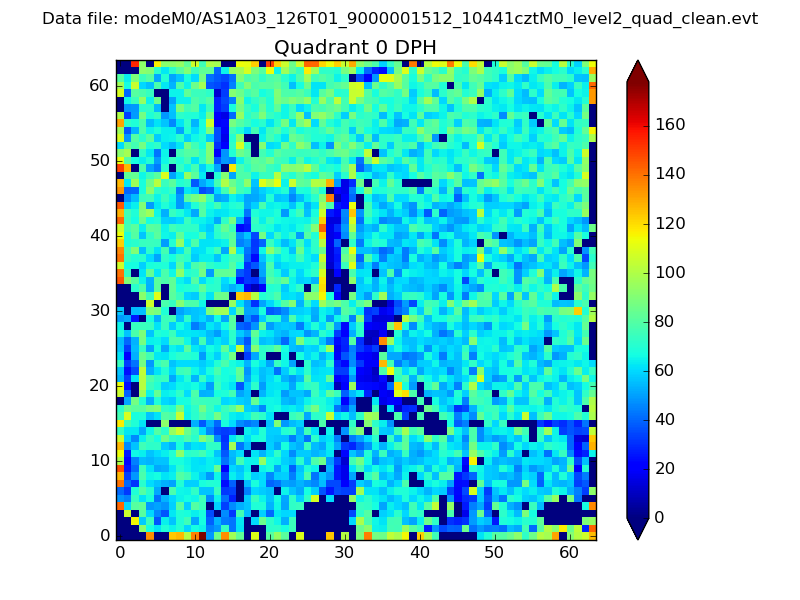 |
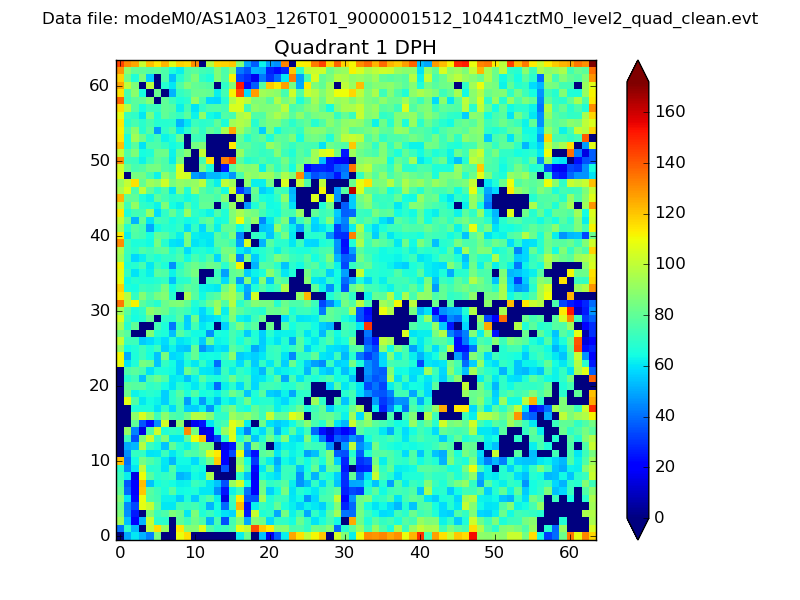 |
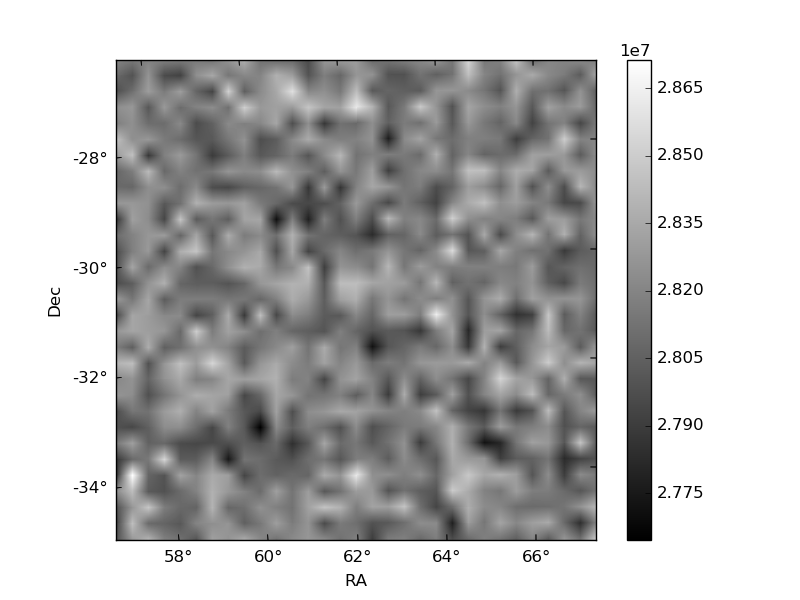
Quadrant B |
|---|---|---|---|
| Quadrant D | 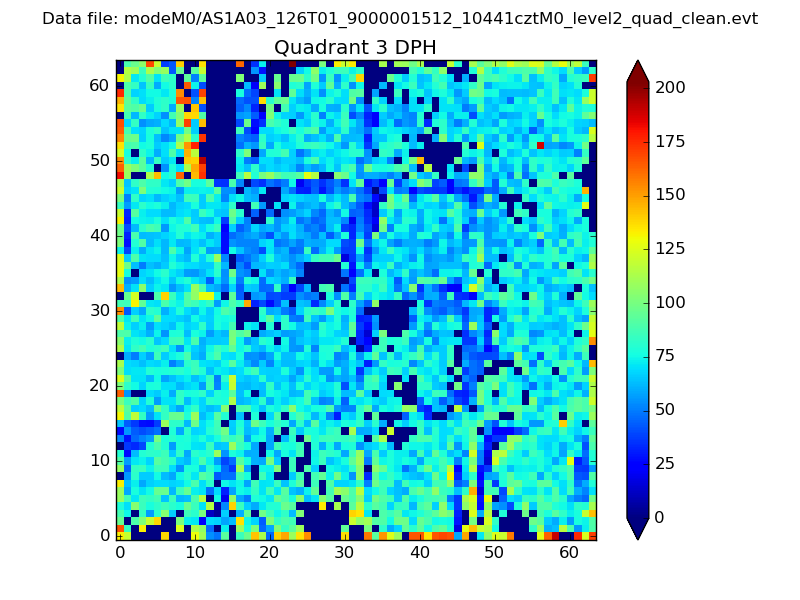 |
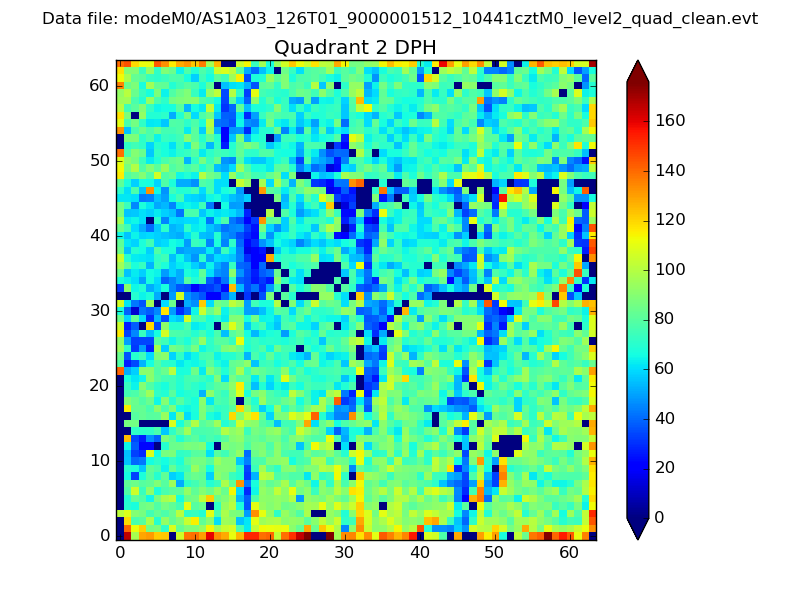 |
Quadrant C |
| Plot type | Count rate plots | Images |
|---|---|---|
| Comparison with Poisson distribution Blue bars denote a histogram of data divided into 1 sec bins. Red curve is a Poisson curve with rate = median count rate of data. |
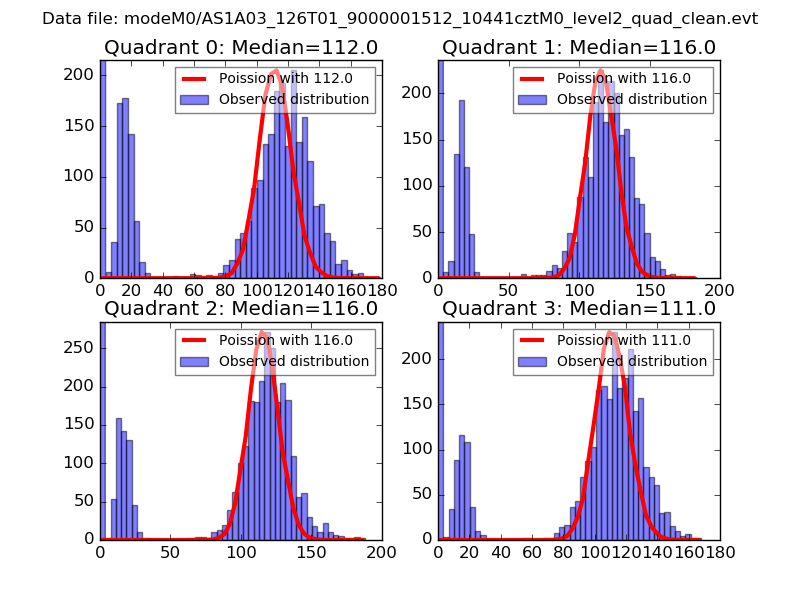 |
 |
| Quadrant-wise count rates Data is divided into 100 sec bins |
 |
|
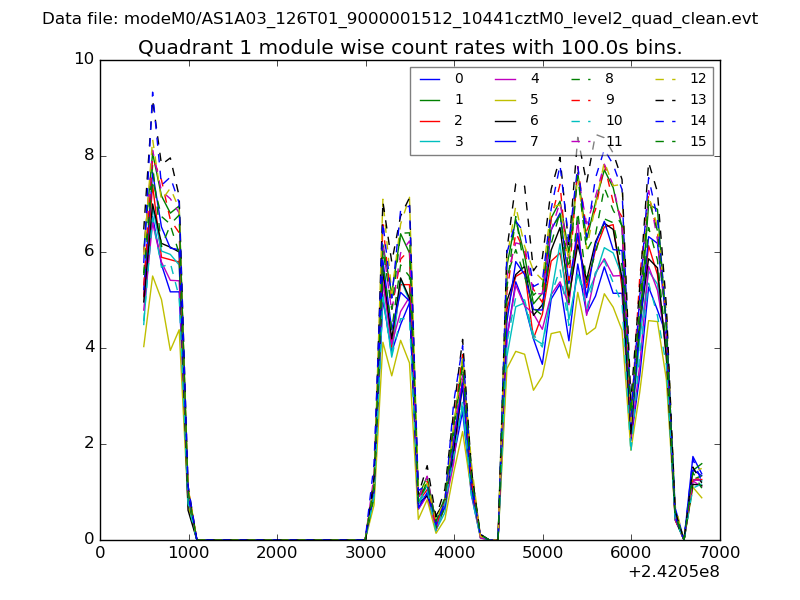
| Module-wise count rates for Quadrant A Data is divided into 100 sec bins |
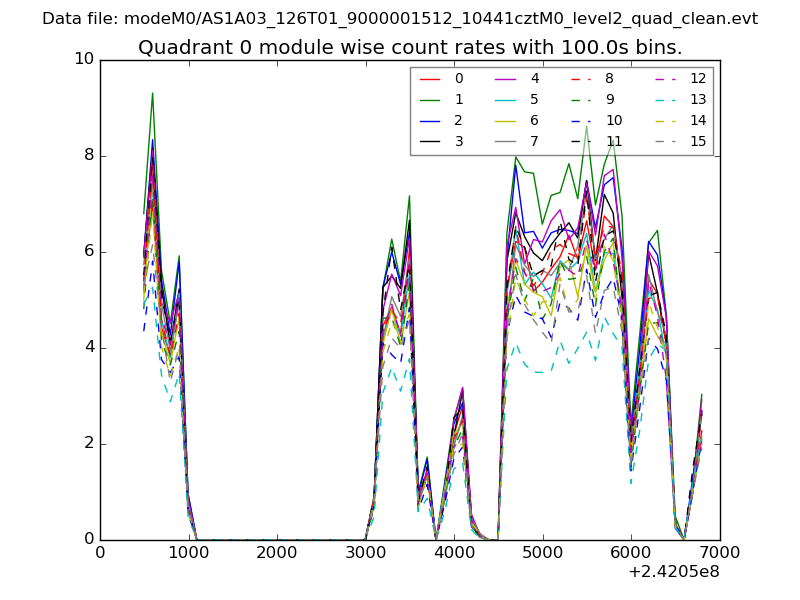 |
 |
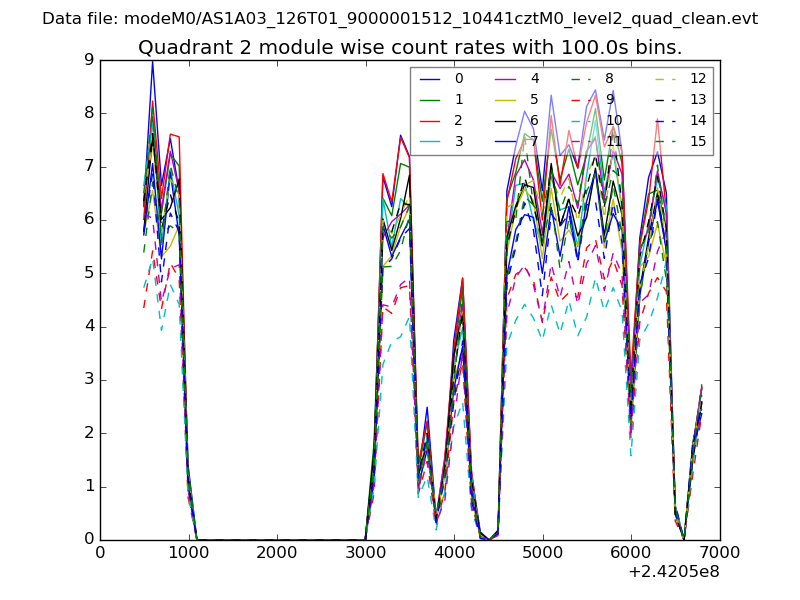
| Module-wise count rates for Quadrant B Data is divided into 100 sec bins |
 |
 |
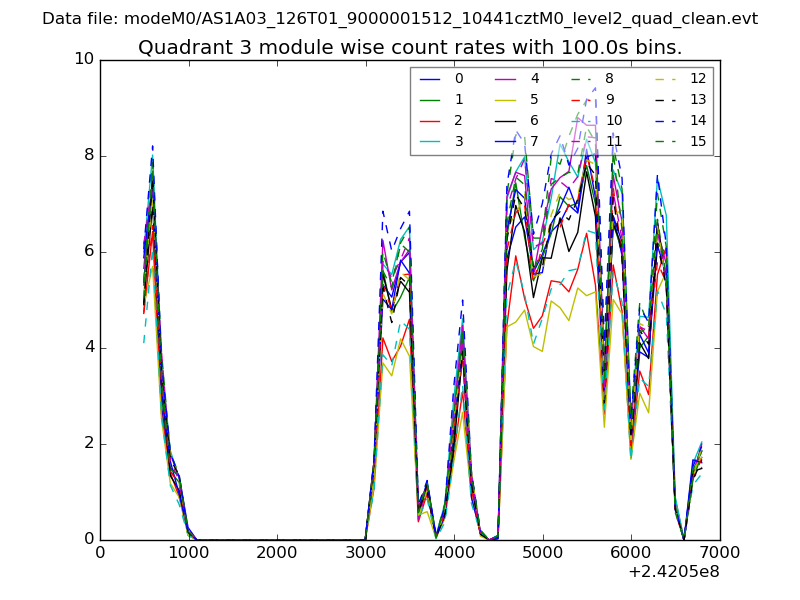
| Module-wise count rates for Quadrant C Data is divided into 100 sec bins |
 |
 |
| Module-wise count rates for Quadrant D Data is divided into 100 sec bins |
 |
 |
| Parameter | Plot |
|---|---|
| CZT HV Monitor | 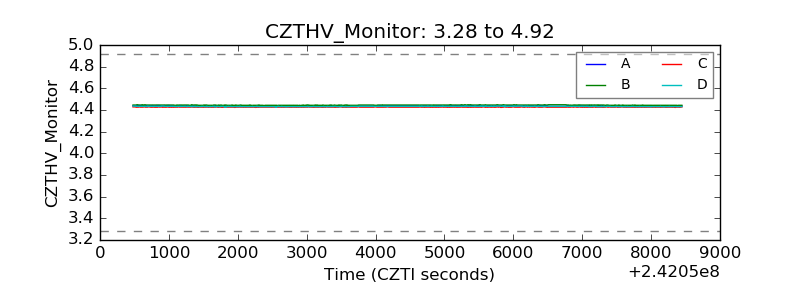 |
| D_VDD | 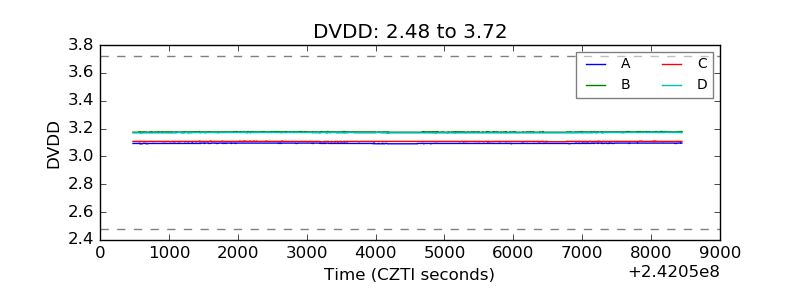 |
| Temperature 1 |  |
| Veto HV Monitor | 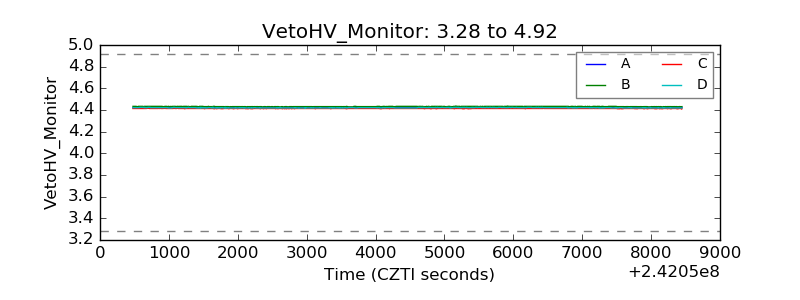 |
| Veto LLD | 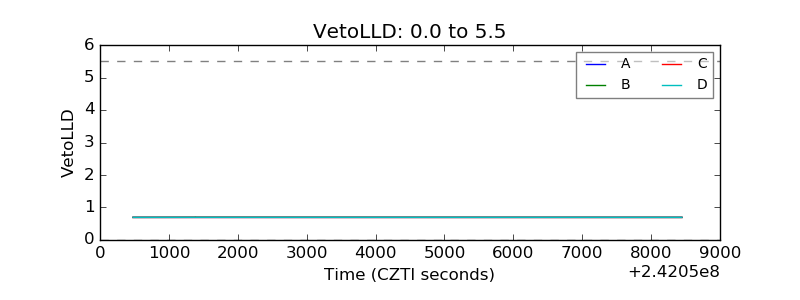 |
| Alpha Counter | 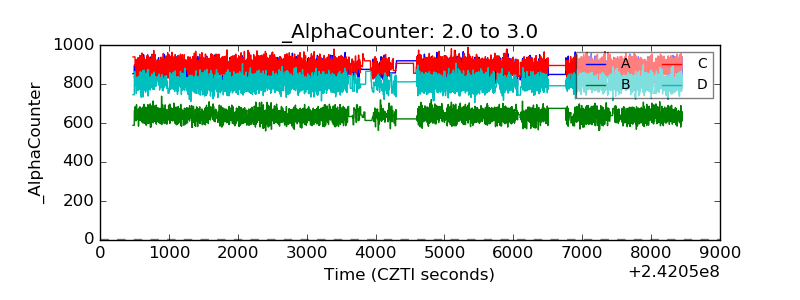 |
| _CPM_Rate | 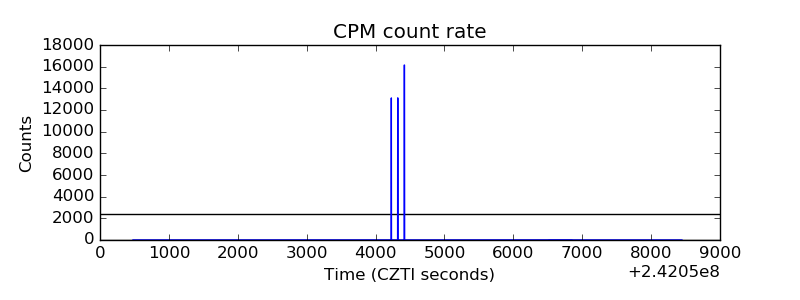 |
| CZT Counter |  |
| +2.5 Volts monitor |  |
| +5 Volts monitor |  |
| _ROLL_ROT | 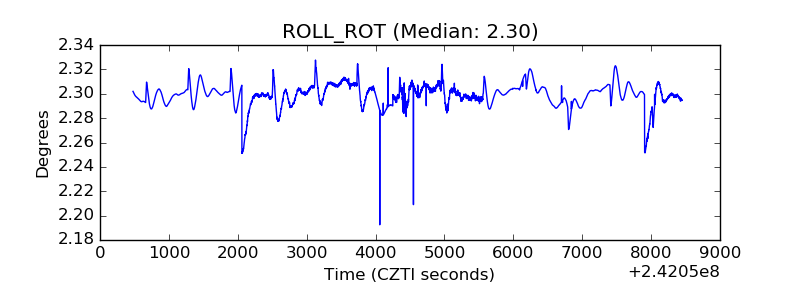 |
| _Roll_DEC | 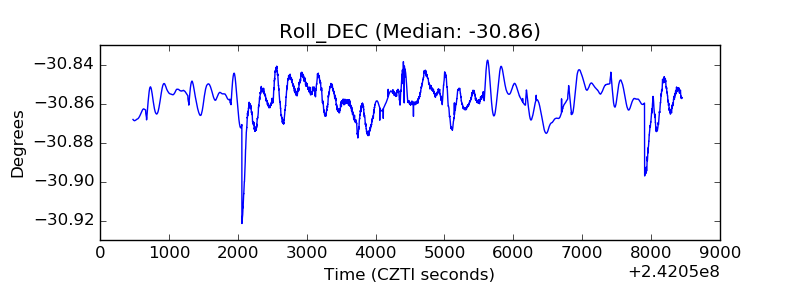 |
| _Roll_RA | 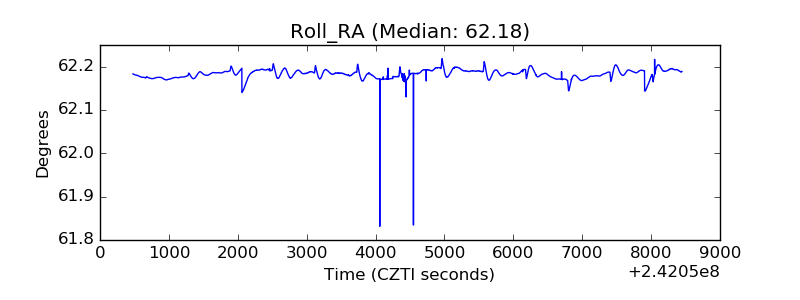 |
| Veto Counter | 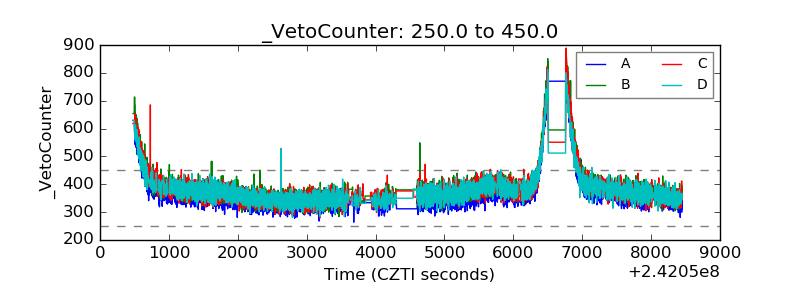 |