| Param | Original file | Final file |
|---|---|---|
| Filename | modeM0/AS1A03_126T01_9000001512_10448cztM0_level2.evt | modeM0/AS1A03_126T01_9000001512_10448cztM0_level2_quad_clean.evt |
| Size (bytes) | 2,813,224,320 | 404,925,120 |
| Size | 2.6 GB | 386.2 MB |
| Events in quadrant A | 30,399,525 | 2,388,958 |
| Events in quadrant B | 18,815,892 | 2,605,064 |
| Events in quadrant C | 14,709,612 | 2,601,775 |
| Events in quadrant D | 19,105,327 | 2,454,700 |
| Mode SS | |||
|---|---|---|---|
| Quadrant | BADHDUFLAG | Total packets | Discarded packets |
| A | 0 | 680 | 20 |
| B | 0 | 680 | 18 |
| C | 0 | 680 | 24 |
| D | 0 | 680 | 24 |
| Mode M0 | |||
|---|---|---|---|
| Quadrant | BADHDUFLAG | Total packets | Discarded packets |
| A | 0 | 126187 | 14142 |
| B | 0 | 80774 | 3599 |
| C | 0 | 69211 | 2617 |
| D | 0 | 80687 | 2931 |
| Mode M9 | |||
|---|---|---|---|
| Quadrant | BADHDUFLAG | Total packets | Discarded packets |
| A | 0 | 40 | 3 |
| B | 0 | 40 | 7 |
| C | 0 | 40 | 6 |
| D | 0 | 41 | 3 |
| Quadrant | Total seconds | Saturated seconds | Saturation percentage |
|---|---|---|---|
| A | 31827 | 4808 | 15.106670% |
| B | 32261 | 1355 | 4.200118% |
| C | 32294 | 392 | 1.213848% |
| D | 32315 | 700 | 2.166177% |
Noise dominated data is calculated using 1-second bins in cleaned event files. If a bin has >2000 counts, and if more than 50% of those come from <1% of pixels, then it is considered to be noise-dominated and hence unusable.
| Quadrant | # 1 sec bins | Bins with >0 counts | Bins with >2000 counts | High rate bins dominated by noise | Noise dominated (total time) | Noise dominated (detector-on time) | Marked lightcurve |
|---|---|---|---|---|---|---|---|
| A | 51681 | 31901 | 4098 | 4098 | 7.93% | 12.85% | 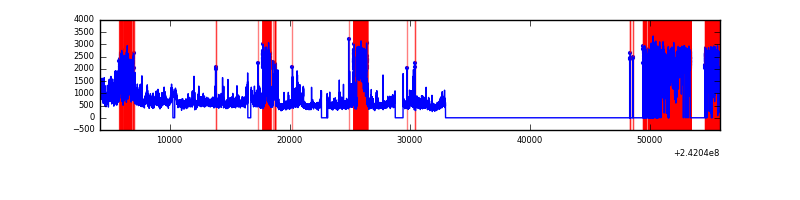 |
| B | 51681 | 32516 | 554 | 554 | 1.07% | 1.70% | 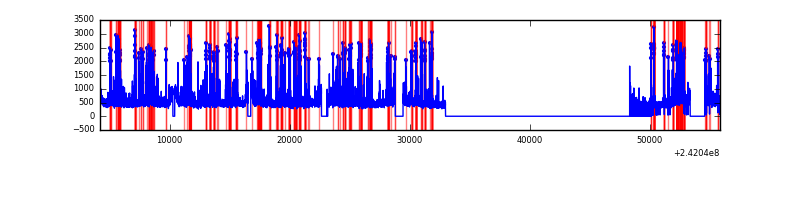 |
| C | 51681 | 32603 | 6 | 6 | 0.01% | 0.02% | 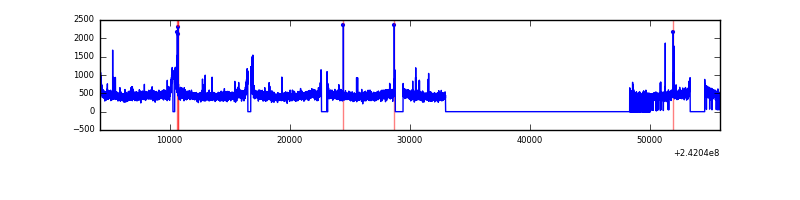 |
| D | 51681 | 32639 | 255 | 255 | 0.49% | 0.78% | 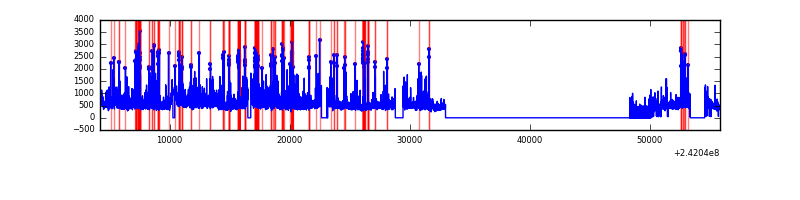 |
Top three noisy pixels from each quadrant. If the there are fewer than three noisy pixels in the level2.evt file, extra rows are filled as -1
| Pixel properties | Quadrant properties | ||||||
|---|---|---|---|---|---|---|---|
| Quadrant | DetID | PixID | Counts | Sigma | Mean | Median | Sigma |
| A | 13 | 251 | 15763926 | 21639.9 | 3580 | 3496 | 728.3 |
| A | 3 | 80 | 531934 | 725.57 | 3580 | 3496 | 728.3 |
| A | 15 | 223 | 104938 | 139.29 | 3580 | 3496 | 728.3 |
| B | 4 | 239 | 3234422 | 4484.87 | 3789 | 3700 | 720.4 |
| B | 11 | 51 | 281748 | 385.98 | 3789 | 3700 | 720.4 |
| B | 0 | 214 | 258194 | 353.29 | 3789 | 3700 | 720.4 |
| C | 14 | 234 | 86438 | 95.27 | 3744 | 3764 | 867.8 |
| C | 13 | 61 | 27715 | 27.6 | 3744 | 3764 | 867.8 |
| C | 14 | 67 | 23346 | 22.56 | 3744 | 3764 | 867.8 |
| D | 8 | 195 | 1535738 | 1709.43 | 3705 | 3607 | 896.3 |
| D | 1 | 20 | 1022841 | 1137.18 | 3705 | 3607 | 896.3 |
| D | 1 | 52 | 905679 | 1006.46 | 3705 | 3607 | 896.3 |
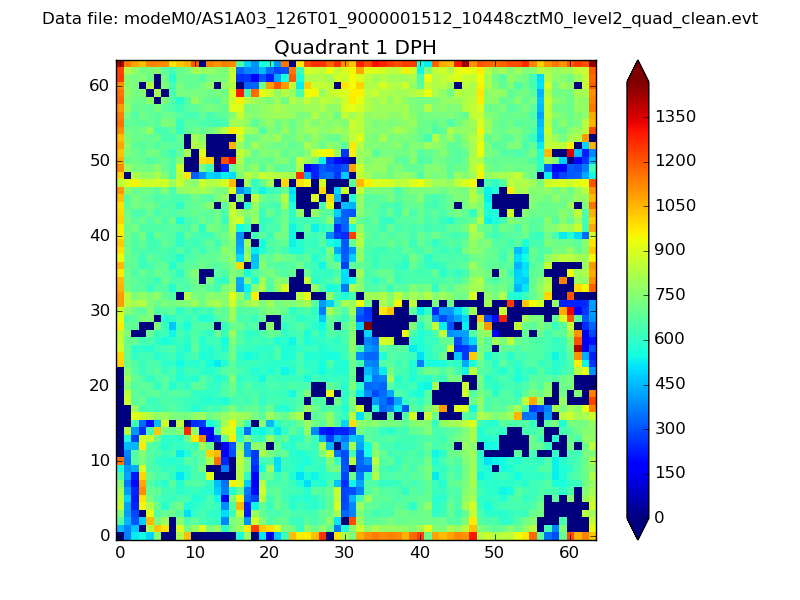
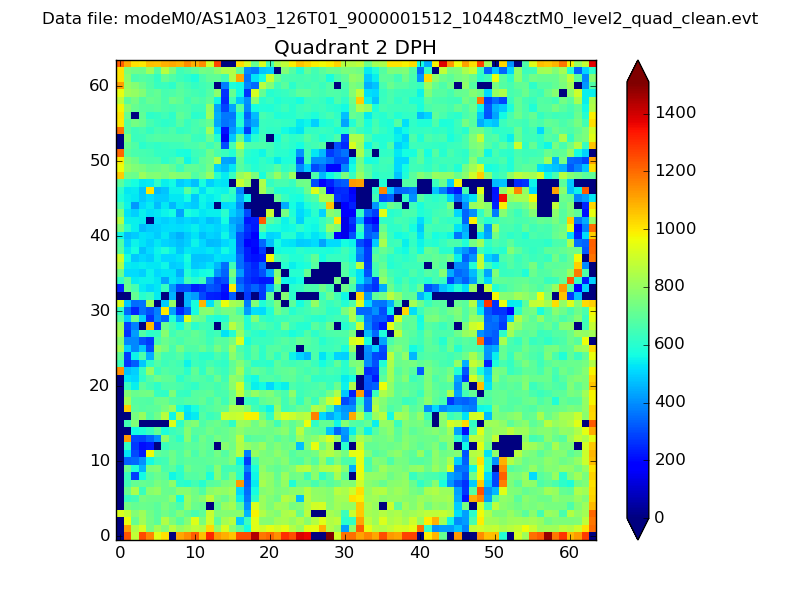
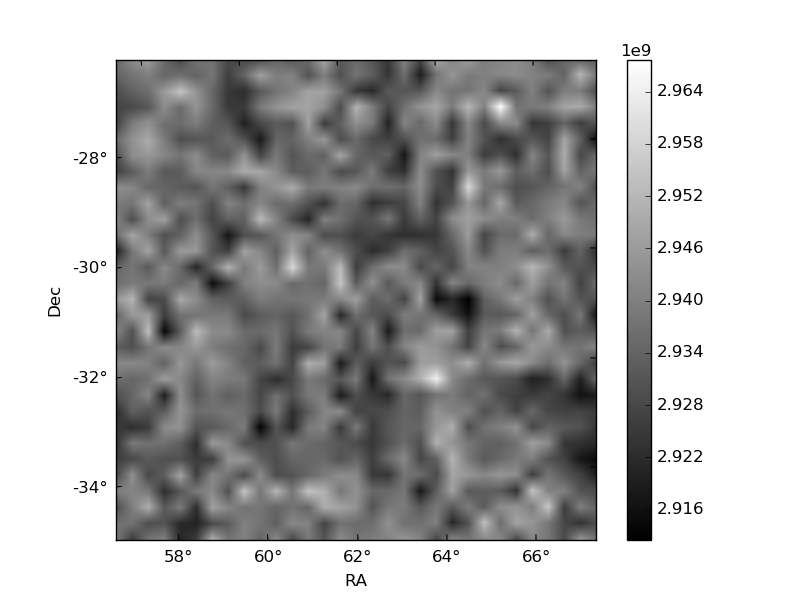
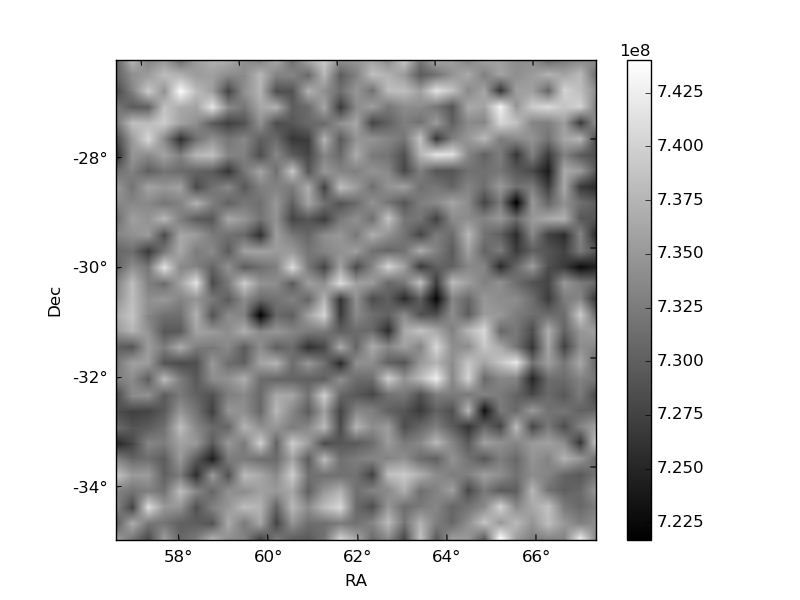
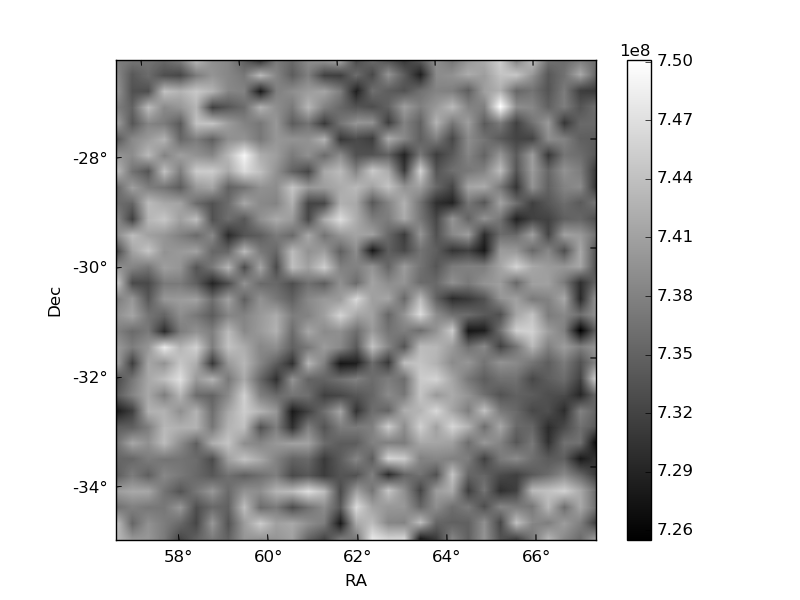
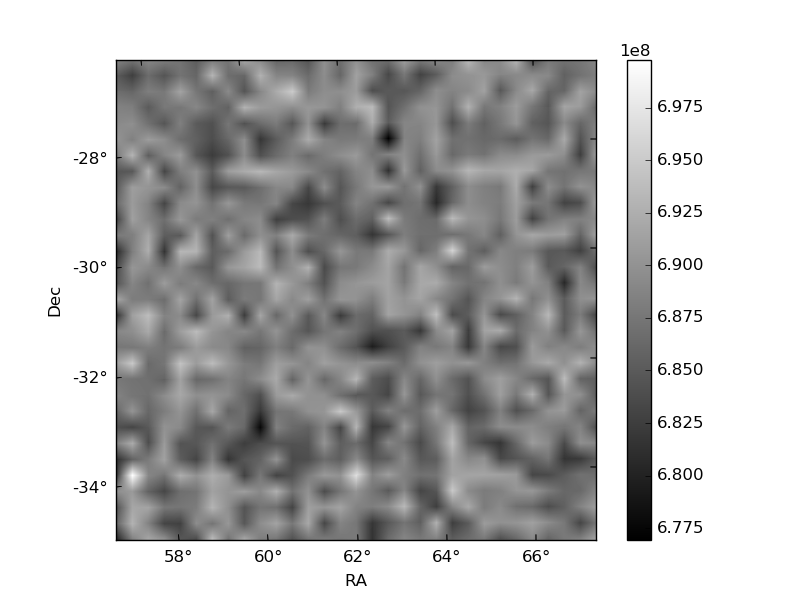
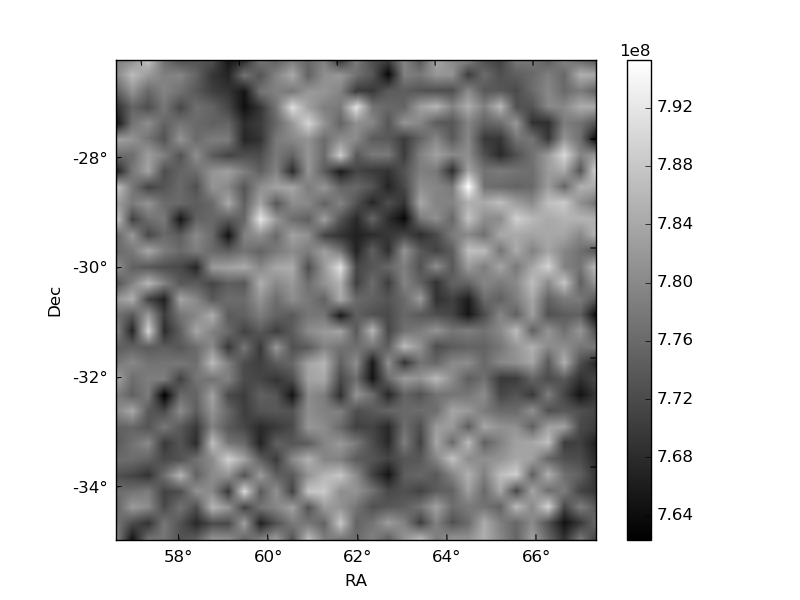
Histogram calculated using DETX and DETY for each event in the final _common_clean file
| Quadrant A |  |
 |
Quadrant B |
|---|---|---|---|
| Quadrant D | 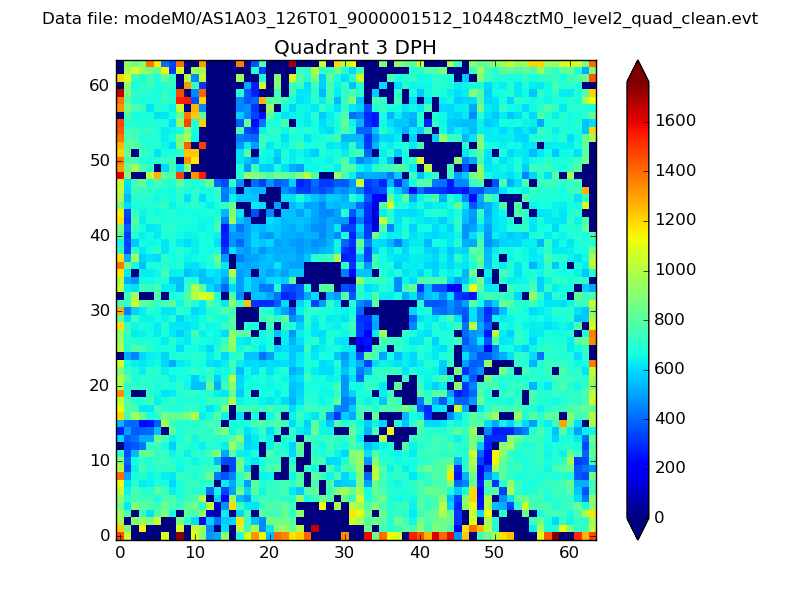 |
 |
Quadrant C |
| Plot type | Count rate plots | Images |
|---|---|---|
| Comparison with Poisson distribution Blue bars denote a histogram of data divided into 1 sec bins. Red curve is a Poisson curve with rate = median count rate of data. |
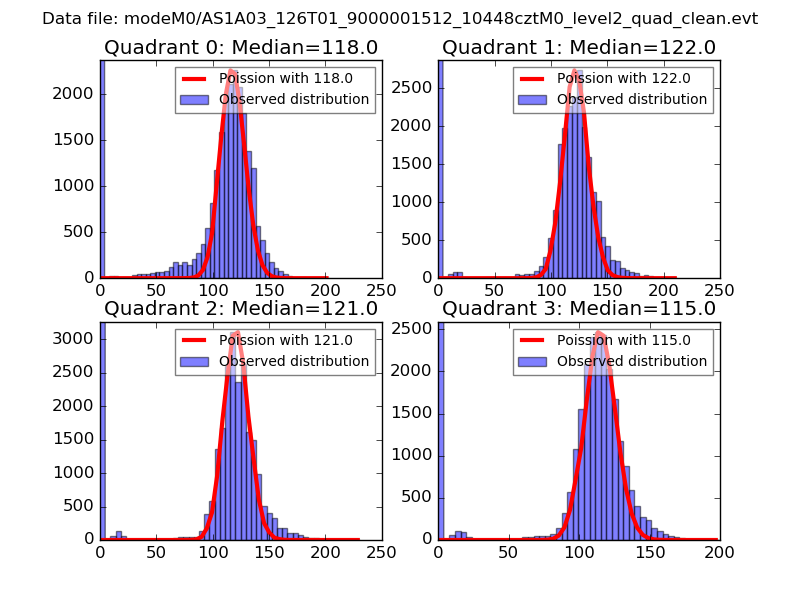 |
 |
| Quadrant-wise count rates Data is divided into 100 sec bins |
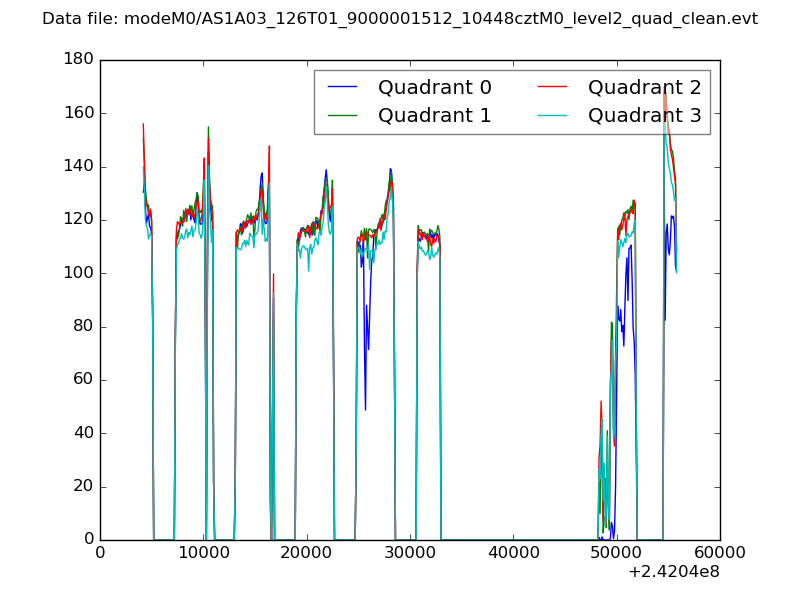 |
|
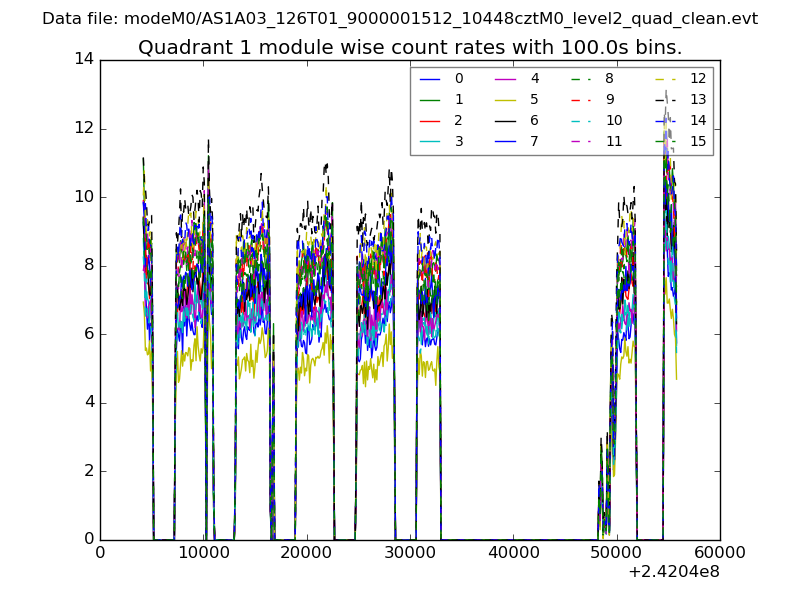
| Module-wise count rates for Quadrant A Data is divided into 100 sec bins |
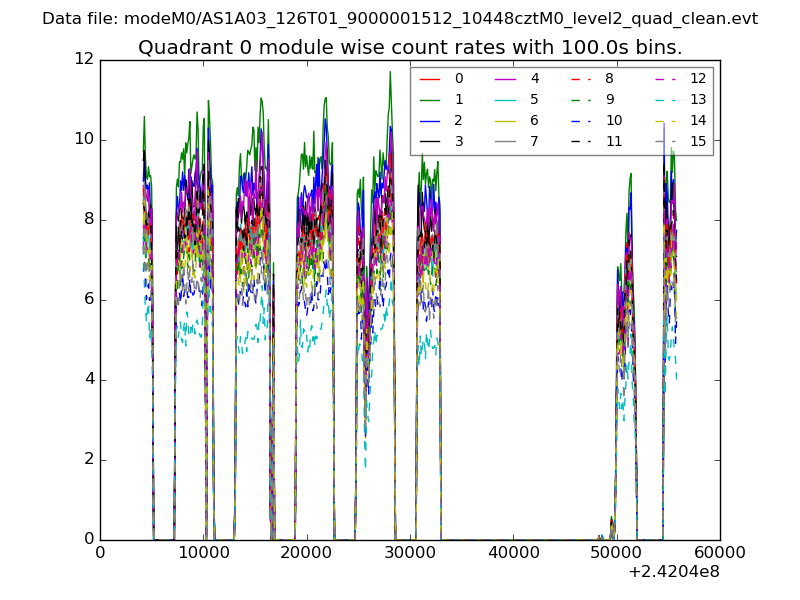 |
 |
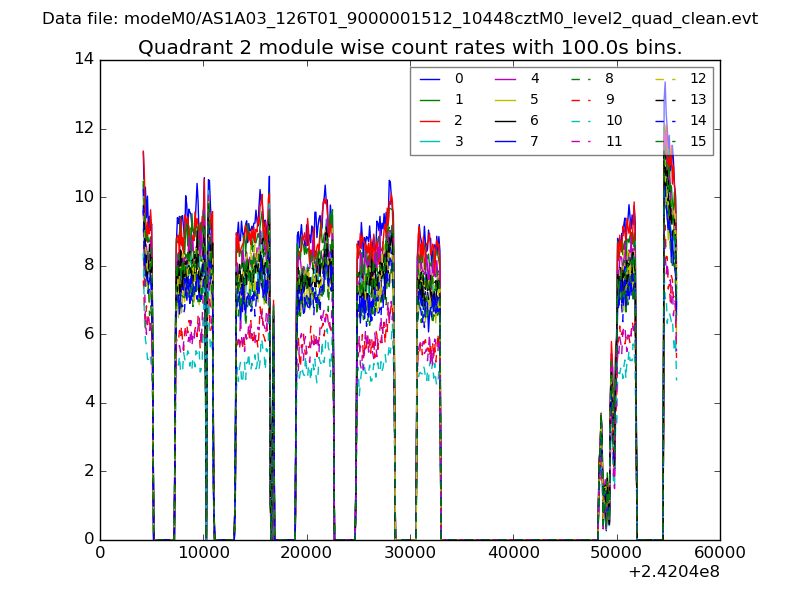
| Module-wise count rates for Quadrant B Data is divided into 100 sec bins |
 |
 |
| Module-wise count rates for Quadrant C Data is divided into 100 sec bins |
 |
 |
| Module-wise count rates for Quadrant D Data is divided into 100 sec bins |
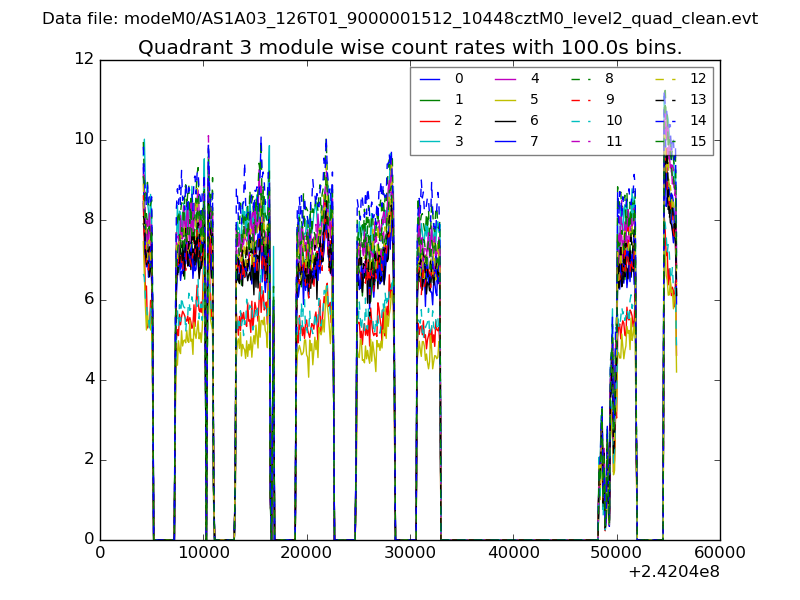 |
 |
| Parameter | Plot |
|---|---|
| CZT HV Monitor | 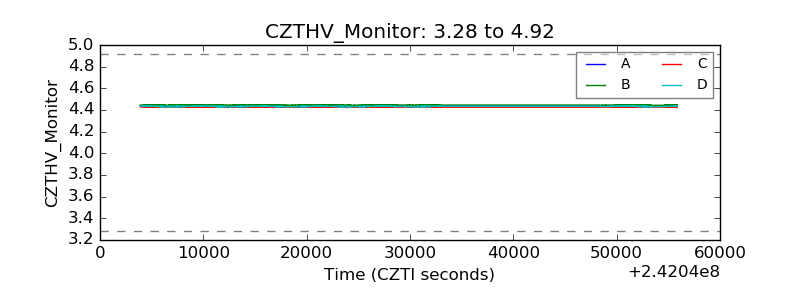 |
| D_VDD | 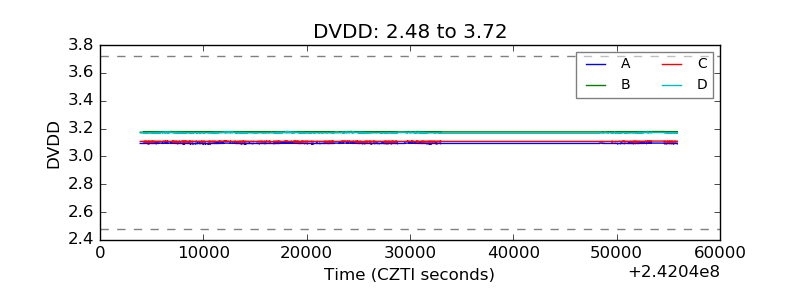 |
| Temperature 1 |  |
| Veto HV Monitor | 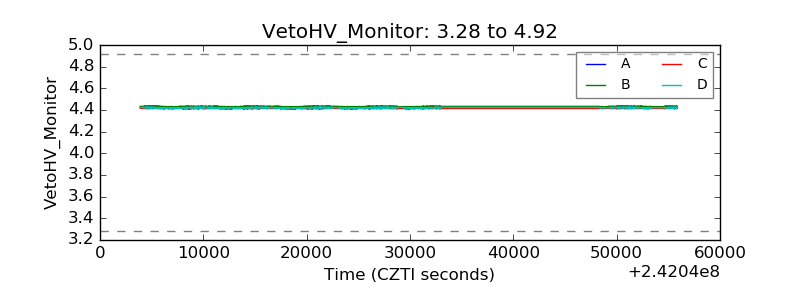 |
| Veto LLD | 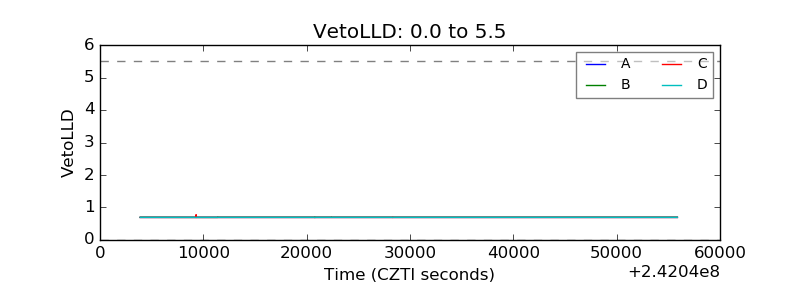 |
| Alpha Counter | 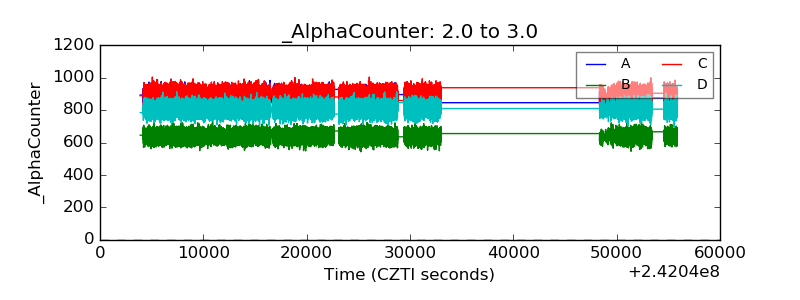 |
| _CPM_Rate | 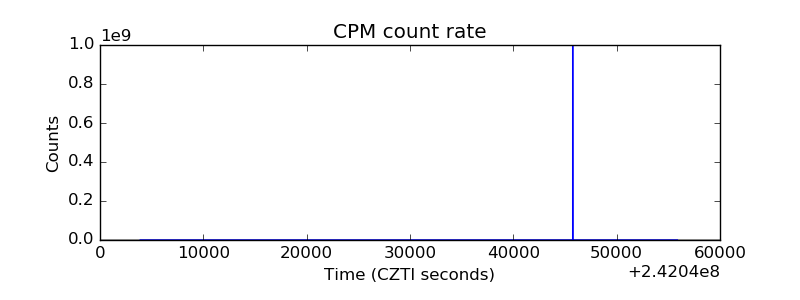 |
| CZT Counter | 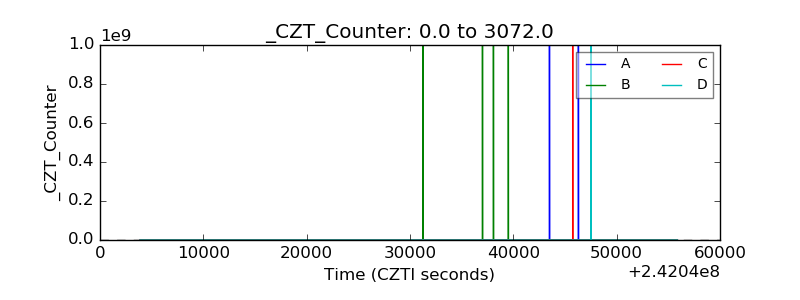 |
| +2.5 Volts monitor |  |
| +5 Volts monitor |  |
| _ROLL_ROT | 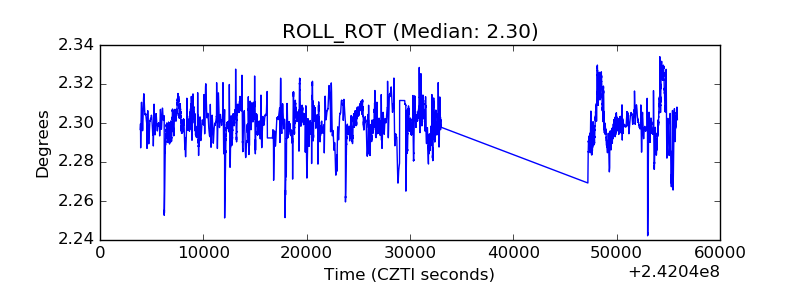 |
| _Roll_DEC | 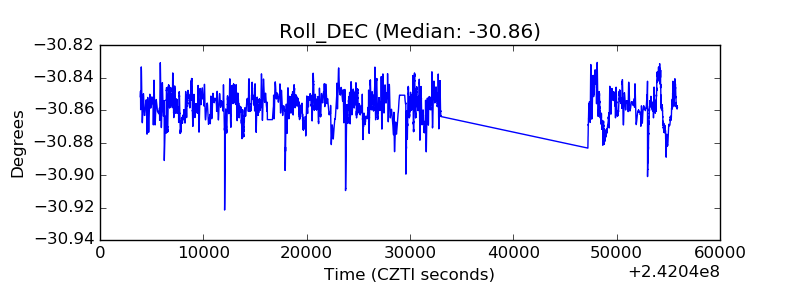 |
| _Roll_RA | 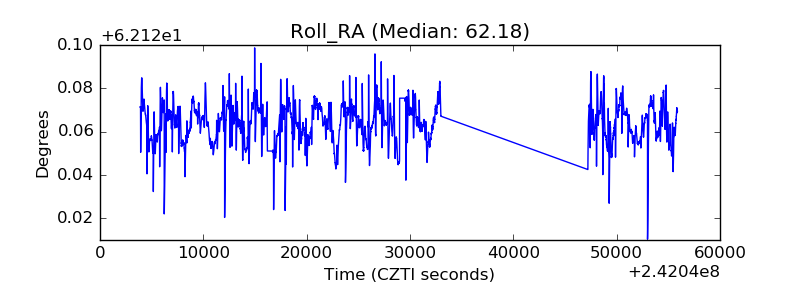 |
| Veto Counter | 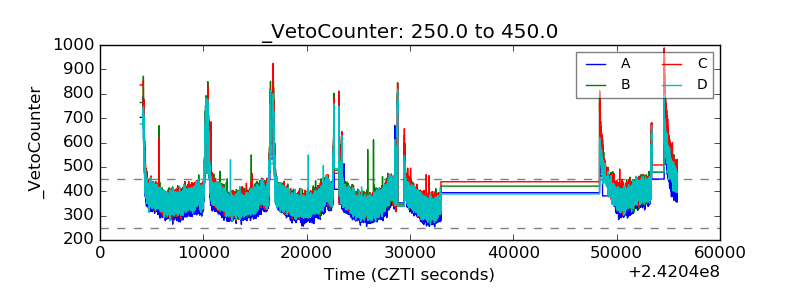 |