| Param | Original file | Final file |
|---|---|---|
| Filename | modeM0/AS1A03_126T01_9000001512_10449cztM0_level2.evt | modeM0/AS1A03_126T01_9000001512_10449cztM0_level2_quad_clean.evt |
| Size (bytes) | 678,219,840 | 101,666,880 |
| Size | 646.8 MB | 97.0 MB |
| Events in quadrant A | 9,161,110 | 618,135 |
| Events in quadrant B | 3,876,722 | 687,158 |
| Events in quadrant C | 3,185,506 | 679,955 |
| Events in quadrant D | 3,870,247 | 633,352 |
| Mode SS | |||
|---|---|---|---|
| Quadrant | BADHDUFLAG | Total packets | Discarded packets |
| A | 0 | 132 | 0 |
| B | 0 | 132 | 0 |
| C | 0 | 132 | 0 |
| D | 0 | 132 | 0 |
| Mode M0 | |||
|---|---|---|---|
| Quadrant | BADHDUFLAG | Total packets | Discarded packets |
| A | 0 | 31698 | 3 |
| B | 0 | 15817 | 2 |
| C | 0 | 13672 | 2 |
| D | 0 | 15817 | 2 |
| Mode M9 | |||
|---|---|---|---|
| Quadrant | BADHDUFLAG | Total packets | Discarded packets |
| A | 0 | 25 | 0 |
| B | 0 | 25 | 0 |
| C | 0 | 25 | 0 |
| D | 0 | 25 | 0 |
| Quadrant | Total seconds | Saturated seconds | Saturation percentage |
|---|---|---|---|
| A | 6604 | 2062 | 31.223501% |
| B | 6604 | 204 | 3.089037% |
| C | 6604 | 22 | 0.333131% |
| D | 6604 | 110 | 1.665657% |
Noise dominated data is calculated using 1-second bins in cleaned event files. If a bin has >2000 counts, and if more than 50% of those come from <1% of pixels, then it is considered to be noise-dominated and hence unusable.
| Quadrant | # 1 sec bins | Bins with >0 counts | Bins with >2000 counts | High rate bins dominated by noise | Noise dominated (total time) | Noise dominated (detector-on time) | Marked lightcurve |
|---|---|---|---|---|---|---|---|
| A | 7859 | 6604 | 1918 | 1918 | 24.41% | 29.04% | 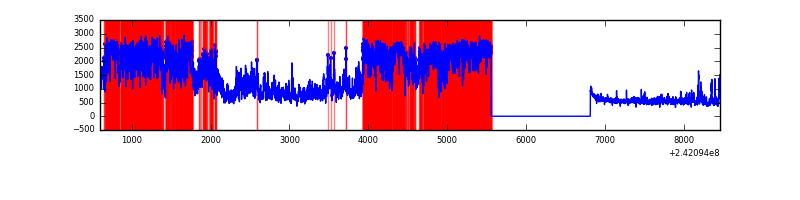 |
| B | 7859 | 6604 | 112 | 112 | 1.43% | 1.70% | 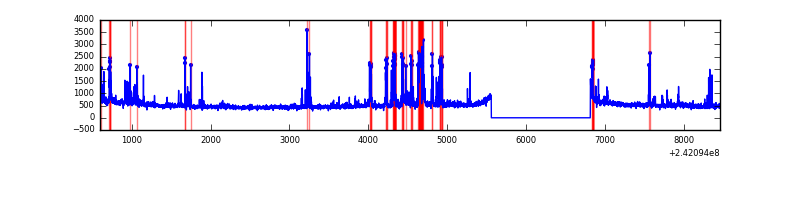 |
| C | 7859 | 6605 | 1 | 1 | 0.01% | 0.02% | 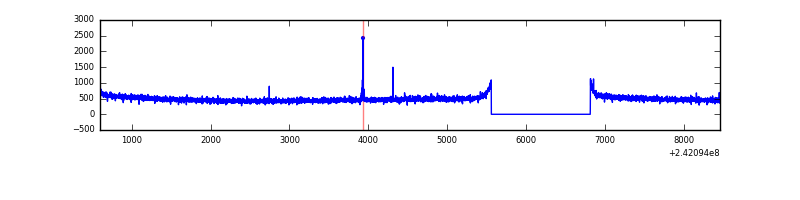 |
| D | 7859 | 6604 | 79 | 79 | 1.01% | 1.20% | 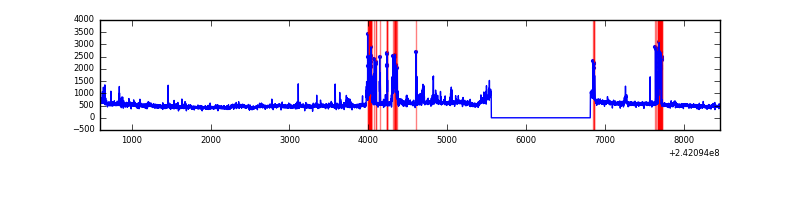 |
Top three noisy pixels from each quadrant. If the there are fewer than three noisy pixels in the level2.evt file, extra rows are filled as -1
| Pixel properties | Quadrant properties | ||||||
|---|---|---|---|---|---|---|---|
| Quadrant | DetID | PixID | Counts | Sigma | Mean | Median | Sigma |
| A | 13 | 251 | 6245309 | 43125.3 | 723 | 710 | 144.8 |
| A | 3 | 80 | 74364 | 508.66 | 723 | 710 | 144.8 |
| A | 15 | 223 | 20556 | 137.06 | 723 | 710 | 144.8 |
| B | 4 | 239 | 549004 | 3612.81 | 818 | 801 | 151.7 |
| B | 0 | 214 | 86935 | 567.65 | 818 | 801 | 151.7 |
| B | 4 | 81 | 25704 | 164.12 | 818 | 801 | 151.7 |
| C | 14 | 234 | 10459 | 51.27 | 813 | 822 | 188.0 |
| C | 13 | 61 | 6004 | 27.57 | 813 | 822 | 188.0 |
| C | 14 | 67 | 3141 | 12.34 | 813 | 822 | 188.0 |
| D | 8 | 195 | 413101 | 2185.32 | 793 | 774 | 188.7 |
| D | 2 | 33 | 220872 | 1166.51 | 793 | 774 | 188.7 |
| D | 9 | 85 | 113234 | 596.03 | 793 | 774 | 188.7 |
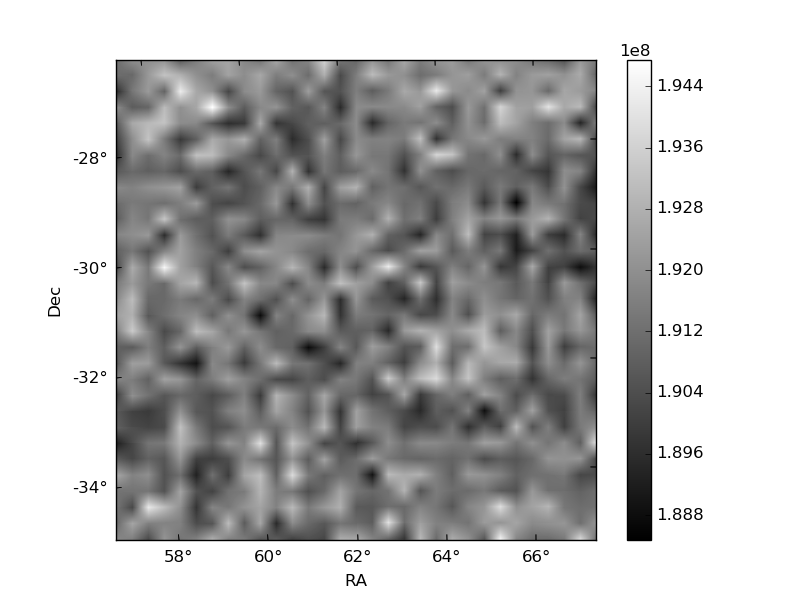
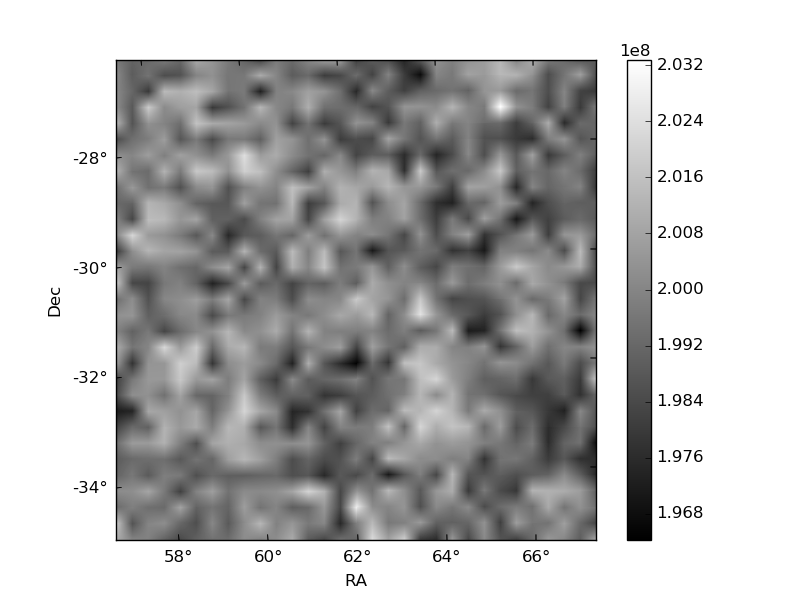
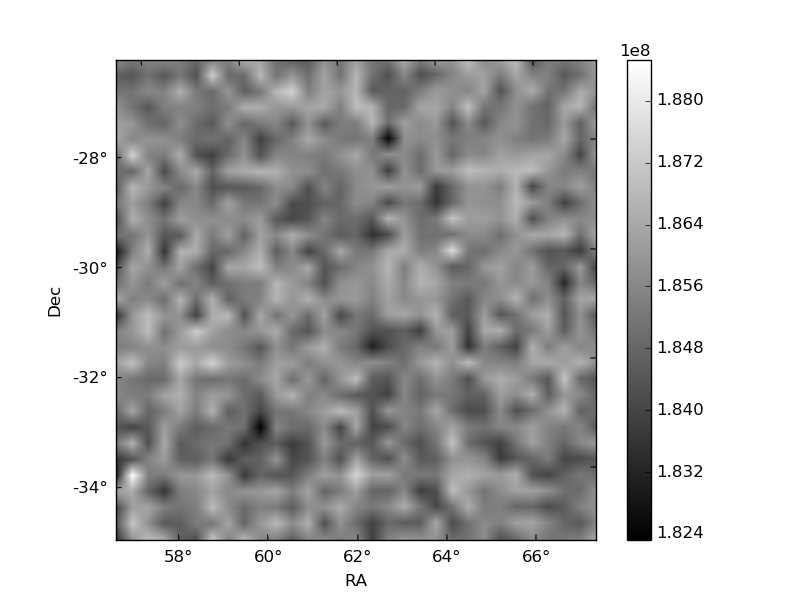
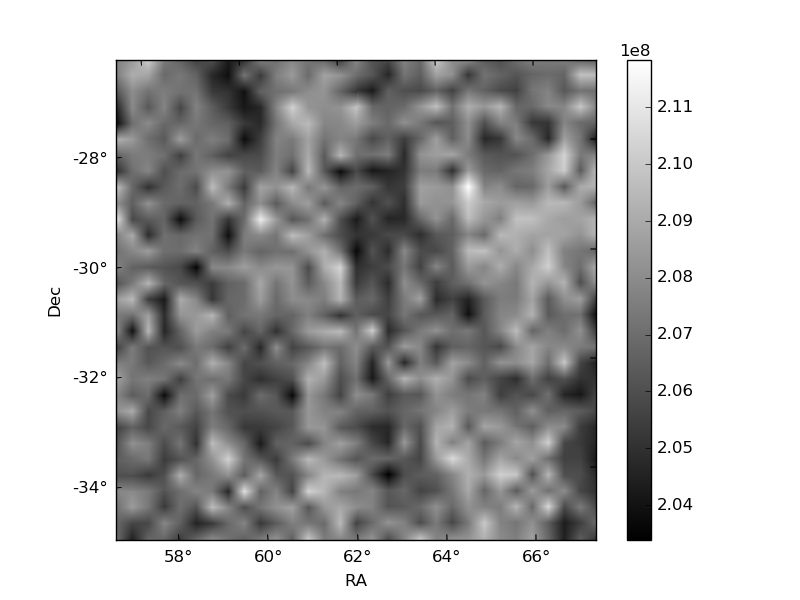
Histogram calculated using DETX and DETY for each event in the final _common_clean file
| Quadrant A | 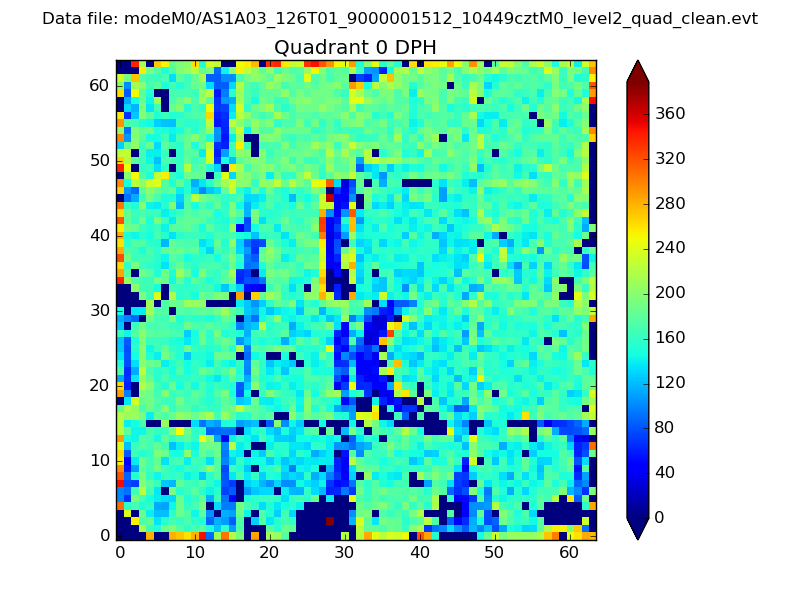 |
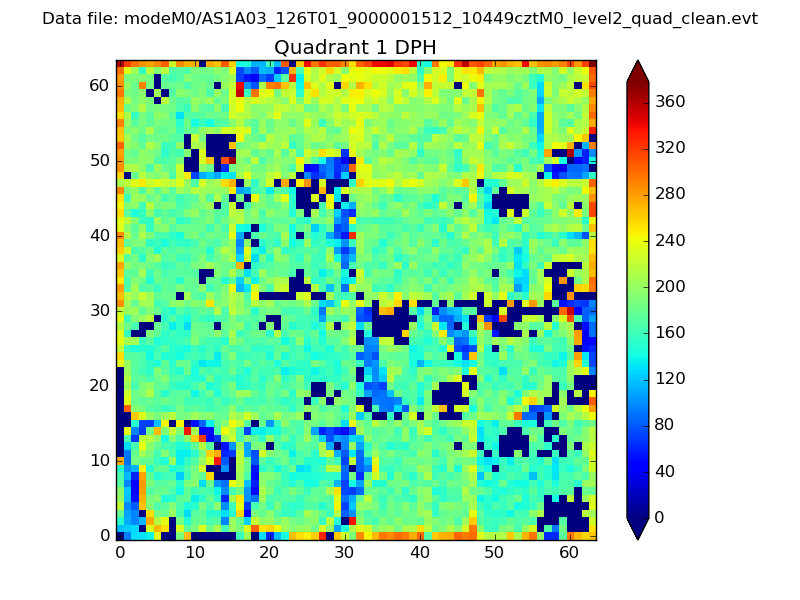 |
Quadrant B |
|---|---|---|---|
| Quadrant D |  |
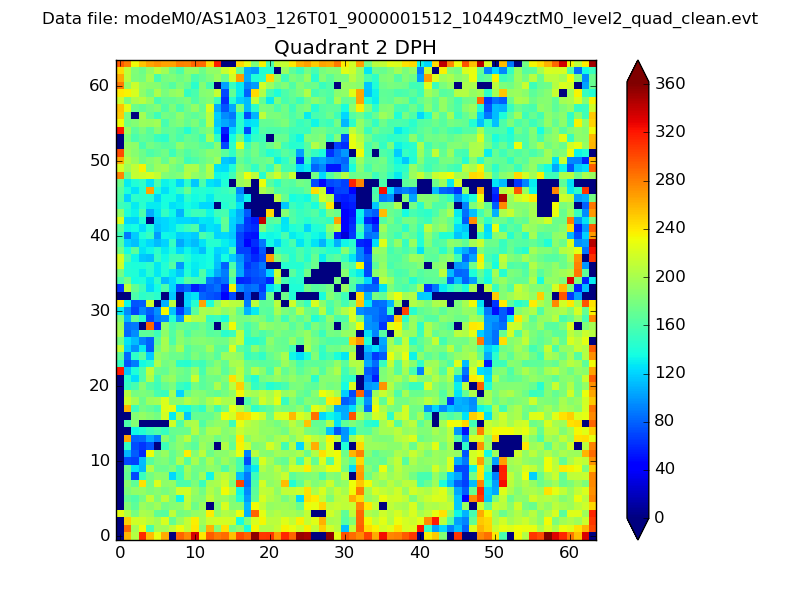 |
Quadrant C |
| Plot type | Count rate plots | Images |
|---|---|---|
| Comparison with Poisson distribution Blue bars denote a histogram of data divided into 1 sec bins. Red curve is a Poisson curve with rate = median count rate of data. |
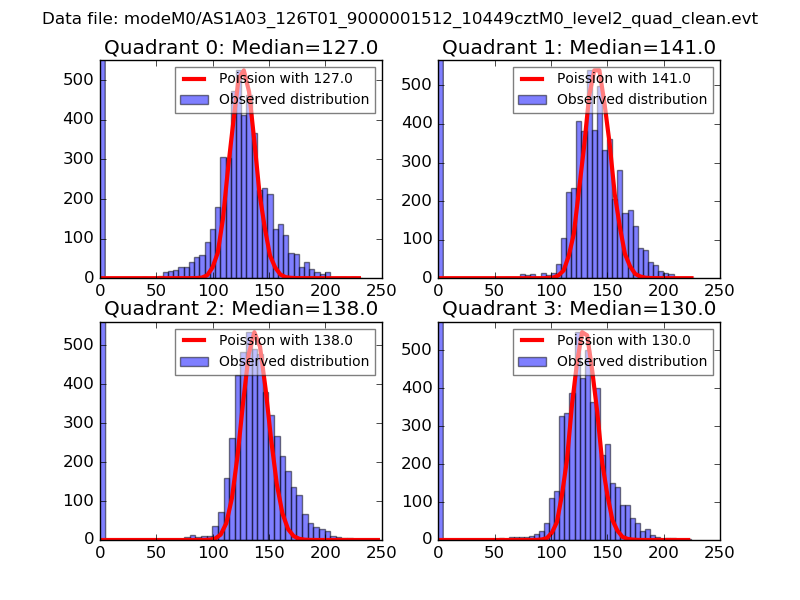 |
 |
| Quadrant-wise count rates Data is divided into 100 sec bins |
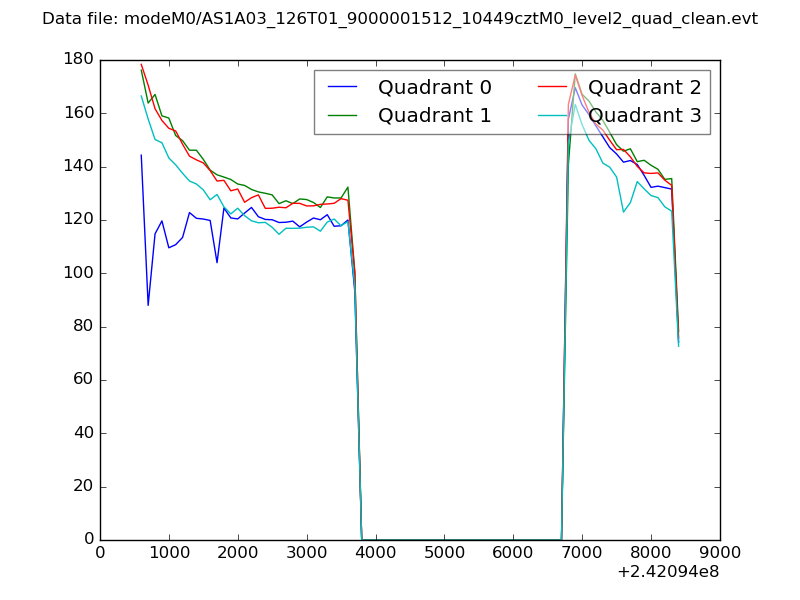 |
|
| Module-wise count rates for Quadrant A Data is divided into 100 sec bins |
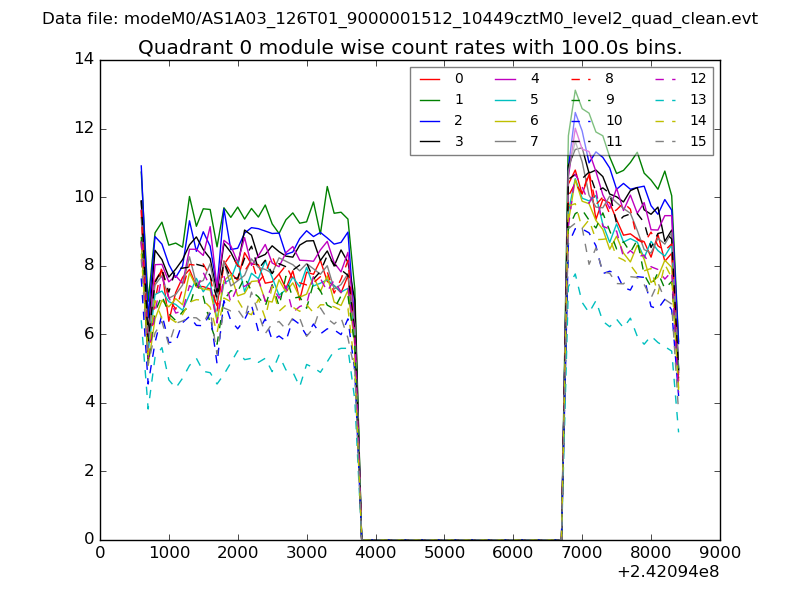 |
 |
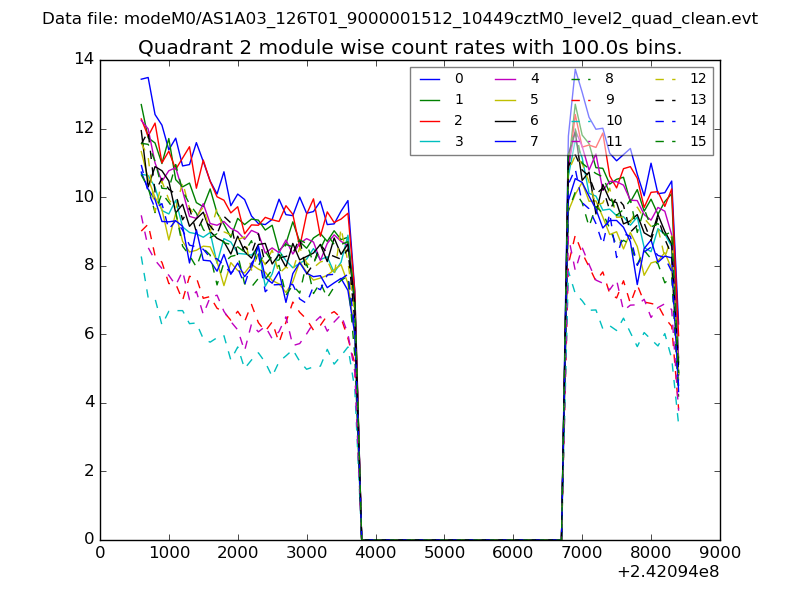
| Module-wise count rates for Quadrant B Data is divided into 100 sec bins |
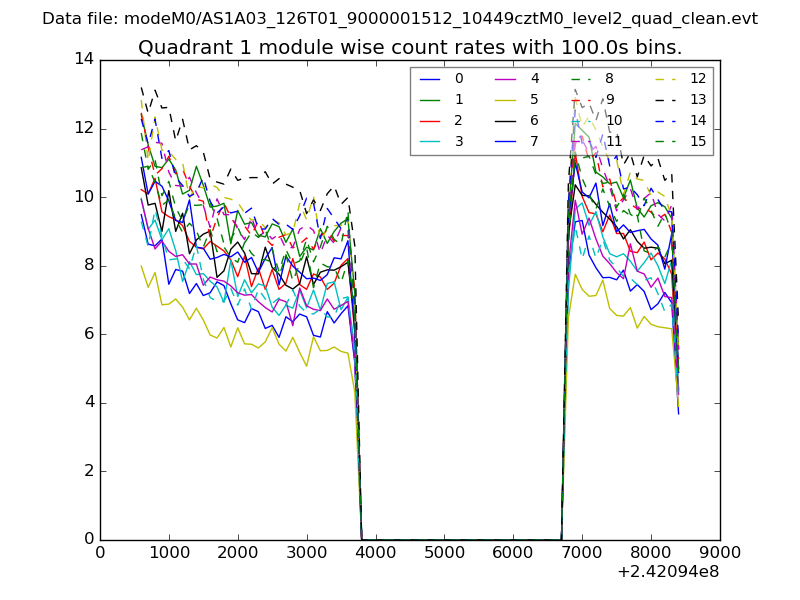 |
 |
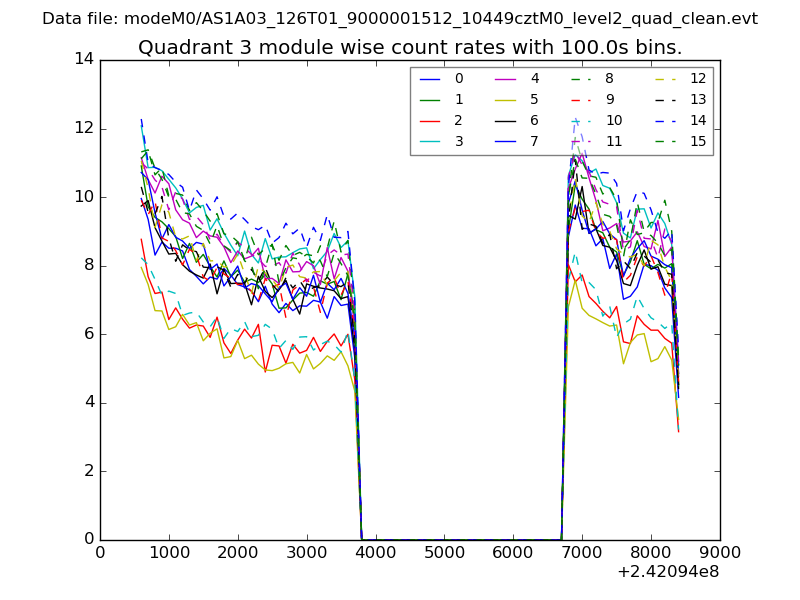
| Module-wise count rates for Quadrant C Data is divided into 100 sec bins |
 |
 |
| Module-wise count rates for Quadrant D Data is divided into 100 sec bins |
 |
 |
| Parameter | Plot |
|---|---|
| CZT HV Monitor | 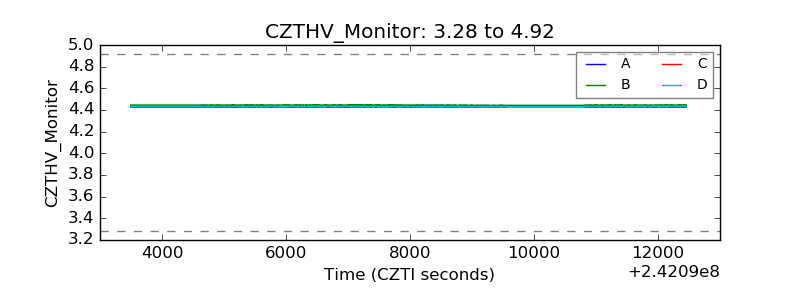 |
| D_VDD | 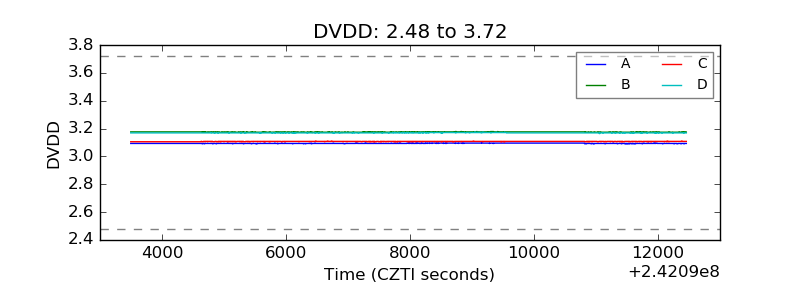 |
| Temperature 1 | 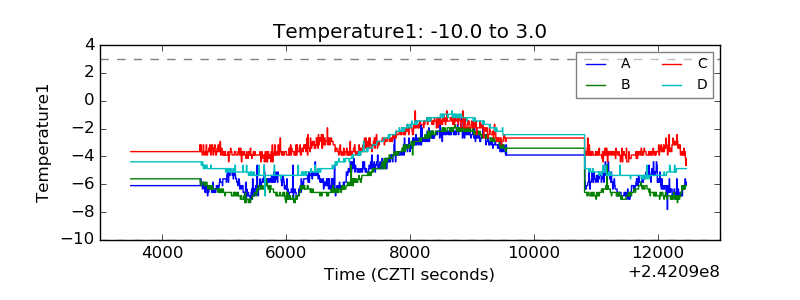 |
| Veto HV Monitor | 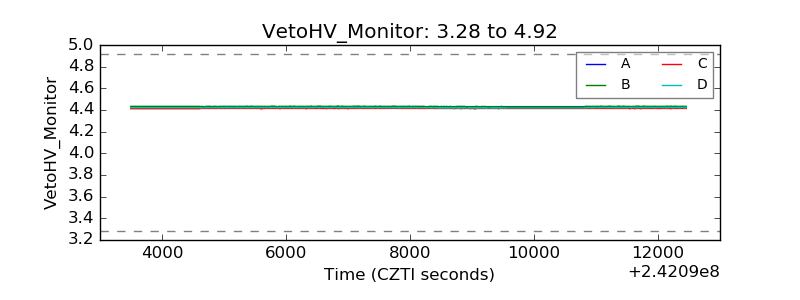 |
| Veto LLD | 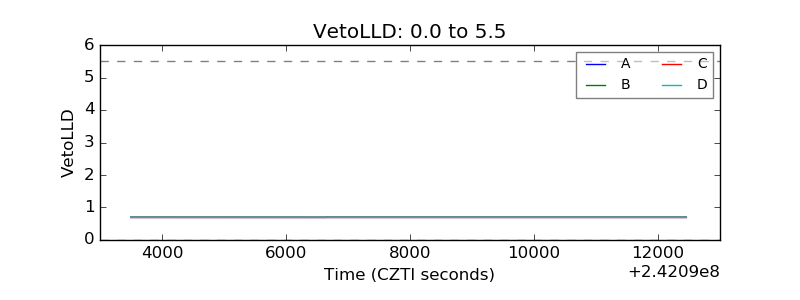 |
| Alpha Counter | 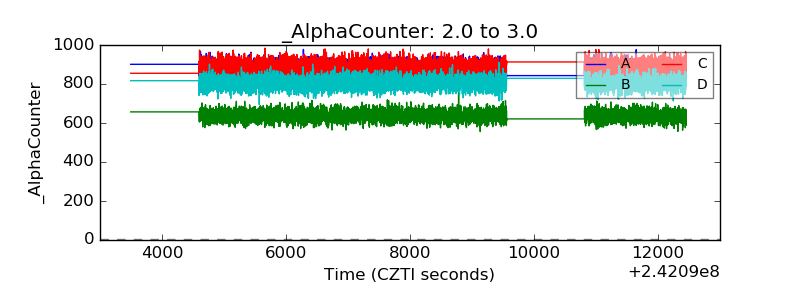 |
| _CPM_Rate | 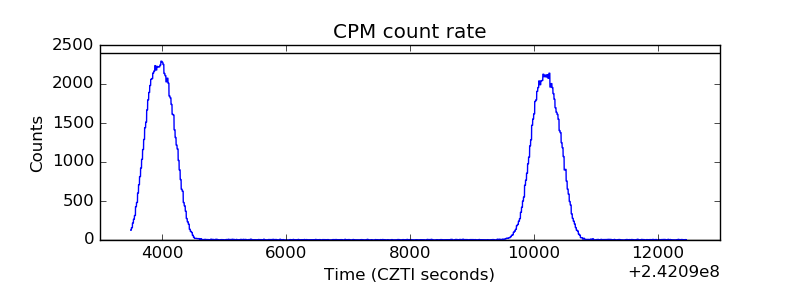 |
| CZT Counter |  |
| +2.5 Volts monitor |  |
| +5 Volts monitor | 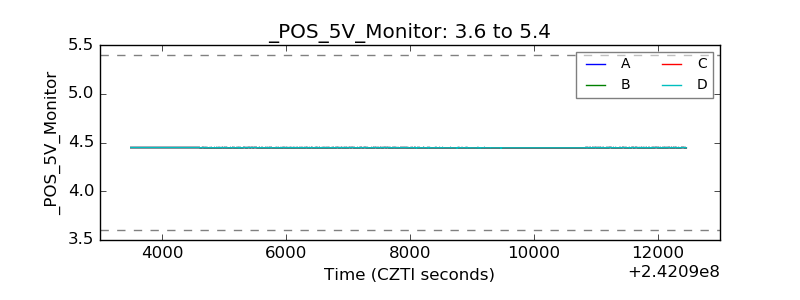 |
| _ROLL_ROT | 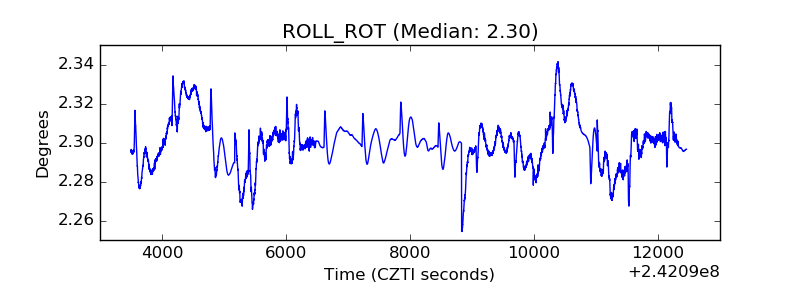 |
| _Roll_DEC | 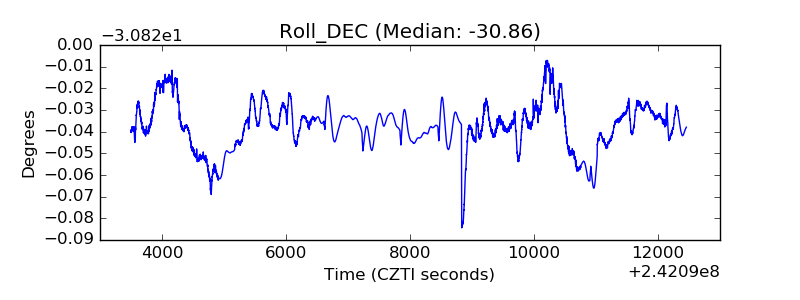 |
| _Roll_RA |  |
| Veto Counter | 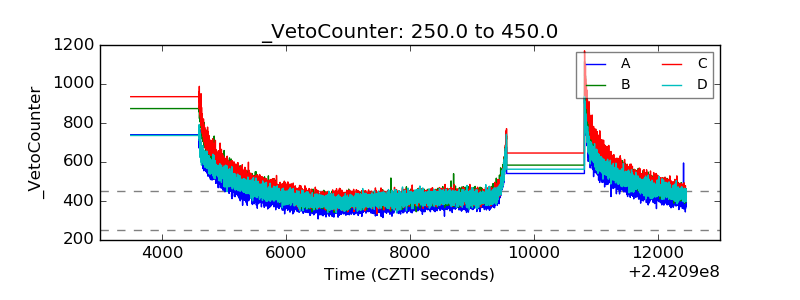 |