| Param | Original file | Final file |
|---|---|---|
| Filename | modeM0/AS1A03_126T01_9000001512_10450cztM0_level2.evt | modeM0/AS1A03_126T01_9000001512_10450cztM0_level2_quad_clean.evt |
| Size (bytes) | 4,214,102,400 | 559,463,040 |
| Size | 3.9 GB | 533.5 MB |
| Events in quadrant A | 55,444,935 | 3,134,624 |
| Events in quadrant B | 25,752,448 | 3,694,297 |
| Events in quadrant C | 19,689,944 | 3,673,596 |
| Events in quadrant D | 23,835,412 | 3,478,355 |
| Mode SS | |||
|---|---|---|---|
| Quadrant | BADHDUFLAG | Total packets | Discarded packets |
| A | 0 | 908 | 29 |
| B | 0 | 908 | 29 |
| C | 0 | 908 | 28 |
| D | 0 | 904 | 26 |
| Mode M0 | |||
|---|---|---|---|
| Quadrant | BADHDUFLAG | Total packets | Discarded packets |
| A | 0 | 196975 | 3328 |
| B | 0 | 108535 | 3385 |
| C | 0 | 91135 | 3051 |
| D | 0 | 102108 | 3424 |
| Mode M9 | |||
|---|---|---|---|
| Quadrant | BADHDUFLAG | Total packets | Discarded packets |
| A | 0 | 79 | 0 |
| B | 0 | 79 | 0 |
| C | 0 | 79 | 0 |
| D | 0 | 79 | 0 |
| Quadrant | Total seconds | Saturated seconds | Saturation percentage |
|---|---|---|---|
| A | 43091 | 12562 | 29.152259% |
| B | 43117 | 1689 | 3.917248% |
| C | 43136 | 162 | 0.375556% |
| D | 43249 | 397 | 0.917940% |
Noise dominated data is calculated using 1-second bins in cleaned event files. If a bin has >2000 counts, and if more than 50% of those come from <1% of pixels, then it is considered to be noise-dominated and hence unusable.
| Quadrant | # 1 sec bins | Bins with >0 counts | Bins with >2000 counts | High rate bins dominated by noise | Noise dominated (total time) | Noise dominated (detector-on time) | Marked lightcurve |
|---|---|---|---|---|---|---|---|
| A | 51249 | 43289 | 11836 | 11836 | 23.10% | 27.34% | 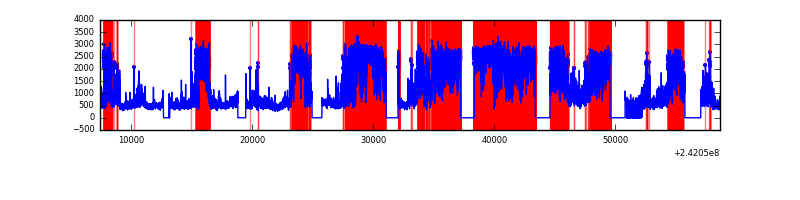 |
| B | 51249 | 43295 | 1024 | 1024 | 2.00% | 2.37% | 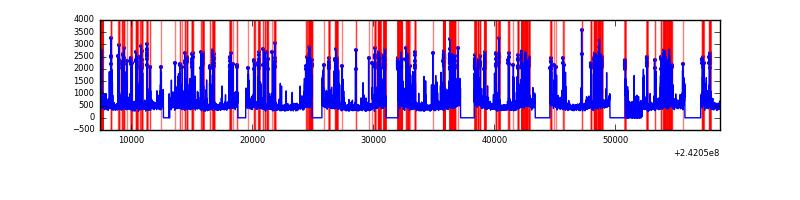 |
| C | 51249 | 43326 | 15 | 15 | 0.03% | 0.03% | 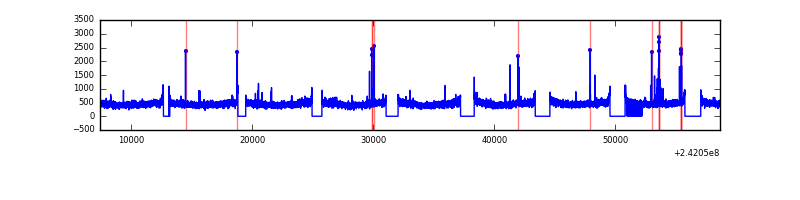 |
| D | 51249 | 43322 | 229 | 229 | 0.45% | 0.53% | 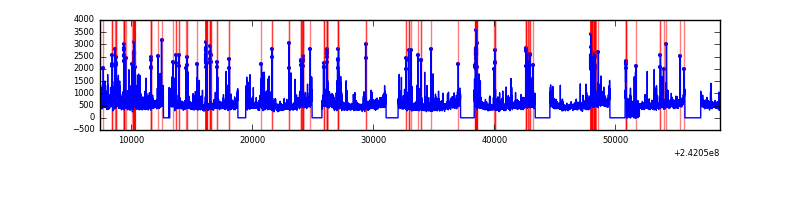 |
Top three noisy pixels from each quadrant. If the there are fewer than three noisy pixels in the level2.evt file, extra rows are filled as -1
| Pixel properties | Quadrant properties | ||||||
|---|---|---|---|---|---|---|---|
| Quadrant | DetID | PixID | Counts | Sigma | Mean | Median | Sigma |
| A | 13 | 251 | 37052577 | 41322.05 | 4472 | 4376 | 896.6 |
| A | 3 | 80 | 646916 | 716.66 | 4472 | 4376 | 896.6 |
| A | 15 | 223 | 239569 | 262.32 | 4472 | 4376 | 896.6 |
| B | 4 | 239 | 5040692 | 5327.17 | 5054 | 4934 | 945.3 |
| B | 0 | 214 | 417499 | 436.44 | 5054 | 4934 | 945.3 |
| B | 11 | 51 | 212983 | 220.09 | 5054 | 4934 | 945.3 |
| C | 14 | 234 | 133350 | 111.24 | 5011 | 5041 | 1153.4 |
| C | 13 | 61 | 37045 | 27.75 | 5011 | 5041 | 1153.4 |
| C | 14 | 67 | 22109 | 14.8 | 5011 | 5041 | 1153.4 |
| D | 8 | 195 | 2294636 | 1921.6 | 4967 | 4830 | 1191.6 |
| D | 1 | 52 | 559559 | 465.53 | 4967 | 4830 | 1191.6 |
| D | 1 | 20 | 504956 | 419.7 | 4967 | 4830 | 1191.6 |
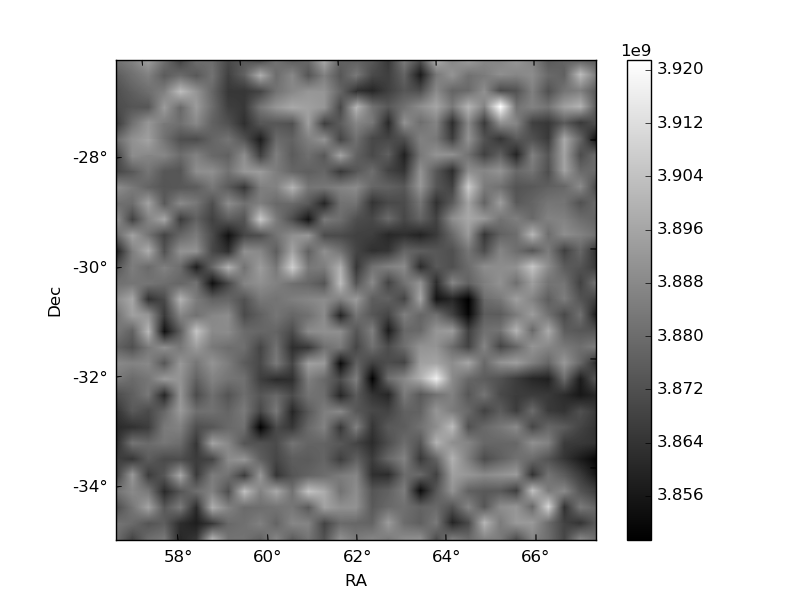
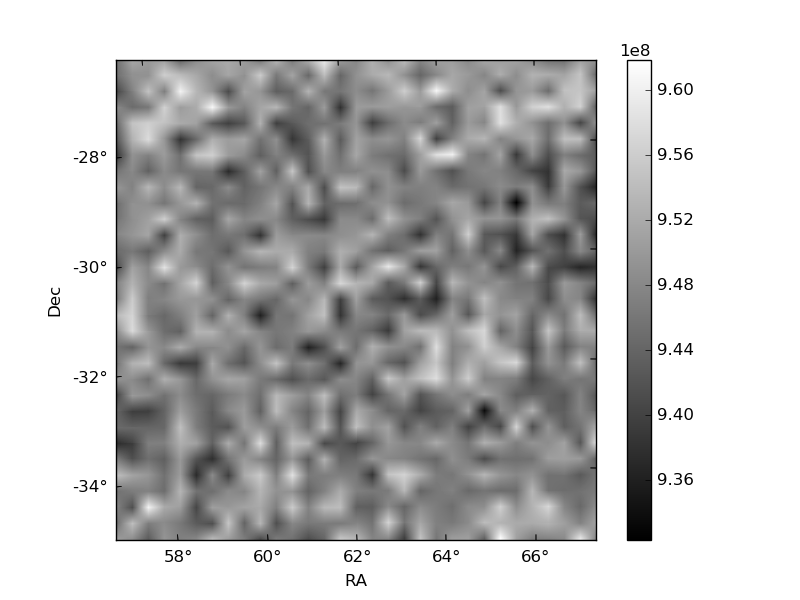
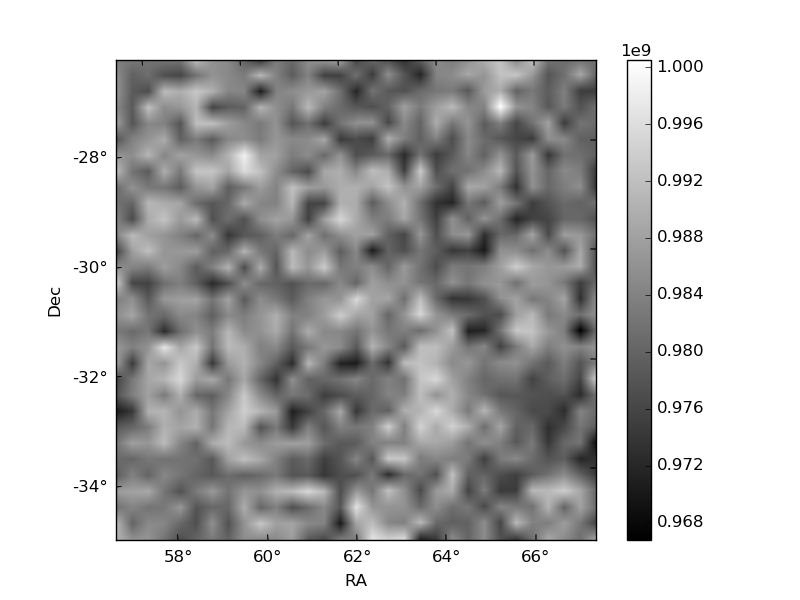
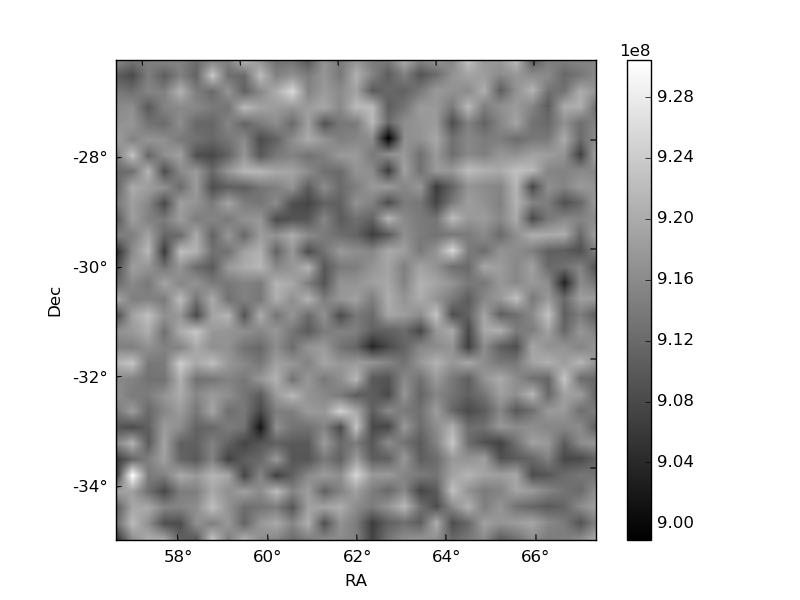
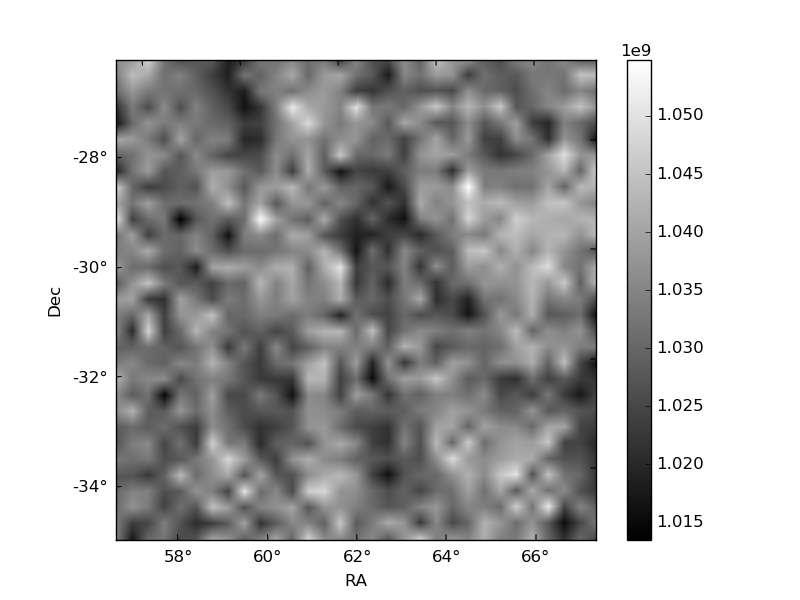
Histogram calculated using DETX and DETY for each event in the final _common_clean file
| Quadrant A | 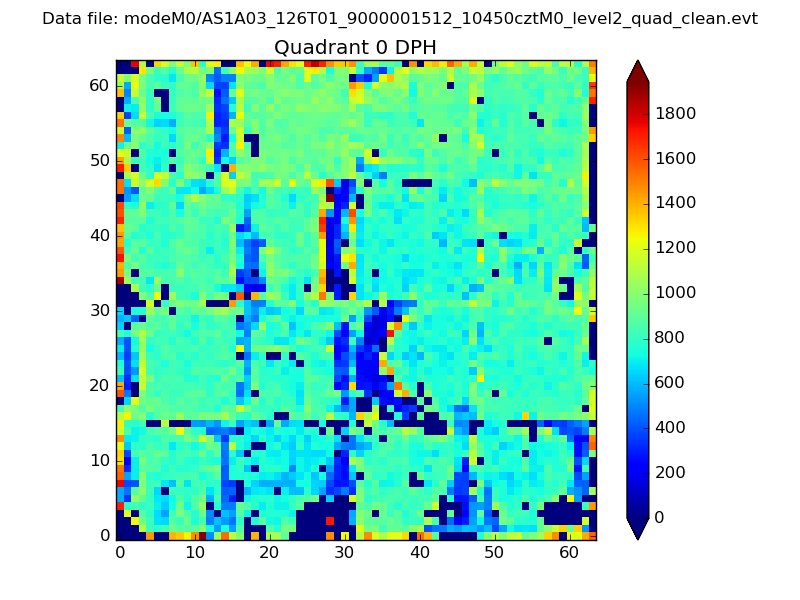 |
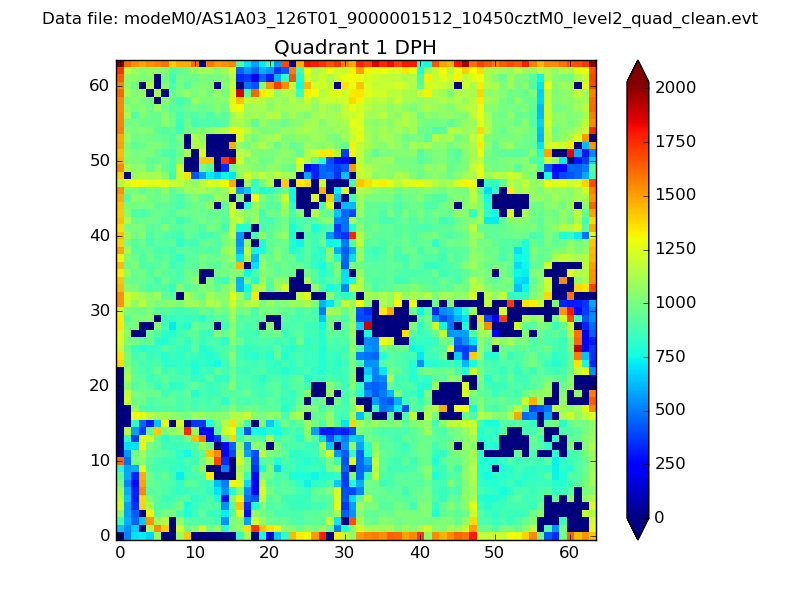 |
Quadrant B |
|---|---|---|---|
| Quadrant D | 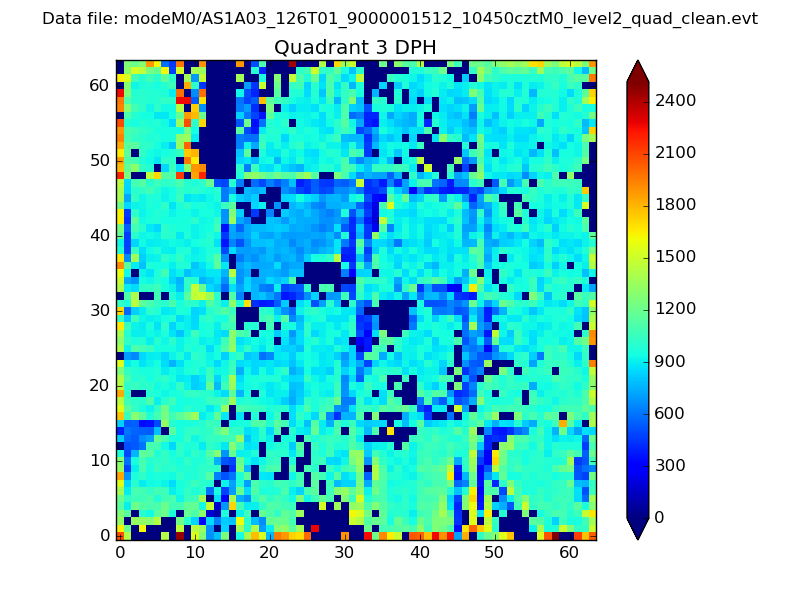 |
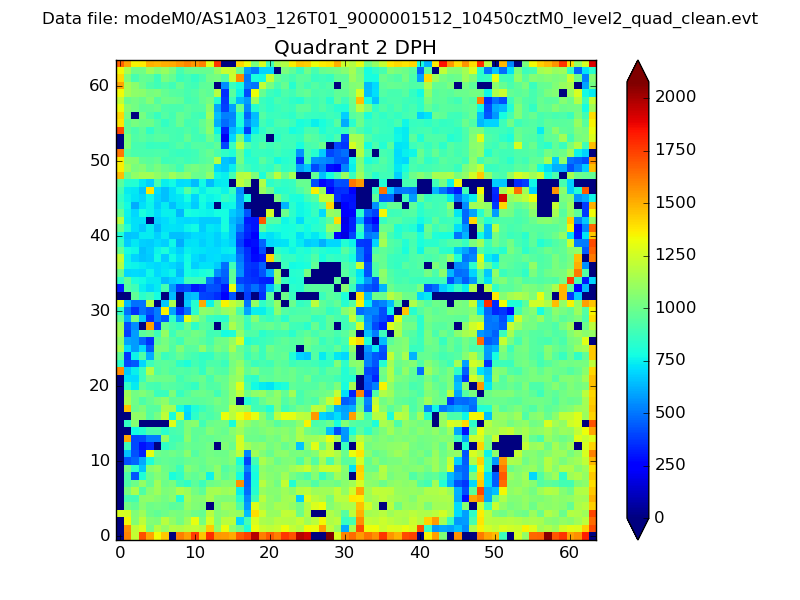 |
Quadrant C |
| Plot type | Count rate plots | Images |
|---|---|---|
| Comparison with Poisson distribution Blue bars denote a histogram of data divided into 1 sec bins. Red curve is a Poisson curve with rate = median count rate of data. |
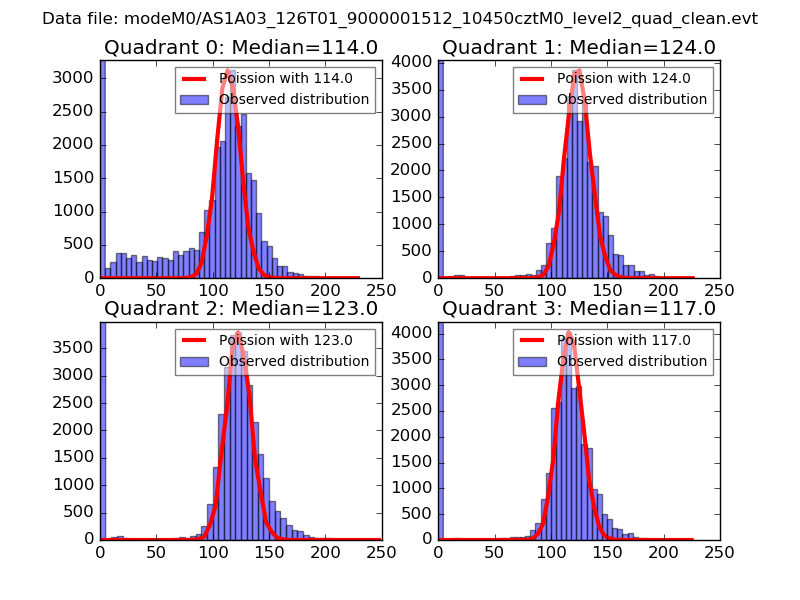 |
 |
| Quadrant-wise count rates Data is divided into 100 sec bins |
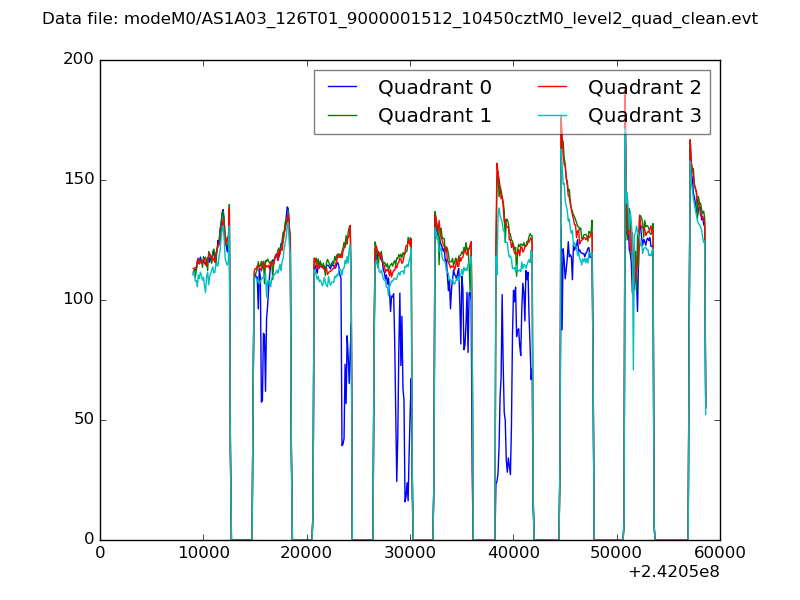 |
|
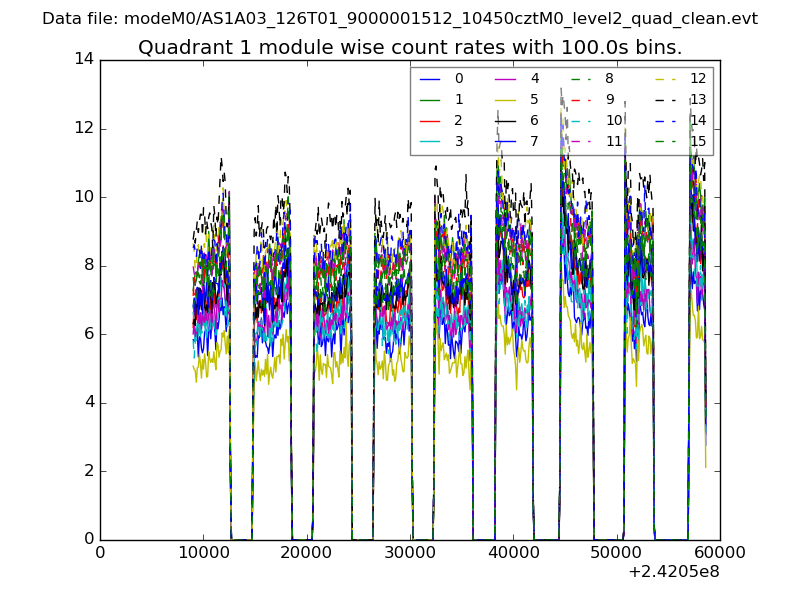
| Module-wise count rates for Quadrant A Data is divided into 100 sec bins |
 |
 |
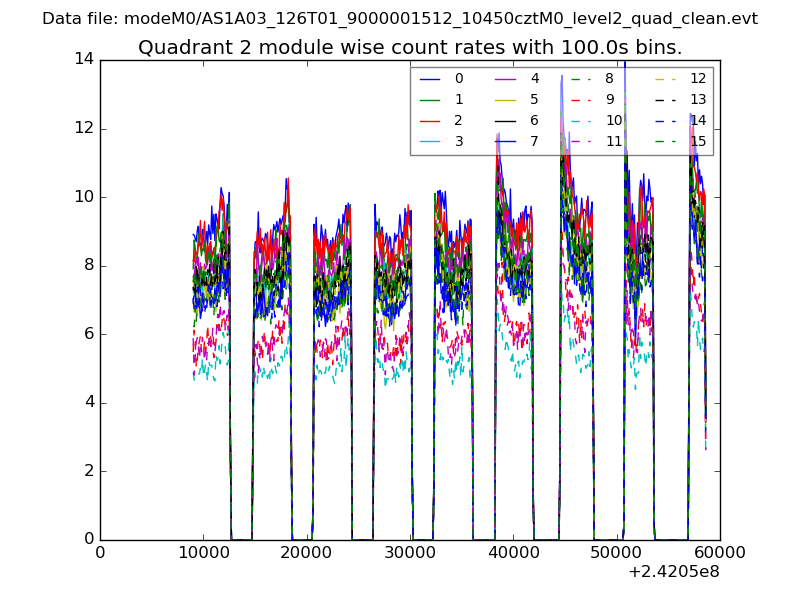
| Module-wise count rates for Quadrant B Data is divided into 100 sec bins |
 |
 |
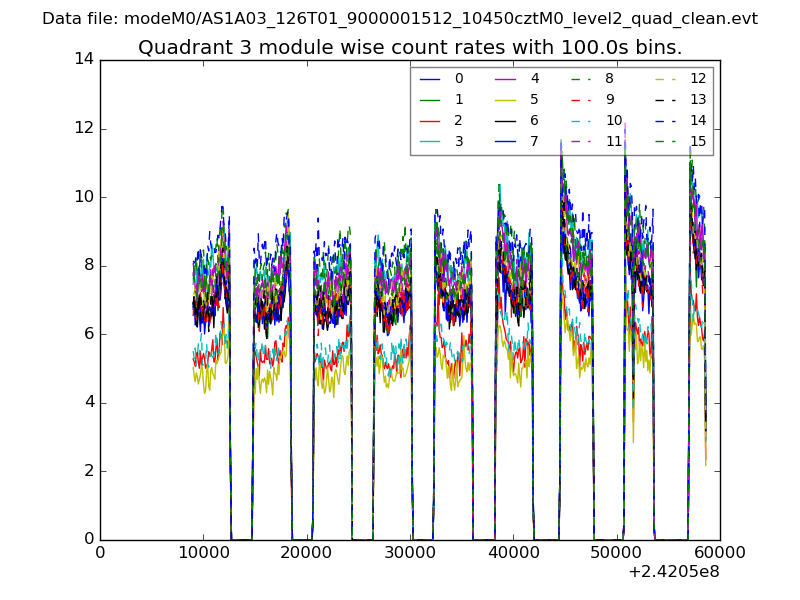
| Module-wise count rates for Quadrant C Data is divided into 100 sec bins |
 |
 |
| Module-wise count rates for Quadrant D Data is divided into 100 sec bins |
 |
 |
| Parameter | Plot |
|---|---|
| CZT HV Monitor |  |
| D_VDD | 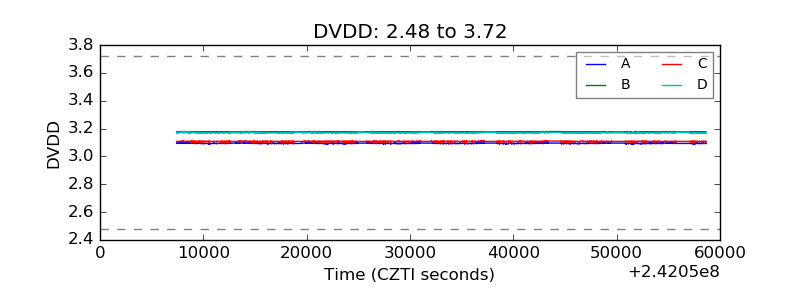 |
| Temperature 1 | 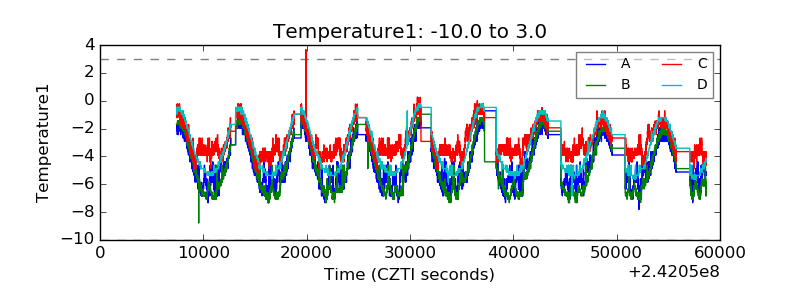 |
| Veto HV Monitor | 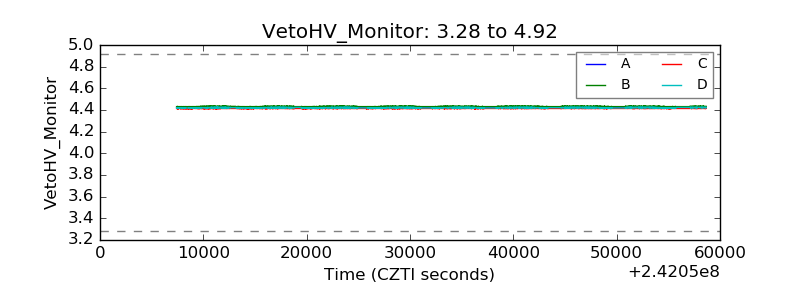 |
| Veto LLD |  |
| Alpha Counter | 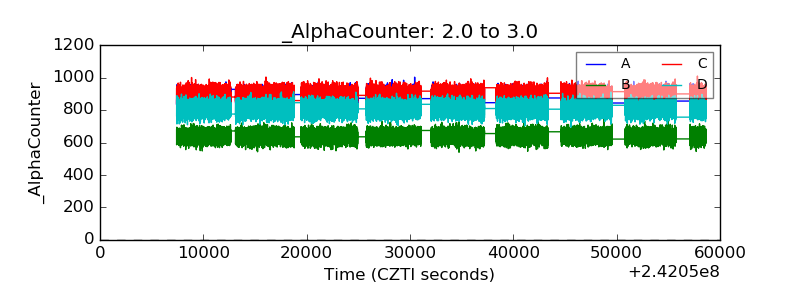 |
| _CPM_Rate | 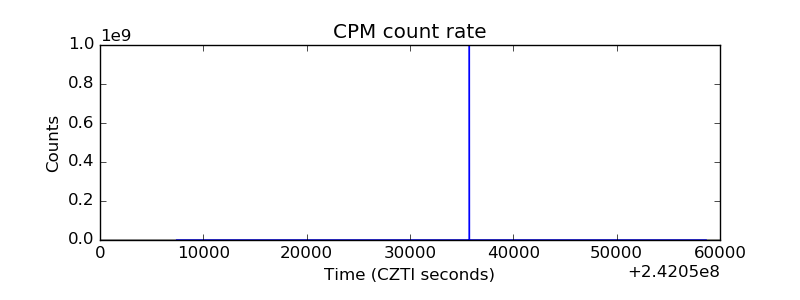 |
| CZT Counter | 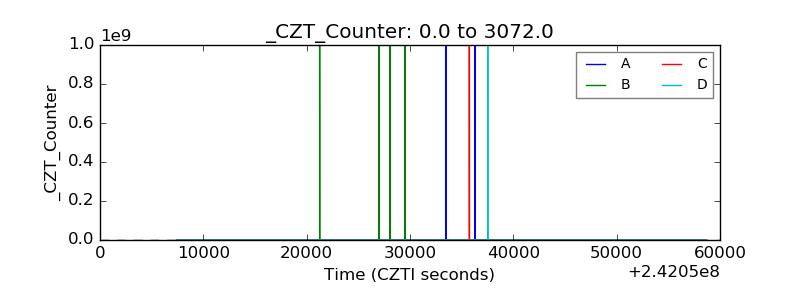 |
| +2.5 Volts monitor | 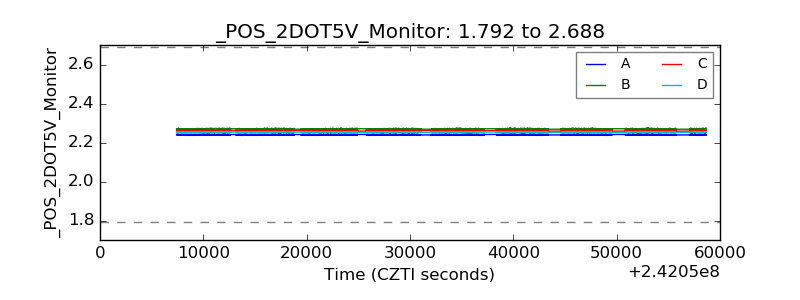 |
| +5 Volts monitor |  |
| _ROLL_ROT |  |
| _Roll_DEC | 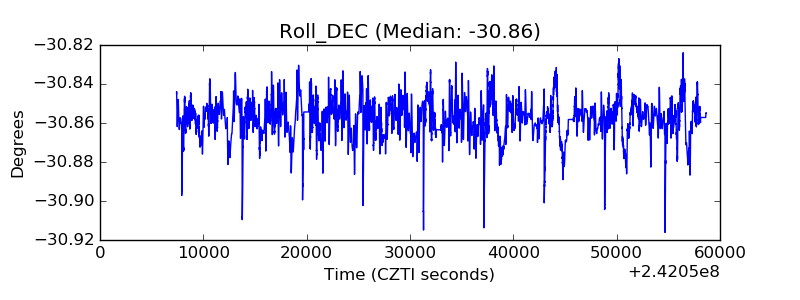 |
| _Roll_RA | 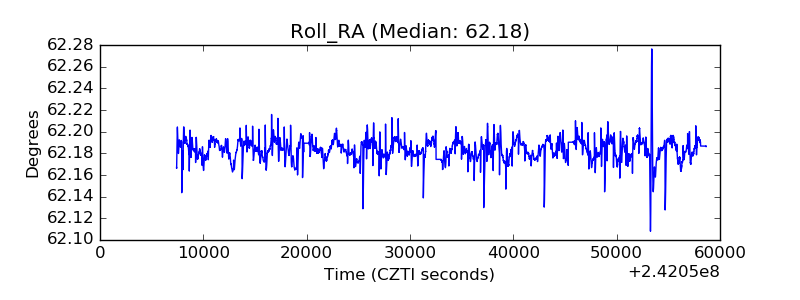 |
| Veto Counter |  |