| Param | Original file | Final file |
|---|---|---|
| Filename | modeM0/AS1A03_126T01_9000001512_10451cztM0_level2.evt | modeM0/AS1A03_126T01_9000001512_10451cztM0_level2_quad_clean.evt |
| Size (bytes) | 329,961,600 | 59,042,880 |
| Size | 314.7 MB | 56.3 MB |
| Events in quadrant A | 2,347,773 | 316,653 |
| Events in quadrant B | 2,256,967 | 368,452 |
| Events in quadrant C | 2,171,262 | 377,668 |
| Events in quadrant D | 2,913,690 | 413,075 |
| Mode SS | |||
|---|---|---|---|
| Quadrant | BADHDUFLAG | Total packets | Discarded packets |
| A | 0 | 224 | 134 |
| B | 0 | 224 | 123 |
| C | 0 | 224 | 125 |
| D | 0 | 212 | 114 |
| Mode M0 | |||
|---|---|---|---|
| Quadrant | BADHDUFLAG | Total packets | Discarded packets |
| A | 0 | 34276 | 25117 |
| B | 0 | 26833 | 17443 |
| C | 0 | 22898 | 13439 |
| D | 0 | 24939 | 13057 |
| Mode M9 | |||
|---|---|---|---|
| Quadrant | BADHDUFLAG | Total packets | Discarded packets |
| A | 0 | 23 | 10 |
| B | 0 | 26 | 13 |
| C | 0 | 26 | 13 |
| D | 0 | 24 | 11 |
| Quadrant | Total seconds | Saturated seconds | Saturation percentage |
|---|---|---|---|
| A | 3604 | 80 | 2.219756% |
| B | 4294 | 69 | 1.606893% |
| C | 4621 | 18 | 0.389526% |
| D | 5228 | 31 | 0.592961% |
Noise dominated data is calculated using 1-second bins in cleaned event files. If a bin has >2000 counts, and if more than 50% of those come from <1% of pixels, then it is considered to be noise-dominated and hence unusable.
| Quadrant | # 1 sec bins | Bins with >0 counts | Bins with >2000 counts | High rate bins dominated by noise | Noise dominated (total time) | Noise dominated (detector-on time) | Marked lightcurve |
|---|---|---|---|---|---|---|---|
| A | 6829 | 4433 | 9 | 9 | 0.13% | 0.20% | 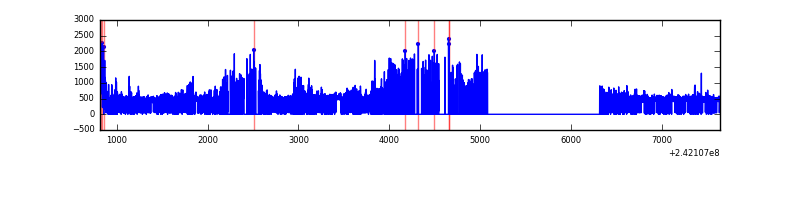 |
| B | 6830 | 5107 | 9 | 9 | 0.13% | 0.18% | 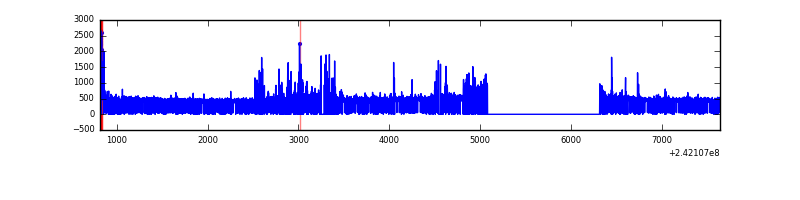 |
| C | 6830 | 5385 | 0 | 0 | 0.00% | 0.00% | 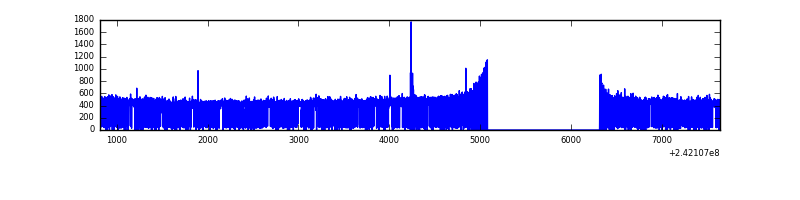 |
| D | 6830 | 5527 | 1 | 1 | 0.01% | 0.02% | 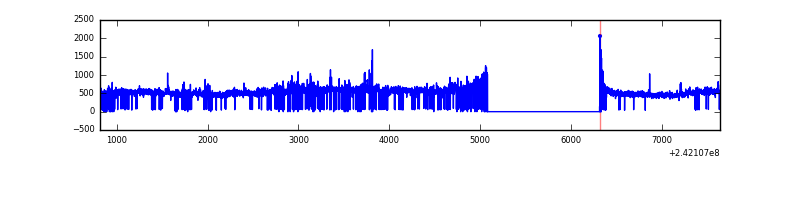 |
Top three noisy pixels from each quadrant. If the there are fewer than three noisy pixels in the level2.evt file, extra rows are filled as -1
| Pixel properties | Quadrant properties | ||||||
|---|---|---|---|---|---|---|---|
| Quadrant | DetID | PixID | Counts | Sigma | Mean | Median | Sigma |
| A | 13 | 251 | 600683 | 6805.78 | 431 | 423 | 88.2 |
| A | 3 | 80 | 75482 | 851.02 | 431 | 423 | 88.2 |
| A | 13 | 253 | 5277 | 55.03 | 431 | 423 | 88.2 |
| B | 4 | 239 | 153830 | 1531.74 | 522 | 509 | 100.1 |
| B | 0 | 214 | 32023 | 314.84 | 522 | 509 | 100.1 |
| B | 11 | 51 | 16746 | 162.21 | 522 | 509 | 100.1 |
| C | 14 | 234 | 6506 | 46.26 | 554 | 558 | 128.6 |
| C | 13 | 61 | 4131 | 27.79 | 554 | 558 | 128.6 |
| C | 12 | 4 | 1710 | 8.96 | 554 | 558 | 128.6 |
| D | 8 | 195 | 356240 | 2375.95 | 624 | 608 | 149.7 |
| D | 1 | 20 | 137185 | 912.46 | 624 | 608 | 149.7 |
| D | 2 | 234 | 21767 | 141.36 | 624 | 608 | 149.7 |
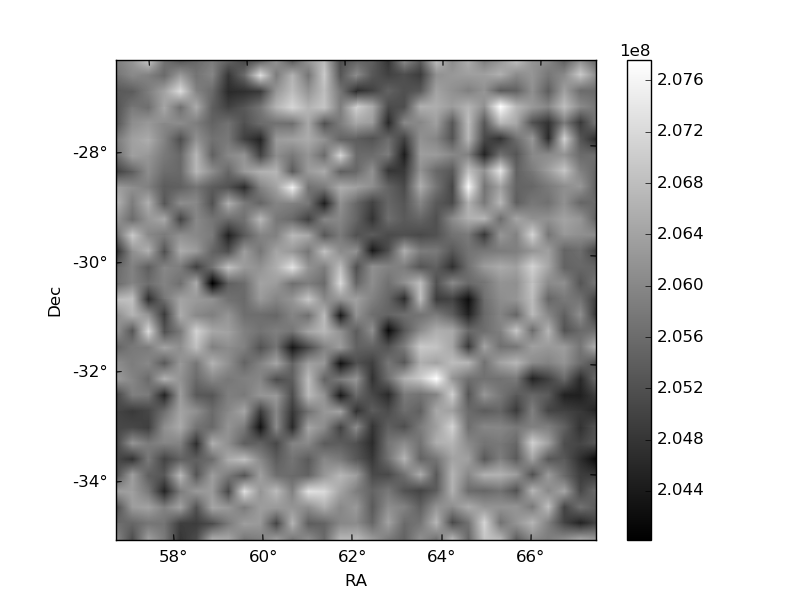
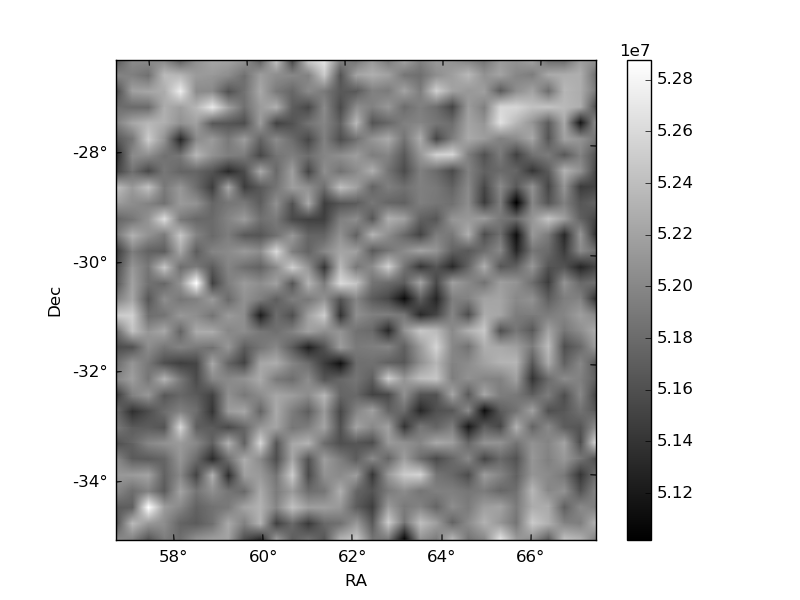
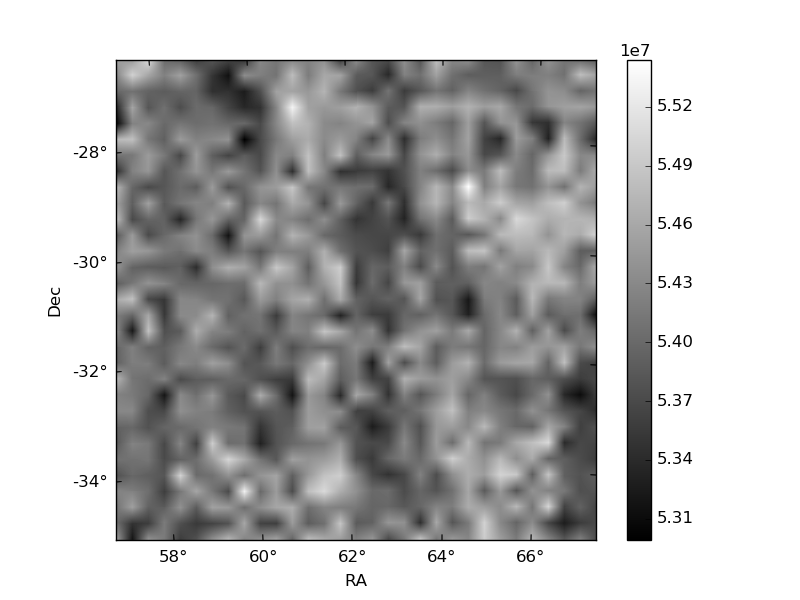
Histogram calculated using DETX and DETY for each event in the final _common_clean file
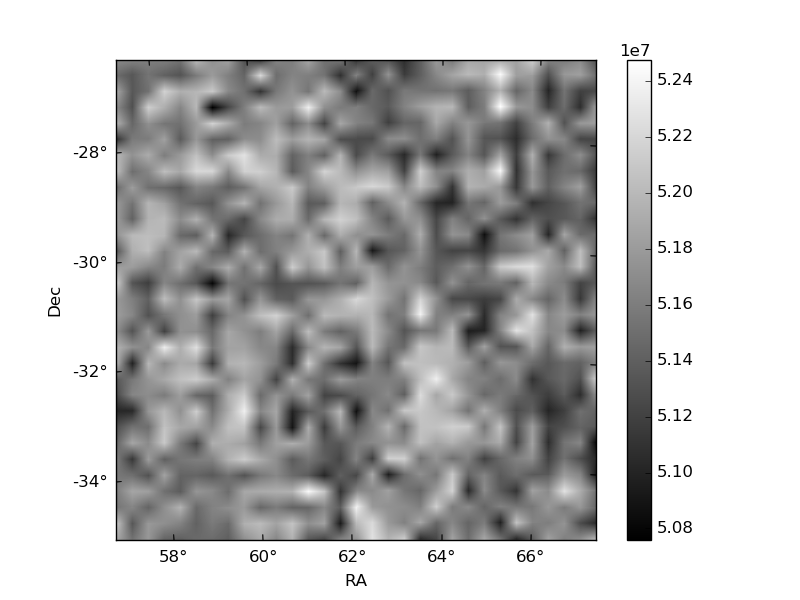
| Quadrant A | 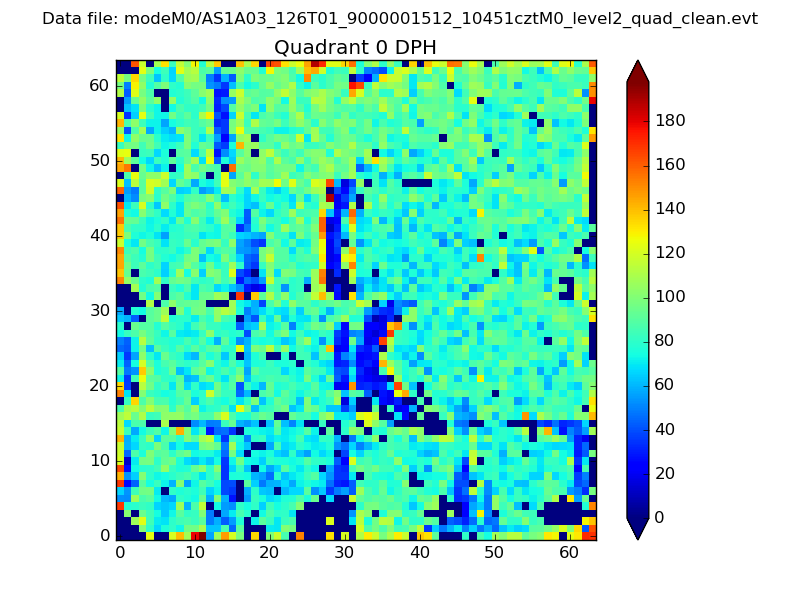 |
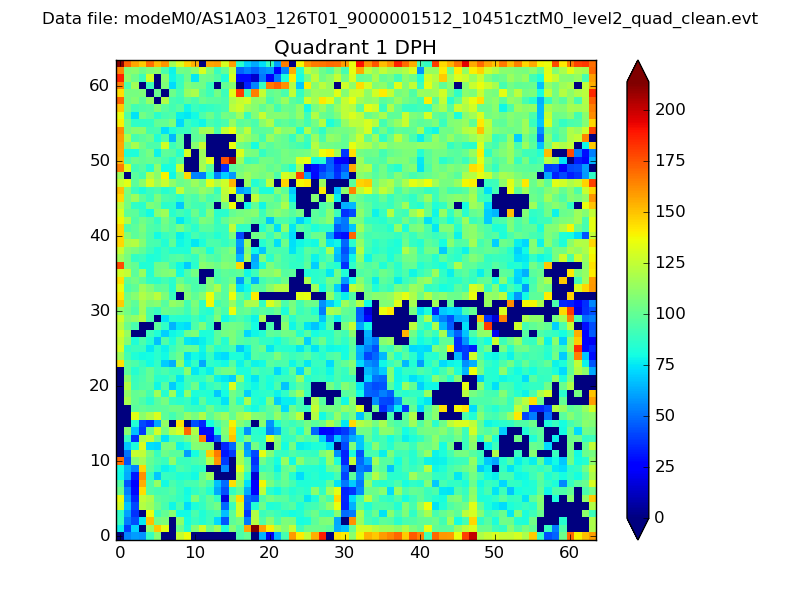 |
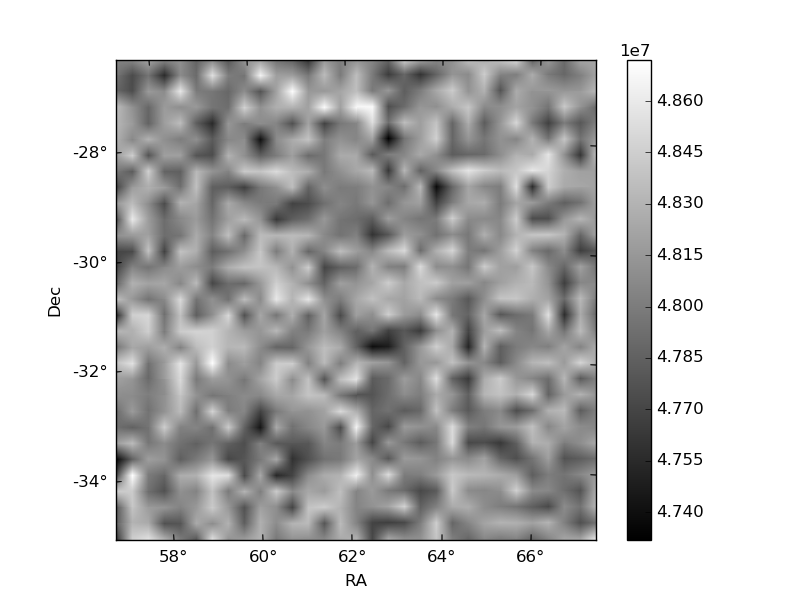
Quadrant B |
|---|---|---|---|
| Quadrant D | 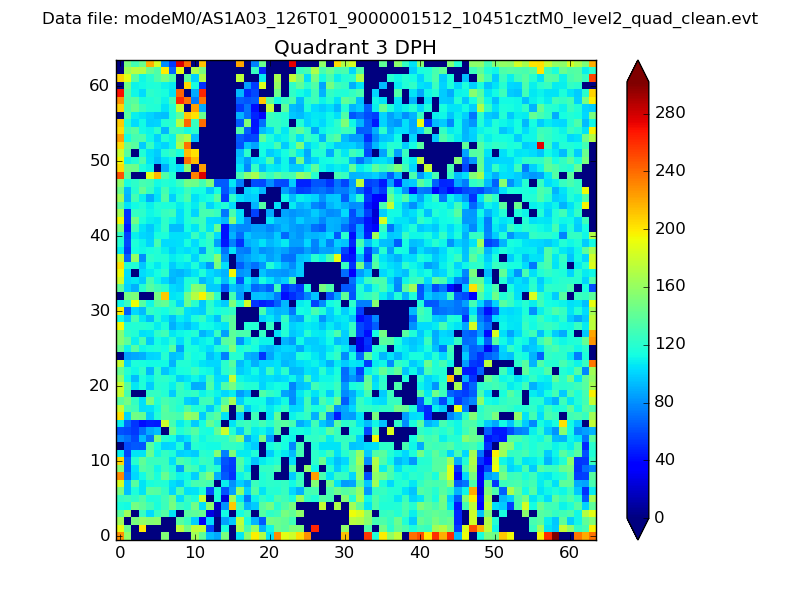 |
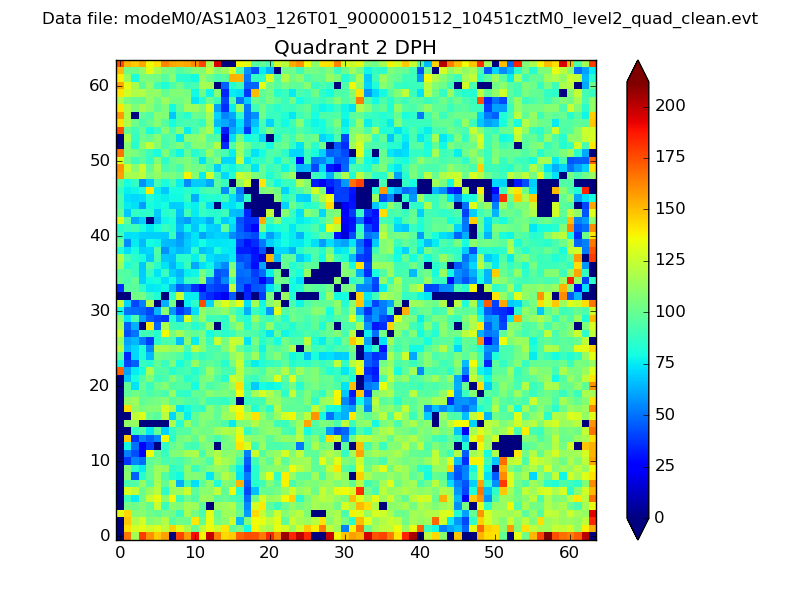 |
Quadrant C |
| Plot type | Count rate plots | Images |
|---|---|---|
| Comparison with Poisson distribution Blue bars denote a histogram of data divided into 1 sec bins. Red curve is a Poisson curve with rate = median count rate of data. |
 |
 |
| Quadrant-wise count rates Data is divided into 100 sec bins |
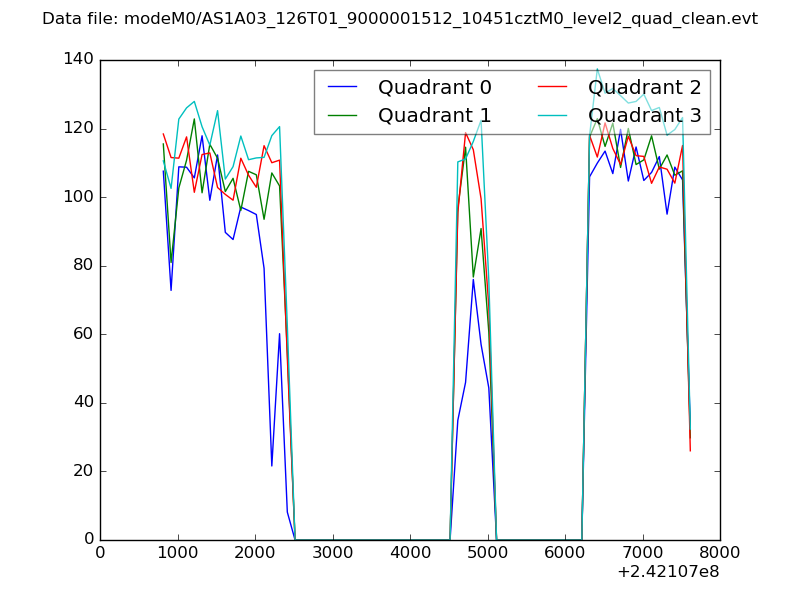 |
|
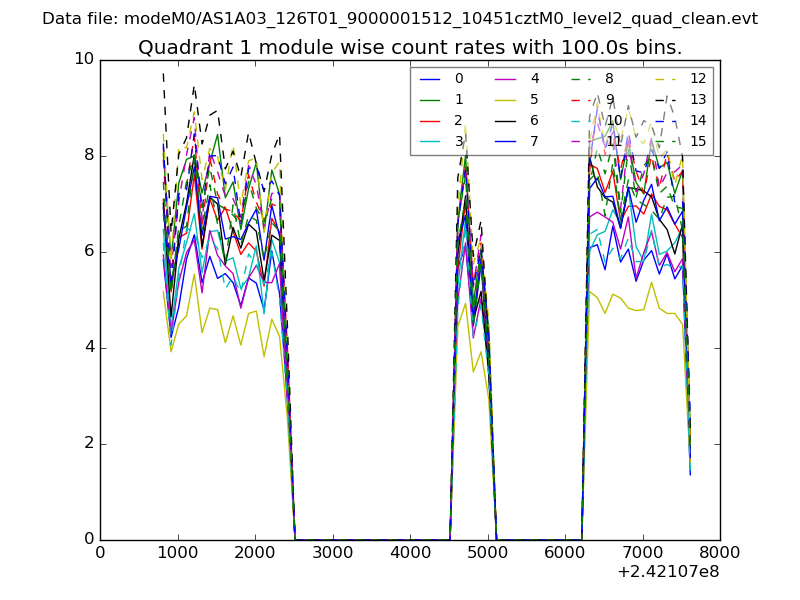
| Module-wise count rates for Quadrant A Data is divided into 100 sec bins |
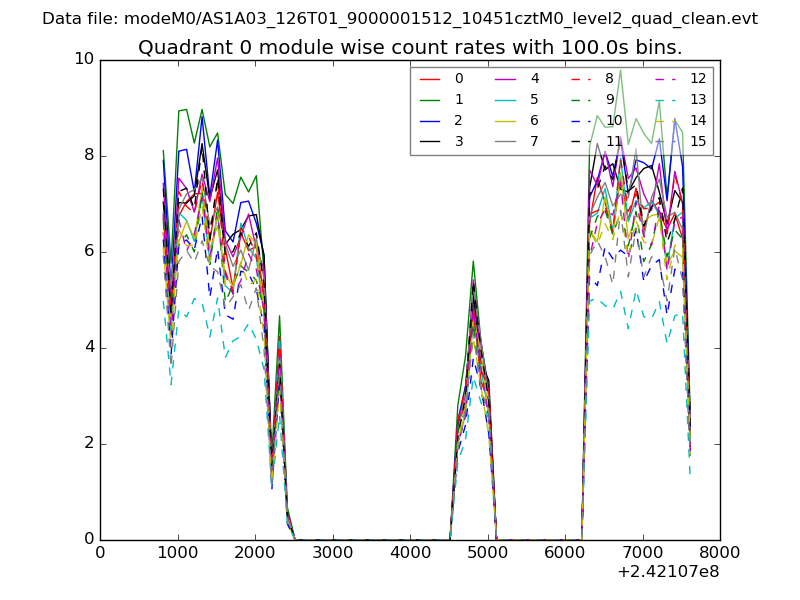 |
 |
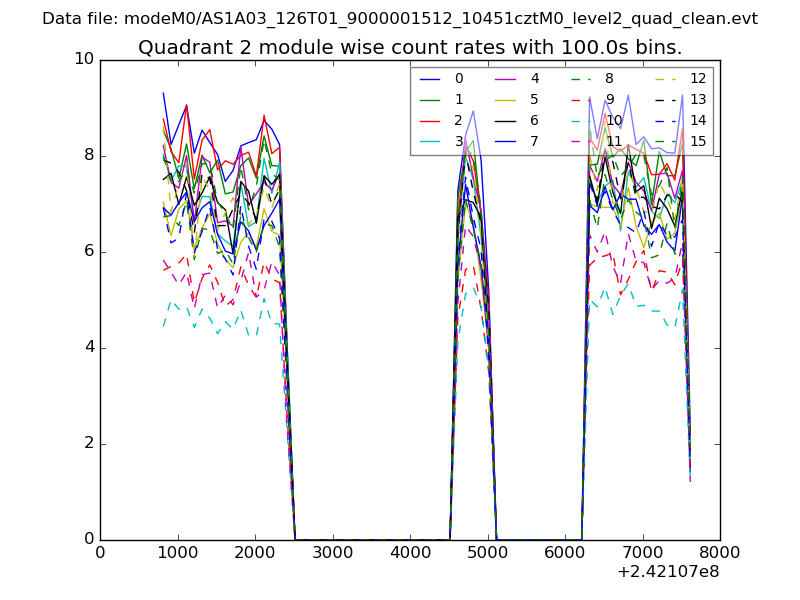
| Module-wise count rates for Quadrant B Data is divided into 100 sec bins |
 |
 |
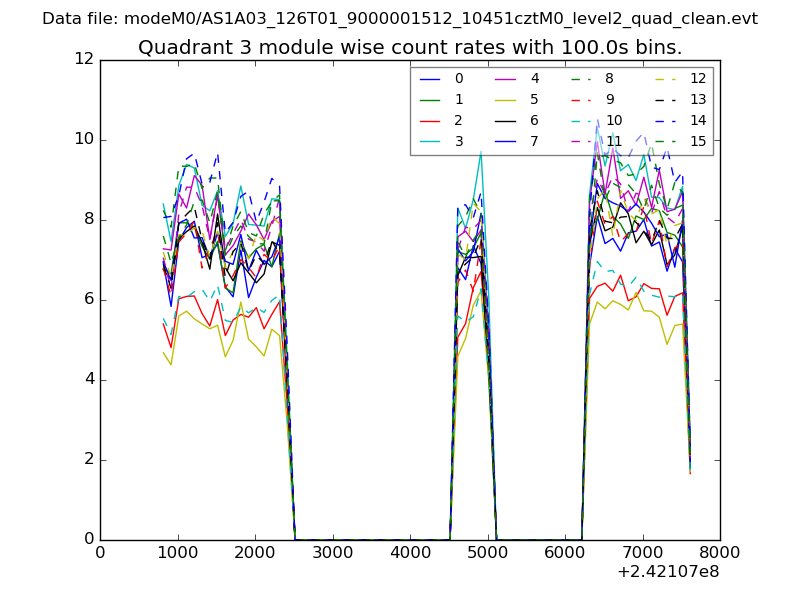
| Module-wise count rates for Quadrant C Data is divided into 100 sec bins |
 |
 |
| Module-wise count rates for Quadrant D Data is divided into 100 sec bins |
 |
 |
| Parameter | Plot |
|---|---|
| CZT HV Monitor | 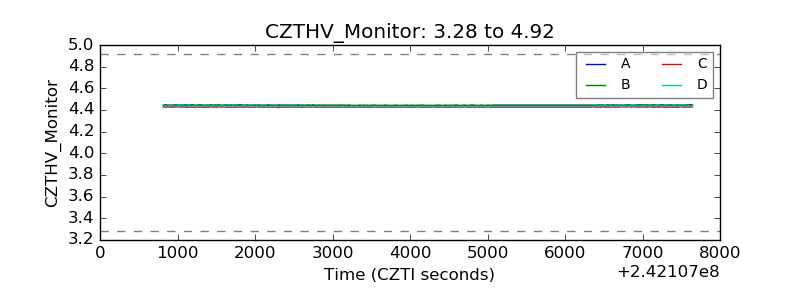 |
| D_VDD | 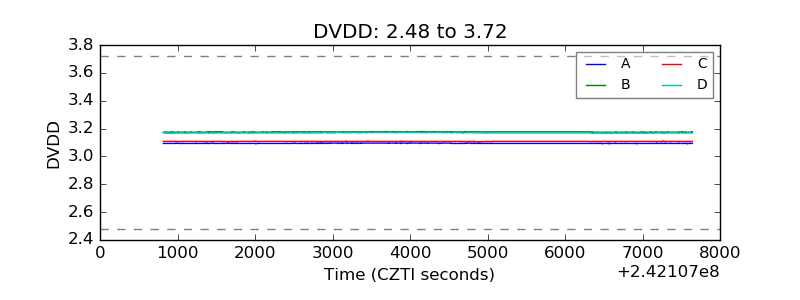 |
| Temperature 1 |  |
| Veto HV Monitor | 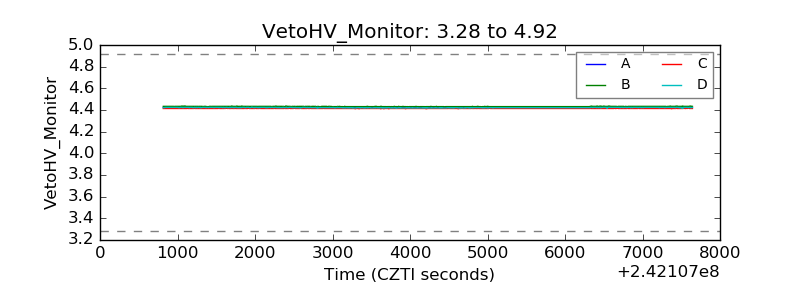 |
| Veto LLD | 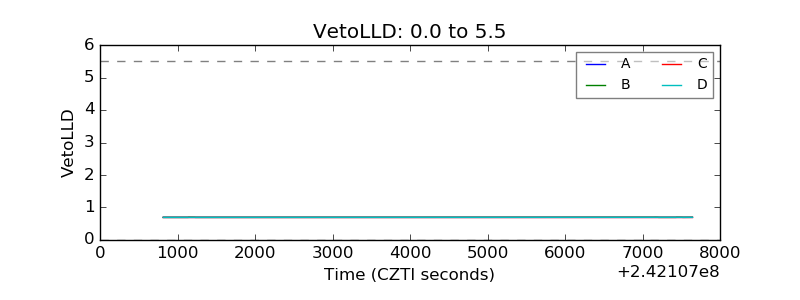 |
| Alpha Counter |  |
| _CPM_Rate | 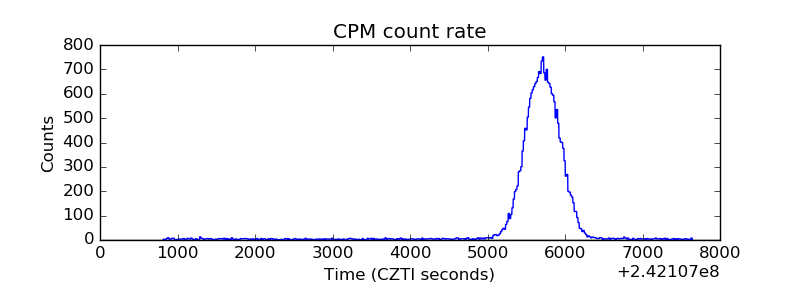 |
| CZT Counter |  |
| +2.5 Volts monitor |  |
| +5 Volts monitor |  |
| _ROLL_ROT | 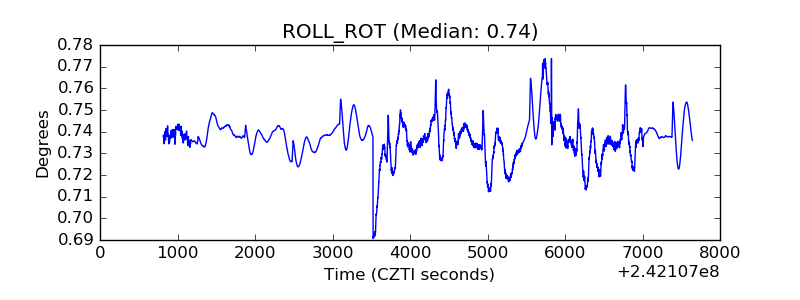 |
| _Roll_DEC | 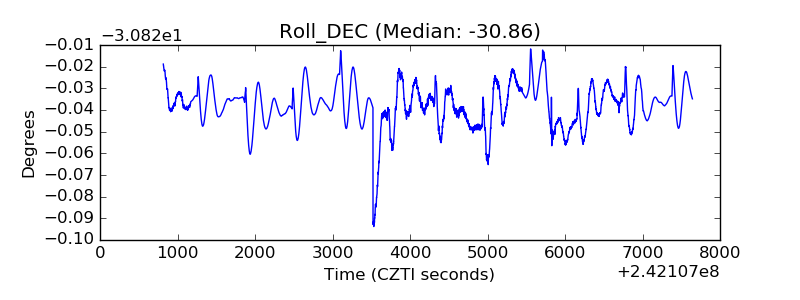 |
| _Roll_RA |  |
| Veto Counter | 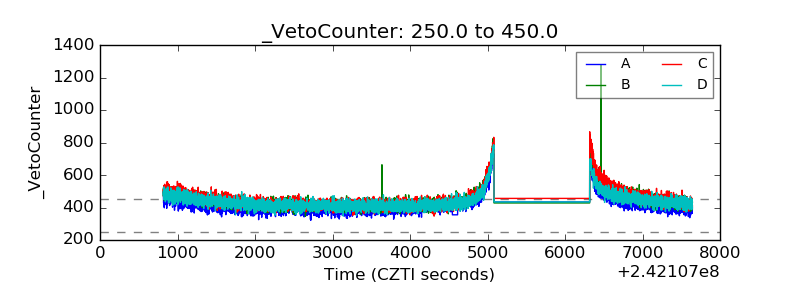 |