| Param | Original file | Final file |
|---|---|---|
| Filename | modeM0/AS1A03_126T01_9000001512_10453cztM0_level2.evt | modeM0/AS1A03_126T01_9000001512_10453cztM0_level2_quad_clean.evt |
| Size (bytes) | 487,045,440 | 74,180,160 |
| Size | 464.5 MB | 70.7 MB |
| Events in quadrant A | 3,989,556 | 453,567 |
| Events in quadrant B | 3,833,332 | 458,584 |
| Events in quadrant C | 2,852,930 | 460,618 |
| Events in quadrant D | 3,647,783 | 434,700 |
| Mode SS | |||
|---|---|---|---|
| Quadrant | BADHDUFLAG | Total packets | Discarded packets |
| A | 0 | 128 | 0 |
| B | 0 | 128 | 0 |
| C | 0 | 128 | 0 |
| D | 0 | 128 | 0 |
| Mode M0 | |||
|---|---|---|---|
| Quadrant | BADHDUFLAG | Total packets | Discarded packets |
| A | 0 | 16222 | 115 |
| B | 0 | 15563 | 89 |
| C | 0 | 12940 | 69 |
| D | 0 | 14791 | 94 |
| Mode M9 | |||
|---|---|---|---|
| Quadrant | BADHDUFLAG | Total packets | Discarded packets |
| A | 0 | 6 | 0 |
| B | 0 | 6 | 0 |
| C | 0 | 6 | 0 |
| D | 0 | 6 | 0 |
| Quadrant | Total seconds | Saturated seconds | Saturation percentage |
|---|---|---|---|
| A | 6277 | 133 | 2.118847% |
| B | 6285 | 331 | 5.266508% |
| C | 6283 | 79 | 1.257361% |
| D | 6280 | 133 | 2.117834% |
Noise dominated data is calculated using 1-second bins in cleaned event files. If a bin has >2000 counts, and if more than 50% of those come from <1% of pixels, then it is considered to be noise-dominated and hence unusable.
| Quadrant | # 1 sec bins | Bins with >0 counts | Bins with >2000 counts | High rate bins dominated by noise | Noise dominated (total time) | Noise dominated (detector-on time) | Marked lightcurve |
|---|---|---|---|---|---|---|---|
| A | 6967 | 6316 | 1 | 1 | 0.01% | 0.02% | 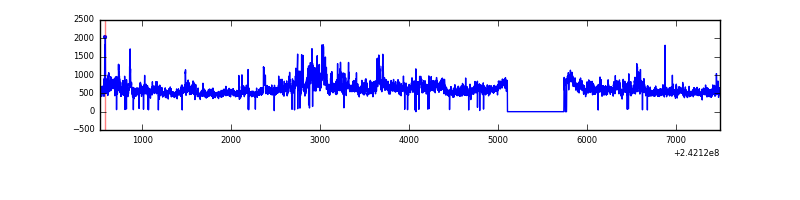 |
| B | 6967 | 6315 | 115 | 115 | 1.65% | 1.82% | 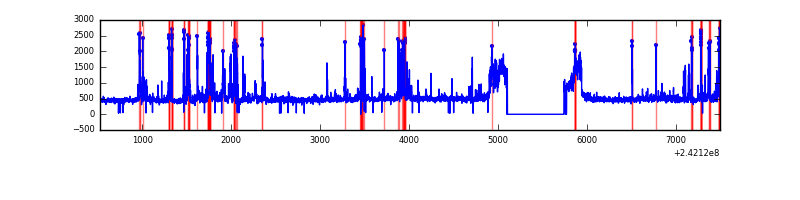 |
| C | 6967 | 6318 | 5 | 5 | 0.07% | 0.08% | 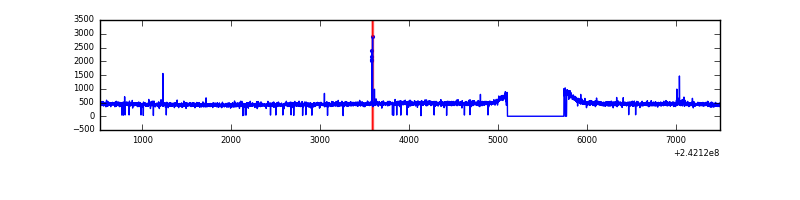 |
| D | 6967 | 6315 | 47 | 47 | 0.67% | 0.74% |  |
Top three noisy pixels from each quadrant. If the there are fewer than three noisy pixels in the level2.evt file, extra rows are filled as -1
| Pixel properties | Quadrant properties | ||||||
|---|---|---|---|---|---|---|---|
| Quadrant | DetID | PixID | Counts | Sigma | Mean | Median | Sigma |
| A | 13 | 251 | 1000742 | 6633.47 | 737 | 721 | 150.8 |
| A | 3 | 80 | 88343 | 581.23 | 737 | 721 | 150.8 |
| A | 15 | 174 | 15941 | 100.96 | 737 | 721 | 150.8 |
| B | 4 | 239 | 573992 | 4073.15 | 727 | 708 | 140.7 |
| B | 10 | 245 | 300914 | 2132.95 | 727 | 708 | 140.7 |
| B | 0 | 214 | 62577 | 439.58 | 727 | 708 | 140.7 |
| C | 14 | 234 | 24991 | 144.29 | 724 | 728 | 168.2 |
| C | 13 | 61 | 5349 | 27.48 | 724 | 728 | 168.2 |
| C | 8 | 222 | 2706 | 11.76 | 724 | 728 | 168.2 |
| D | 8 | 195 | 314492 | 1803.75 | 719 | 699 | 174.0 |
| D | 1 | 20 | 237662 | 1362.11 | 719 | 699 | 174.0 |
| D | 12 | 233 | 126729 | 724.45 | 719 | 699 | 174.0 |
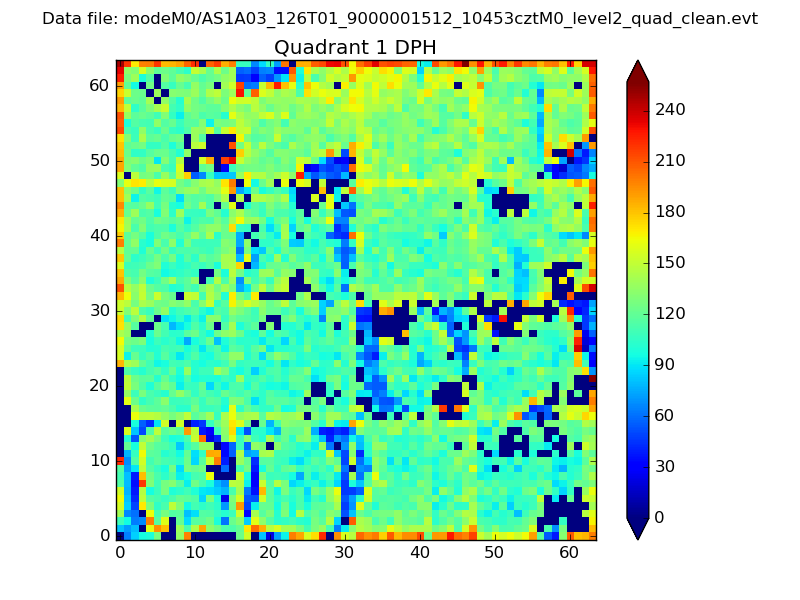
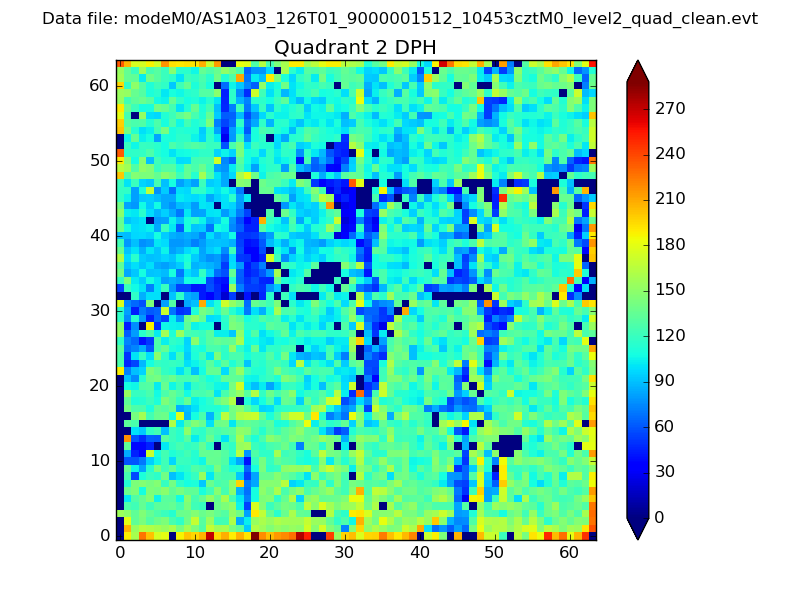
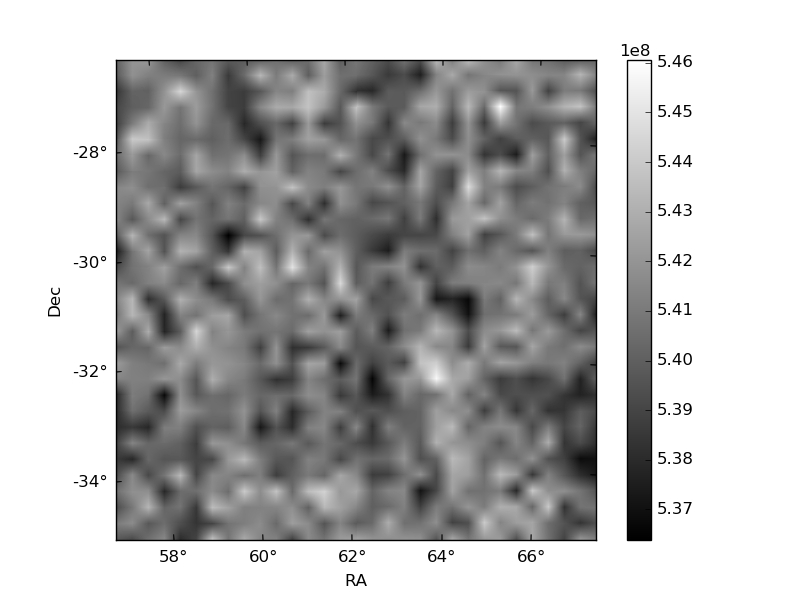
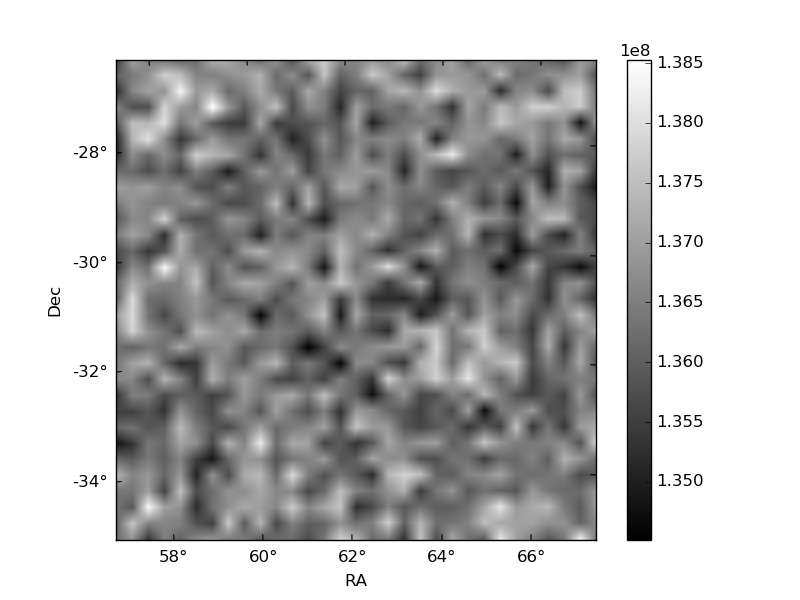
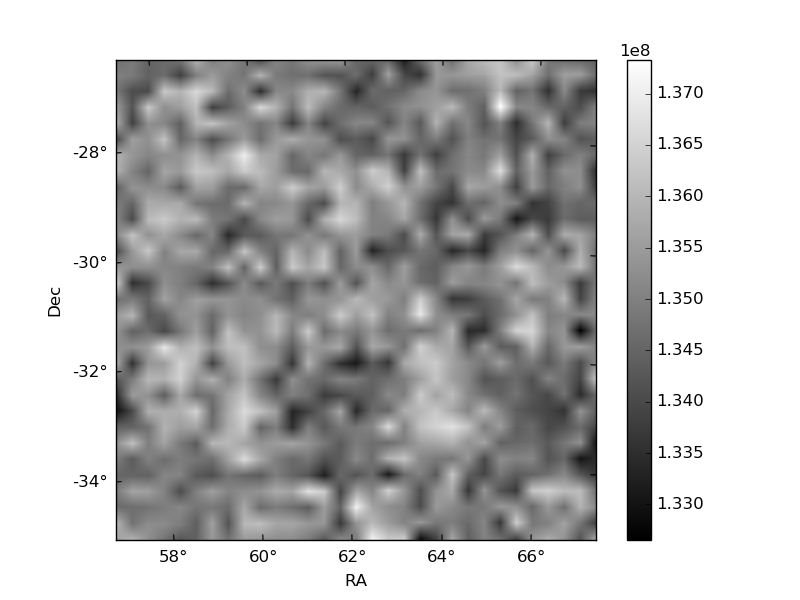
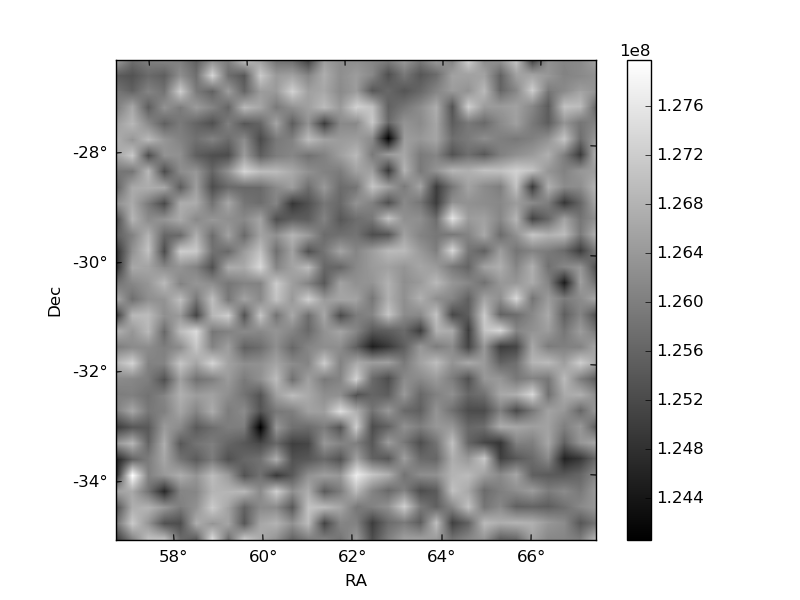
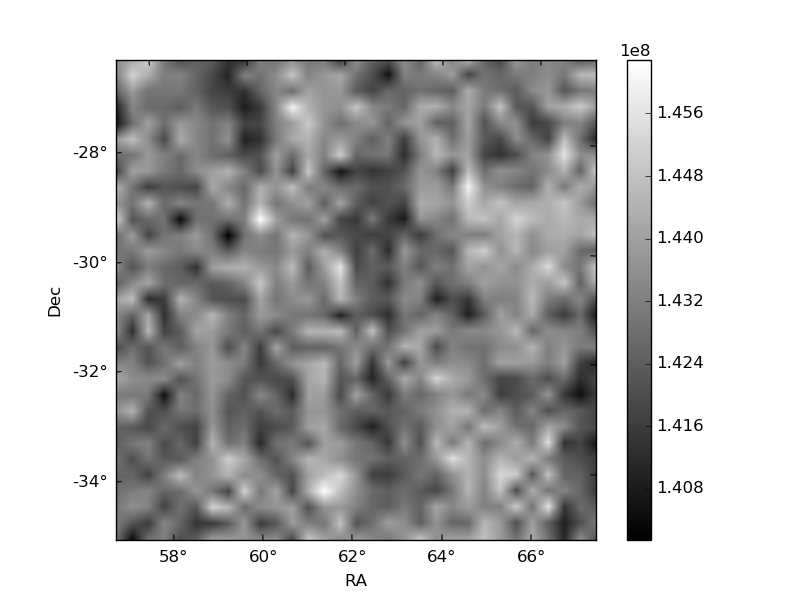
Histogram calculated using DETX and DETY for each event in the final _common_clean file
| Quadrant A | 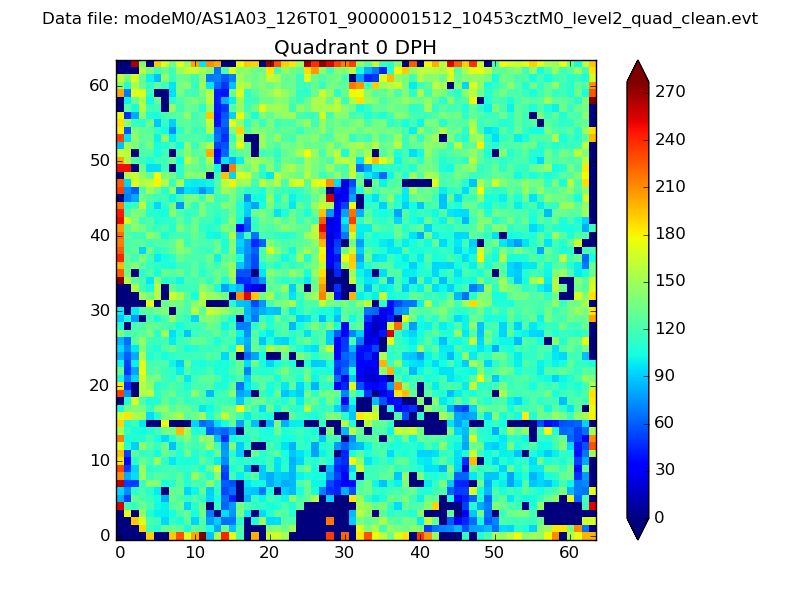 |
 |
Quadrant B |
|---|---|---|---|
| Quadrant D | 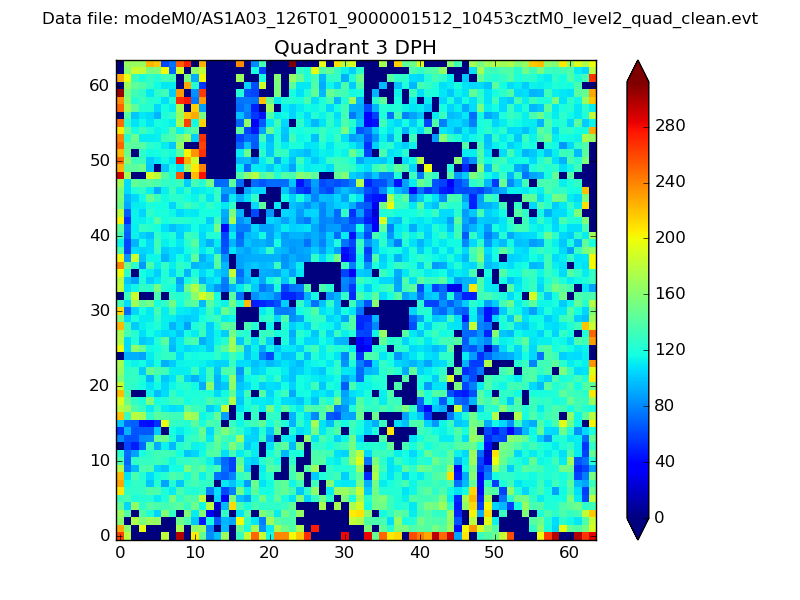 |
 |
Quadrant C |
| Plot type | Count rate plots | Images |
|---|---|---|
| Comparison with Poisson distribution Blue bars denote a histogram of data divided into 1 sec bins. Red curve is a Poisson curve with rate = median count rate of data. |
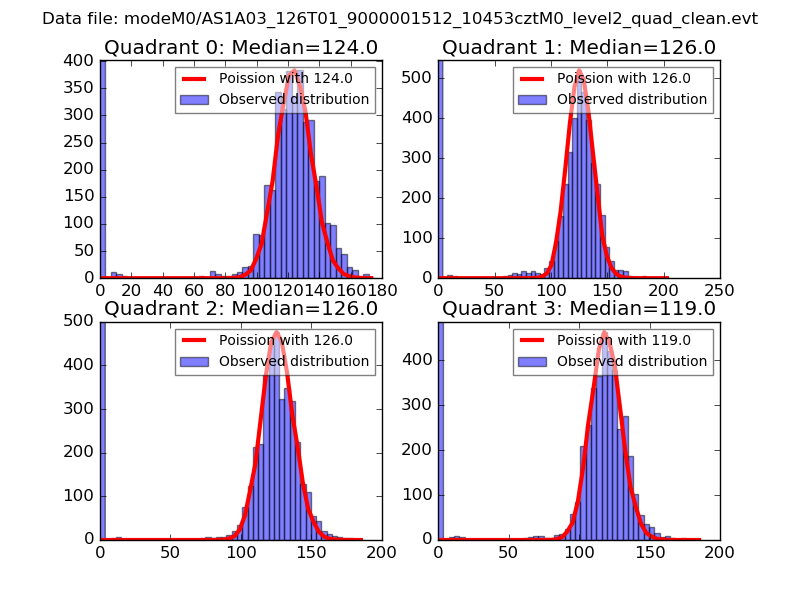 |
 |
| Quadrant-wise count rates Data is divided into 100 sec bins |
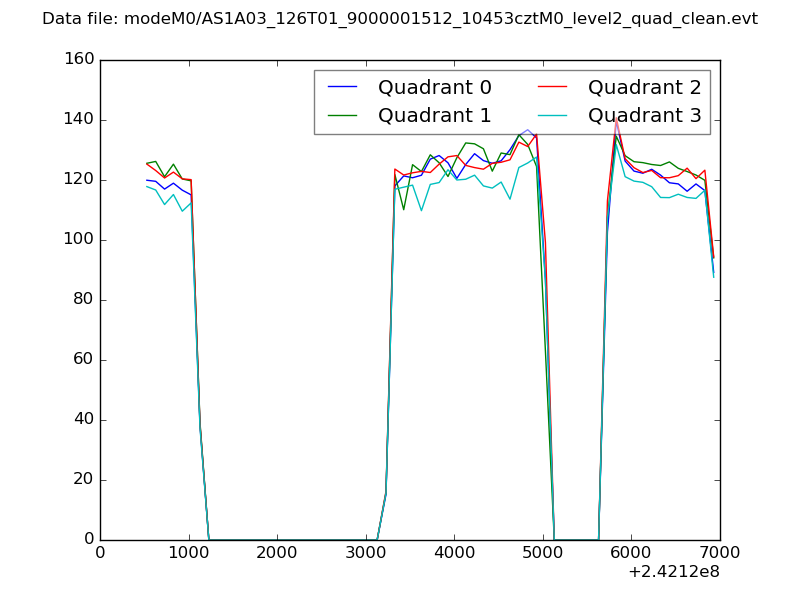 |
|
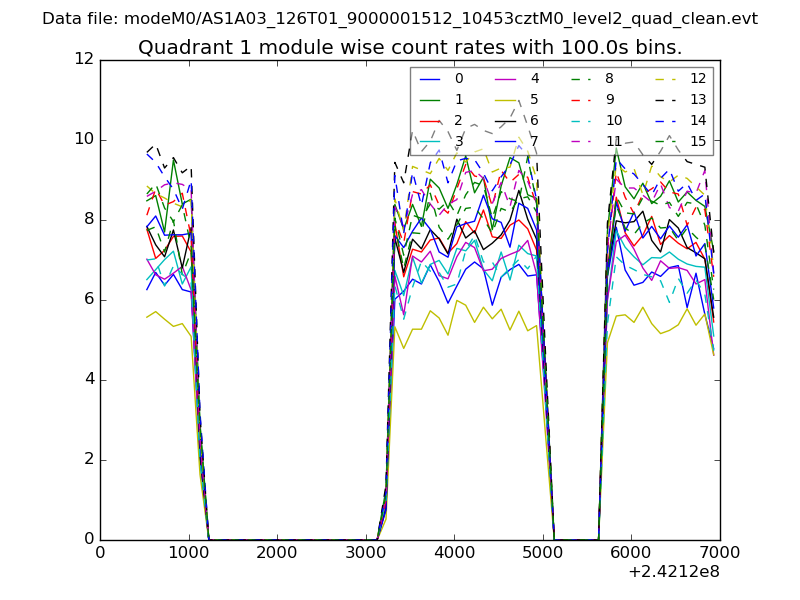
| Module-wise count rates for Quadrant A Data is divided into 100 sec bins |
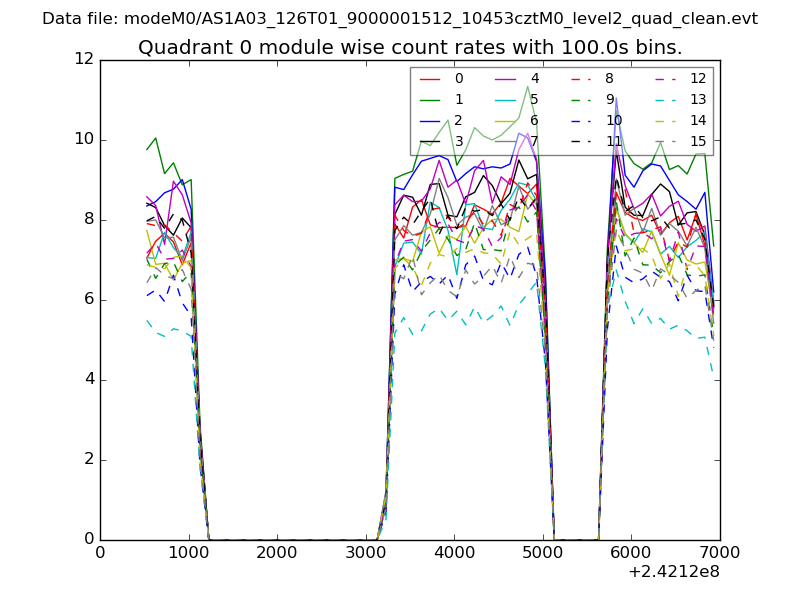 |
 |
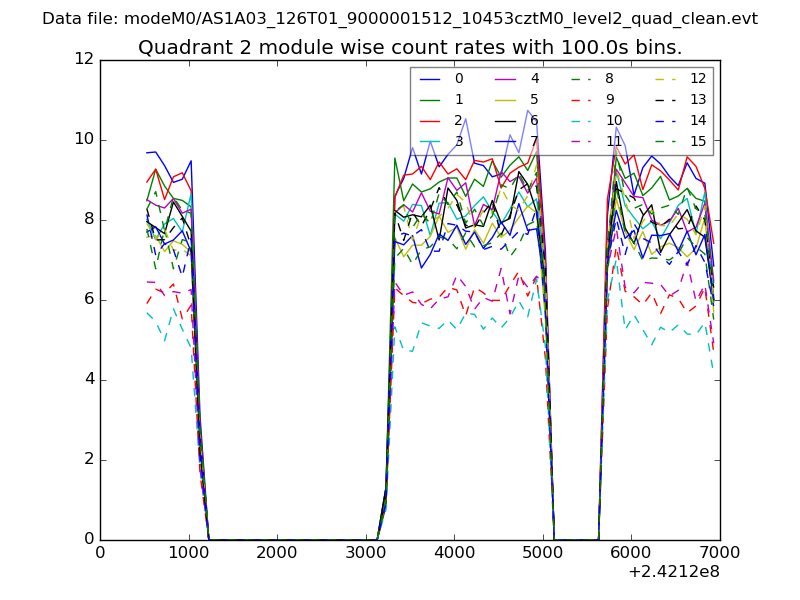
| Module-wise count rates for Quadrant B Data is divided into 100 sec bins |
 |
 |
| Module-wise count rates for Quadrant C Data is divided into 100 sec bins |
 |
 |
| Module-wise count rates for Quadrant D Data is divided into 100 sec bins |
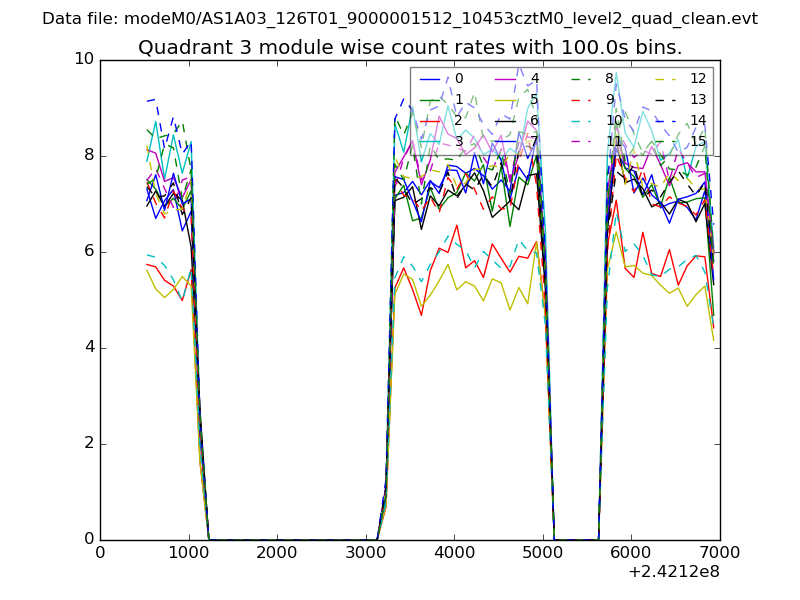 |
 |
| Parameter | Plot |
|---|---|
| CZT HV Monitor | 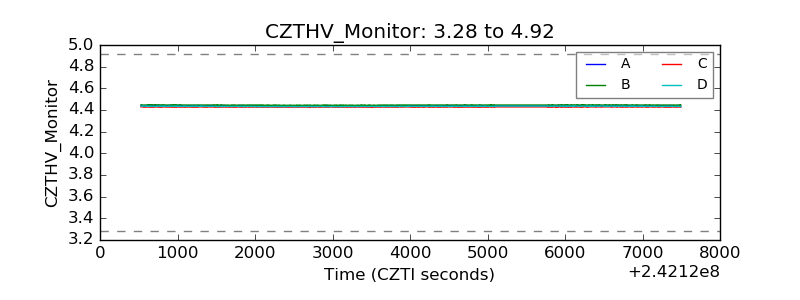 |
| D_VDD | 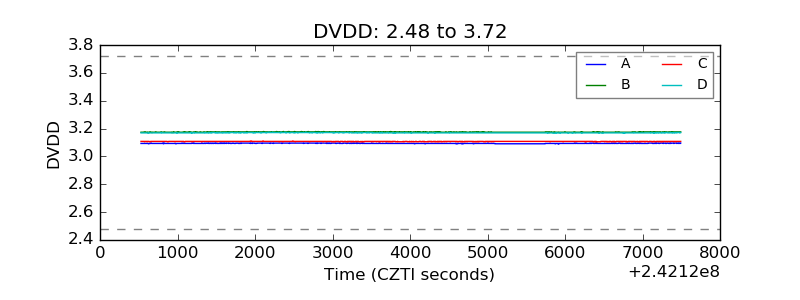 |
| Temperature 1 | 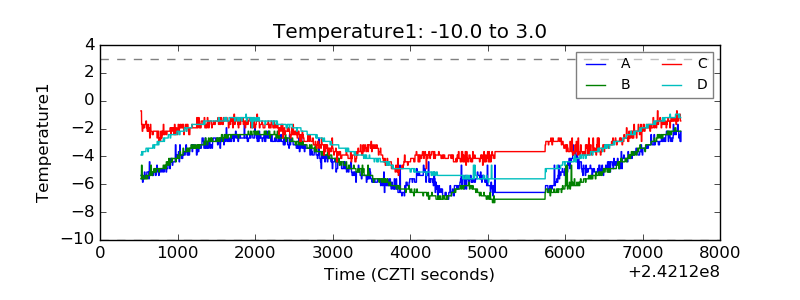 |
| Veto HV Monitor | 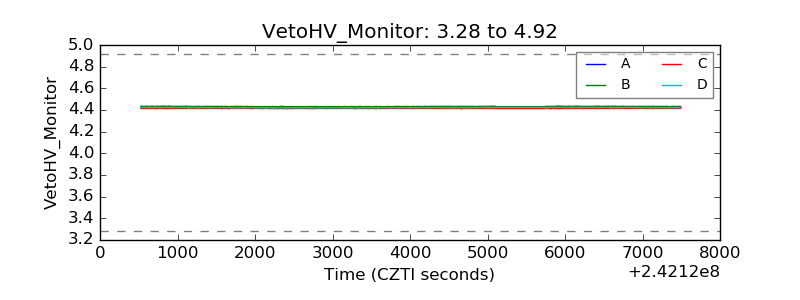 |
| Veto LLD | 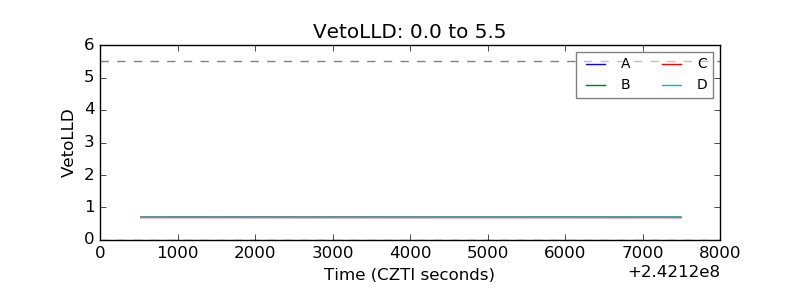 |
| Alpha Counter | 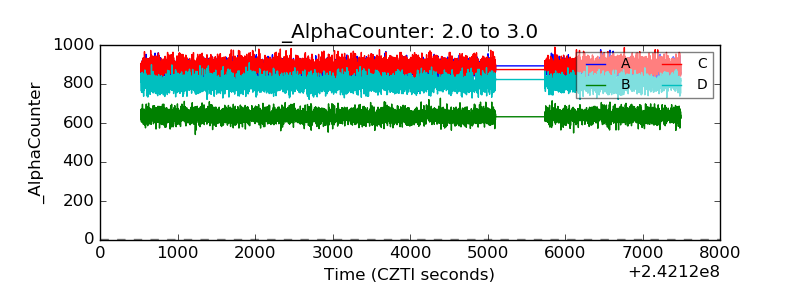 |
| _CPM_Rate | 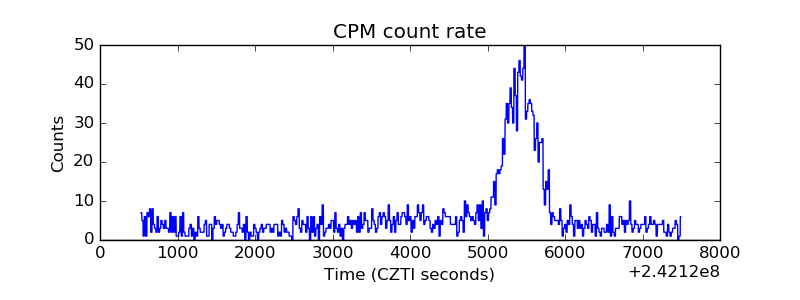 |
| CZT Counter | 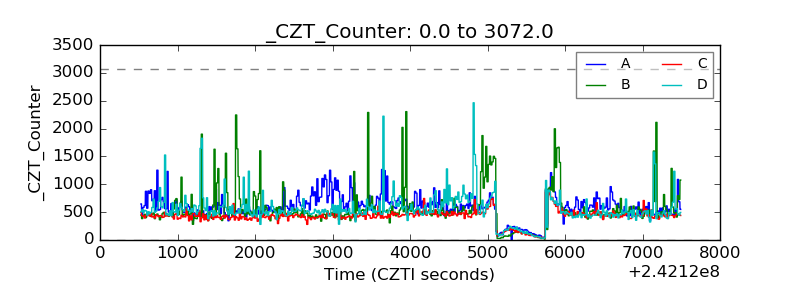 |
| +2.5 Volts monitor | 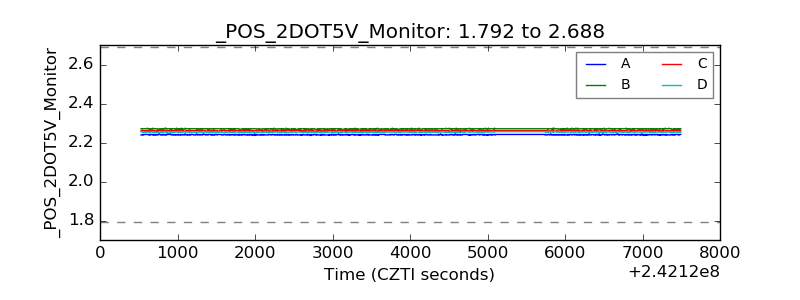 |
| +5 Volts monitor | 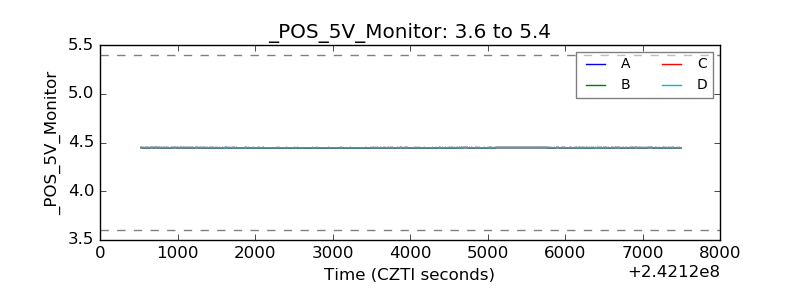 |
| _ROLL_ROT |  |
| _Roll_DEC | 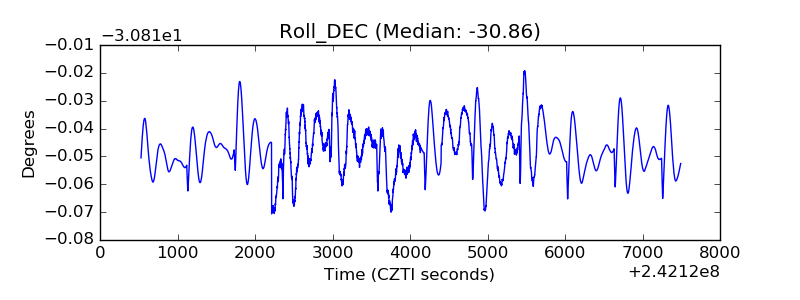 |
| _Roll_RA | 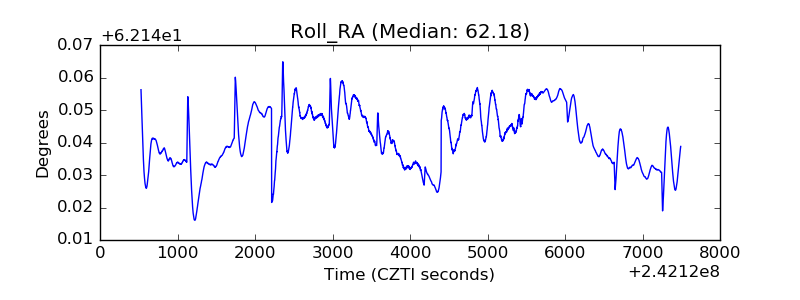 |
| Veto Counter | 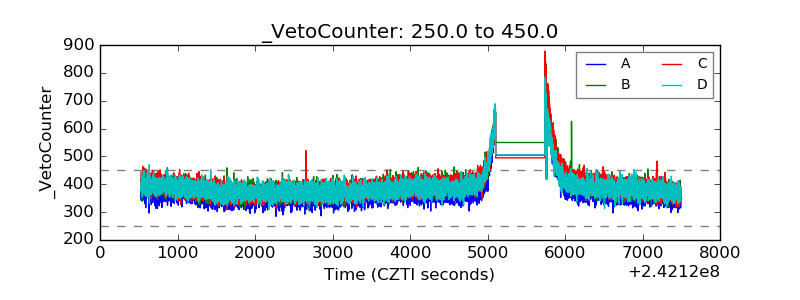 |