| Param | Original file | Final file |
|---|---|---|
| Filename | modeM0/AS1A03_126T01_9000001512_10454cztM0_level2.evt | modeM0/AS1A03_126T01_9000001512_10454cztM0_level2_quad_clean.evt |
| Size (bytes) | 501,577,920 | 70,934,400 |
| Size | 478.3 MB | 67.6 MB |
| Events in quadrant A | 3,655,504 | 386,976 |
| Events in quadrant B | 3,604,105 | 437,030 |
| Events in quadrant C | 2,890,222 | 436,032 |
| Events in quadrant D | 4,613,462 | 448,989 |
| Mode SS | |||
|---|---|---|---|
| Quadrant | BADHDUFLAG | Total packets | Discarded packets |
| A | 0 | 212 | 72 |
| B | 0 | 212 | 79 |
| C | 0 | 212 | 74 |
| D | 0 | 206 | 70 |
| Mode M0 | |||
|---|---|---|---|
| Quadrant | BADHDUFLAG | Total packets | Discarded packets |
| A | 0 | 29440 | 14853 |
| B | 0 | 24946 | 10275 |
| C | 0 | 21579 | 8496 |
| D | 0 | 25664 | 7659 |
| Mode M9 | |||
|---|---|---|---|
| Quadrant | BADHDUFLAG | Total packets | Discarded packets |
| A | 0 | 2 | 1 |
| B | 0 | 2 | 1 |
| C | 0 | 2 | 1 |
| D | 0 | 2 | 1 |
| Quadrant | Total seconds | Saturated seconds | Saturation percentage |
|---|---|---|---|
| A | 5700 | 152 | 2.666667% |
| B | 6218 | 301 | 4.840785% |
| C | 6351 | 108 | 1.700520% |
| D | 6787 | 478 | 7.042876% |
Noise dominated data is calculated using 1-second bins in cleaned event files. If a bin has >2000 counts, and if more than 50% of those come from <1% of pixels, then it is considered to be noise-dominated and hence unusable.
| Quadrant | # 1 sec bins | Bins with >0 counts | Bins with >2000 counts | High rate bins dominated by noise | Noise dominated (total time) | Noise dominated (detector-on time) | Marked lightcurve |
|---|---|---|---|---|---|---|---|
| A | 7212 | 6279 | 0 | 0 | 0.00% | 0.00% | 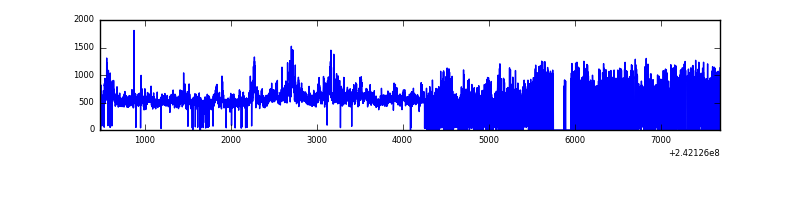 |
| B | 7212 | 6698 | 121 | 121 | 1.68% | 1.81% | 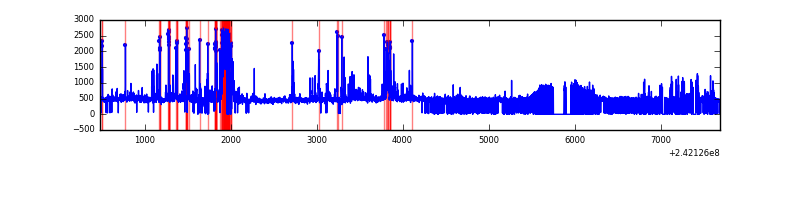 |
| C | 7212 | 6825 | 3 | 3 | 0.04% | 0.04% | 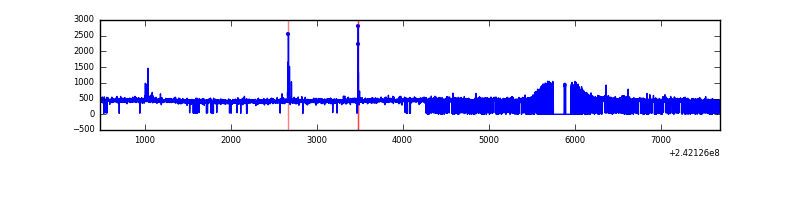 |
| D | 7212 | 6944 | 385 | 385 | 5.34% | 5.54% | 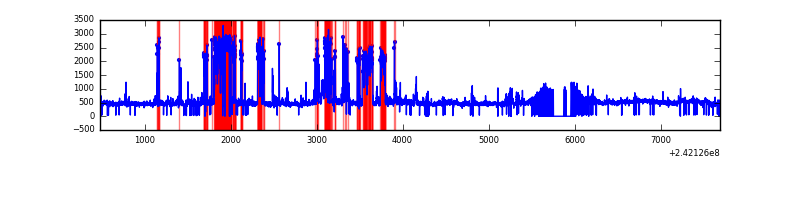 |
Top three noisy pixels from each quadrant. If the there are fewer than three noisy pixels in the level2.evt file, extra rows are filled as -1
| Pixel properties | Quadrant properties | ||||||
|---|---|---|---|---|---|---|---|
| Quadrant | DetID | PixID | Counts | Sigma | Mean | Median | Sigma |
| A | 13 | 251 | 942888 | 6873.13 | 665 | 648 | 137.1 |
| A | 3 | 80 | 98232 | 711.82 | 665 | 648 | 137.1 |
| A | 1 | 162 | 19760 | 139.41 | 665 | 648 | 137.1 |
| B | 4 | 239 | 572120 | 4048.28 | 728 | 710 | 141.1 |
| B | 0 | 214 | 69456 | 487.05 | 728 | 710 | 141.1 |
| B | 11 | 51 | 45273 | 315.72 | 728 | 710 | 141.1 |
| C | 14 | 234 | 29820 | 170.08 | 733 | 738 | 171.0 |
| C | 13 | 61 | 5441 | 27.5 | 733 | 738 | 171.0 |
| C | 14 | 67 | 2878 | 12.52 | 733 | 738 | 171.0 |
| D | 1 | 52 | 569545 | 3046.5 | 774 | 752 | 186.7 |
| D | 13 | 106 | 384758 | 2056.77 | 774 | 752 | 186.7 |
| D | 8 | 195 | 240044 | 1281.67 | 774 | 752 | 186.7 |
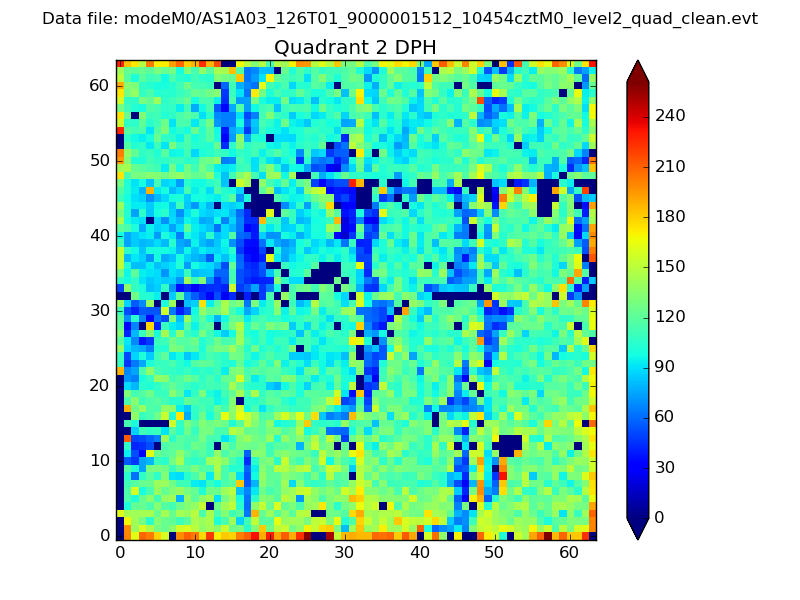
Histogram calculated using DETX and DETY for each event in the final _common_clean file
| Quadrant A | 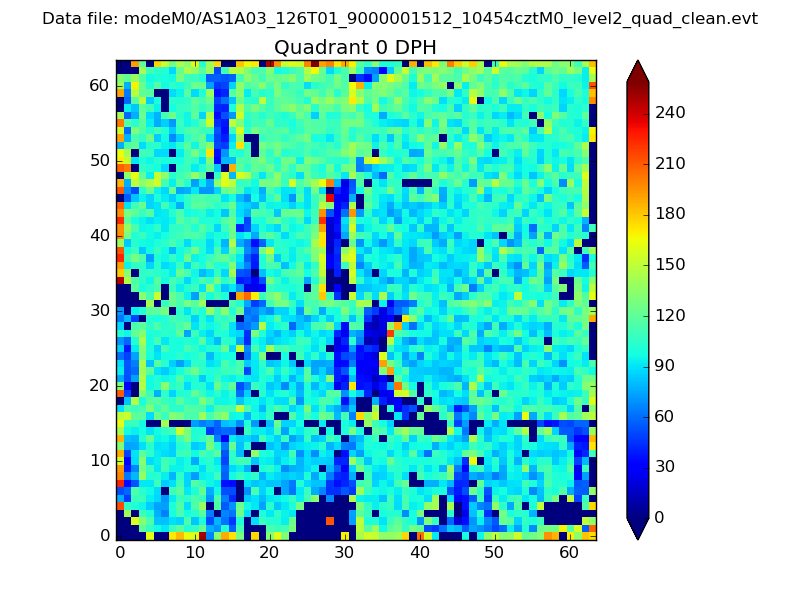 |
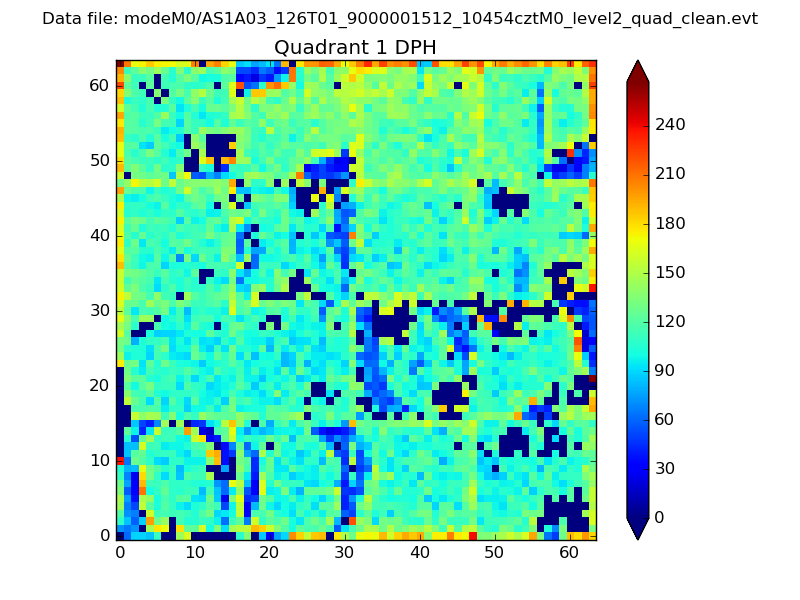 |
Quadrant B |
|---|---|---|---|
| Quadrant D | 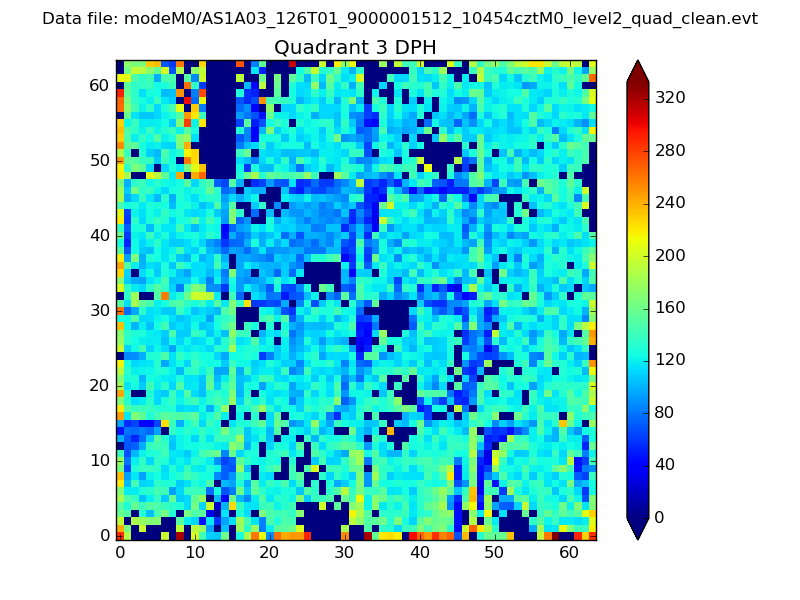 |
 |
Quadrant C |
| Plot type | Count rate plots | Images |
|---|---|---|
| Comparison with Poisson distribution Blue bars denote a histogram of data divided into 1 sec bins. Red curve is a Poisson curve with rate = median count rate of data. |
 |
 |
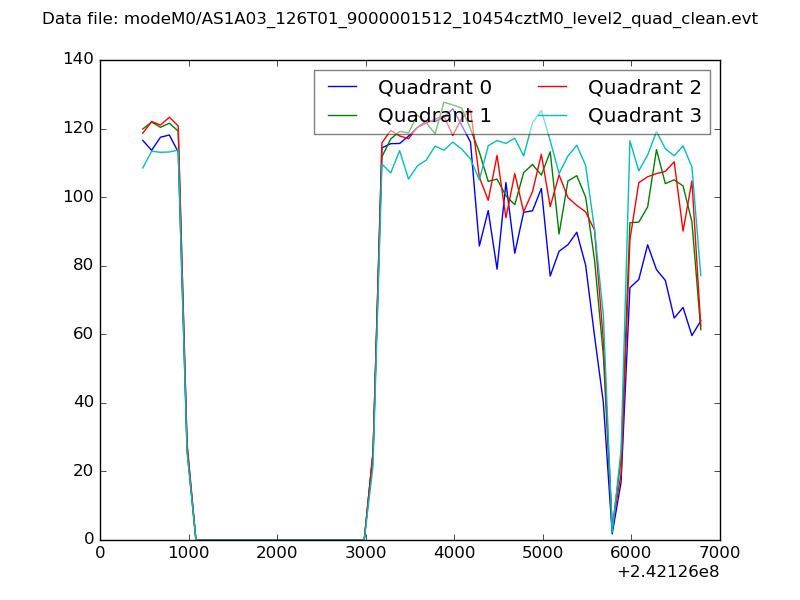
| Quadrant-wise count rates Data is divided into 100 sec bins |
 |
|
| Module-wise count rates for Quadrant A Data is divided into 100 sec bins |
 |
 |
| Module-wise count rates for Quadrant B Data is divided into 100 sec bins |
 |
 |
| Module-wise count rates for Quadrant C Data is divided into 100 sec bins |
 |
 |
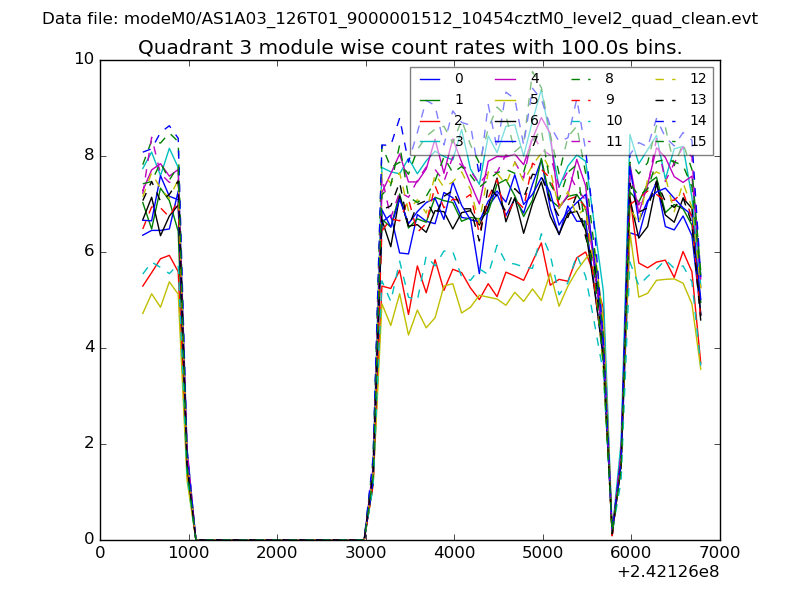
| Module-wise count rates for Quadrant D Data is divided into 100 sec bins |
 |
 |
| Parameter | Plot |
|---|---|
| CZT HV Monitor |  |
| D_VDD | 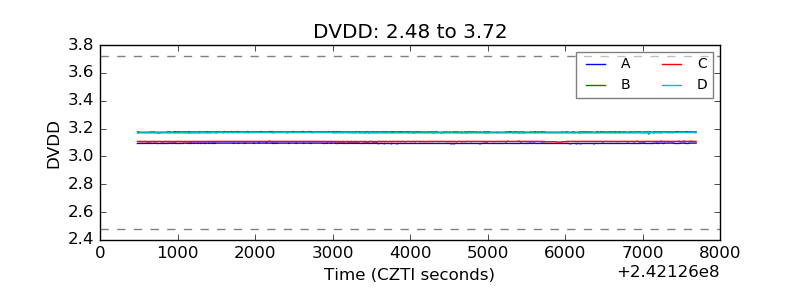 |
| Temperature 1 | 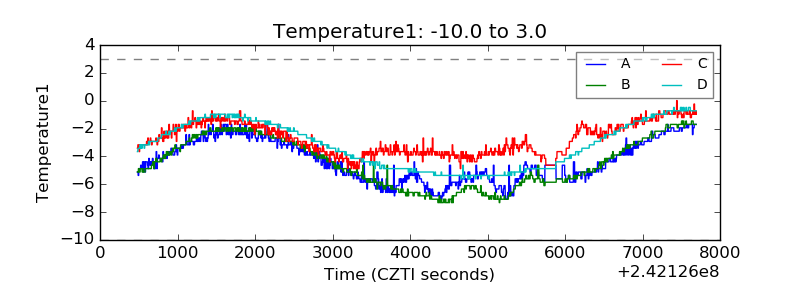 |
| Veto HV Monitor | 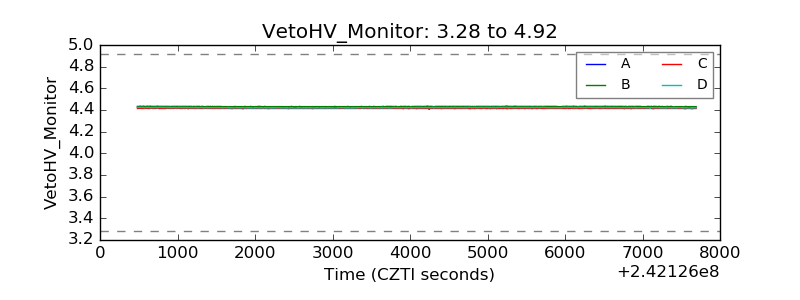 |
| Veto LLD | 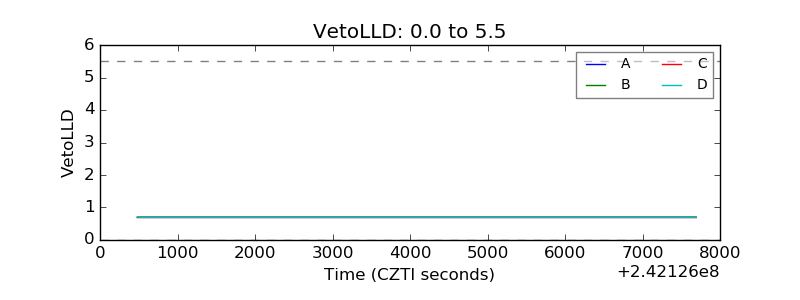 |
| Alpha Counter | 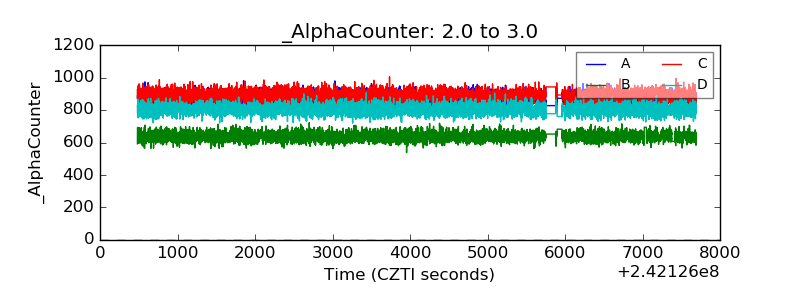 |
| _CPM_Rate | 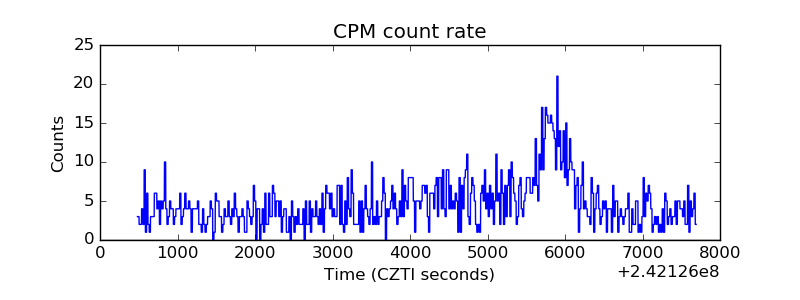 |
| CZT Counter | 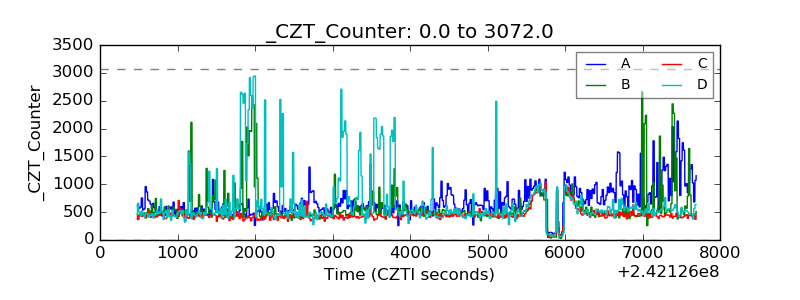 |
| +2.5 Volts monitor |  |
| +5 Volts monitor |  |
| _ROLL_ROT | 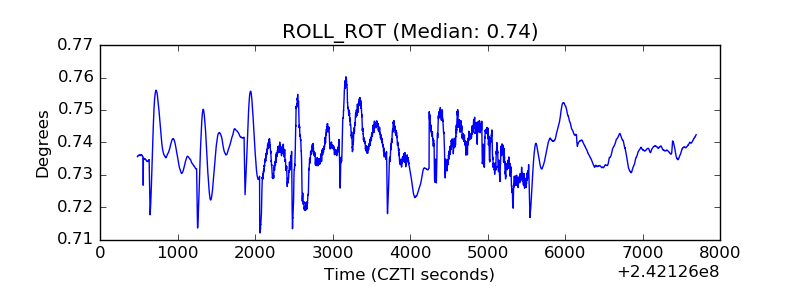 |
| _Roll_DEC | 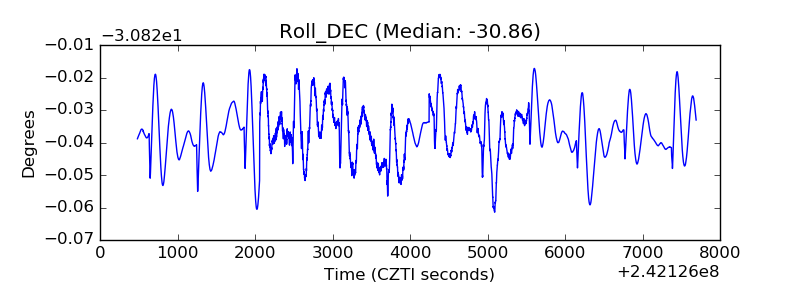 |
| _Roll_RA | 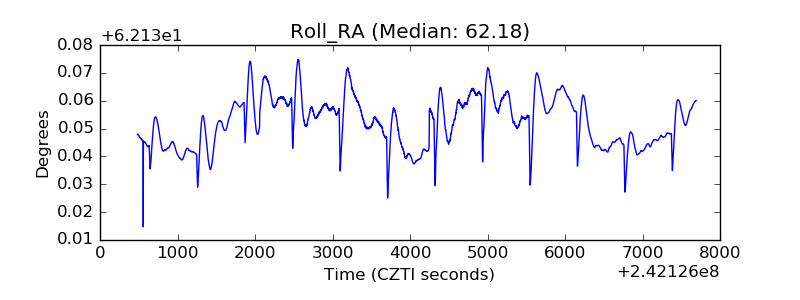 |
| Veto Counter | 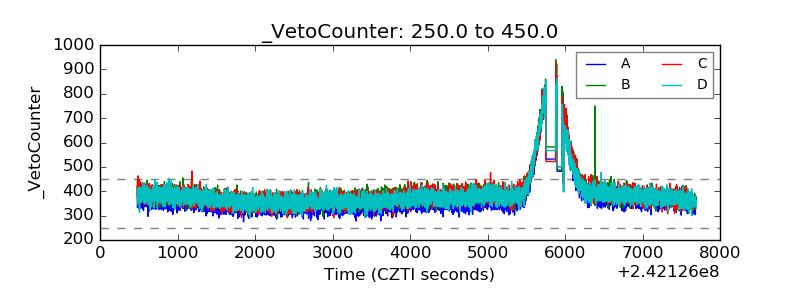 |