| Param | Original file | Final file |
|---|---|---|
| Filename | modeM0/AS1A03_126T01_9000001512_10455cztM0_level2.evt | modeM0/AS1A03_126T01_9000001512_10455cztM0_level2_quad_clean.evt |
| Size (bytes) | 448,159,680 | 67,040,640 |
| Size | 427.4 MB | 63.9 MB |
| Events in quadrant A | 3,484,611 | 315,069 |
| Events in quadrant B | 3,117,158 | 406,027 |
| Events in quadrant C | 2,852,652 | 420,996 |
| Events in quadrant D | 3,708,337 | 467,557 |
| Mode SS | |||
|---|---|---|---|
| Quadrant | BADHDUFLAG | Total packets | Discarded packets |
| A | 0 | 302 | 165 |
| B | 0 | 302 | 158 |
| C | 0 | 302 | 165 |
| D | 0 | 288 | 148 |
| Mode M0 | |||
|---|---|---|---|
| Quadrant | BADHDUFLAG | Total packets | Discarded packets |
| A | 0 | 49184 | 35829 |
| B | 0 | 36007 | 22957 |
| C | 0 | 30420 | 17464 |
| D | 0 | 31713 | 16172 |
| Mode M9 | |||
|---|---|---|---|
| Quadrant | BADHDUFLAG | Total packets | Discarded packets |
| A | 0 | 6 | 3 |
| B | 0 | 6 | 3 |
| C | 0 | 6 | 3 |
| D | 0 | 6 | 3 |
| Quadrant | Total seconds | Saturated seconds | Saturation percentage |
|---|---|---|---|
| A | 4396 | 110 | 2.502275% |
| B | 5930 | 92 | 1.551433% |
| C | 6347 | 26 | 0.409642% |
| D | 7270 | 50 | 0.687758% |
Noise dominated data is calculated using 1-second bins in cleaned event files. If a bin has >2000 counts, and if more than 50% of those come from <1% of pixels, then it is considered to be noise-dominated and hence unusable.
| Quadrant | # 1 sec bins | Bins with >0 counts | Bins with >2000 counts | High rate bins dominated by noise | Noise dominated (total time) | Noise dominated (detector-on time) | Marked lightcurve |
|---|---|---|---|---|---|---|---|
| A | 7909 | 5616 | 5 | 5 | 0.06% | 0.09% | 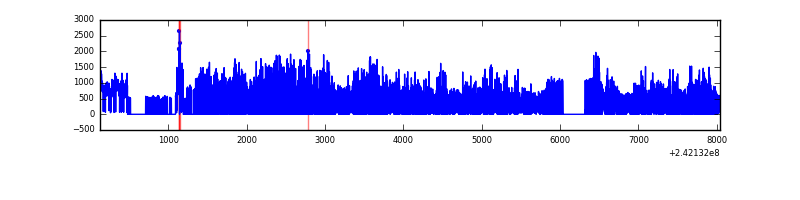 |
| B | 7909 | 6943 | 7 | 7 | 0.09% | 0.10% | 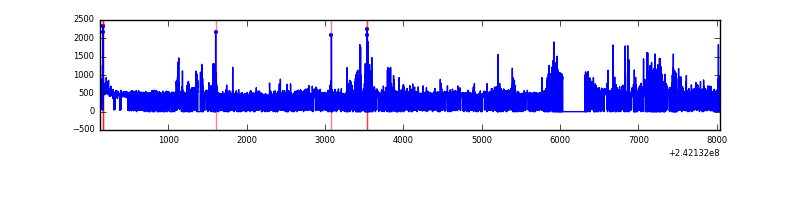 |
| C | 7909 | 7342 | 0 | 0 | 0.00% | 0.00% | 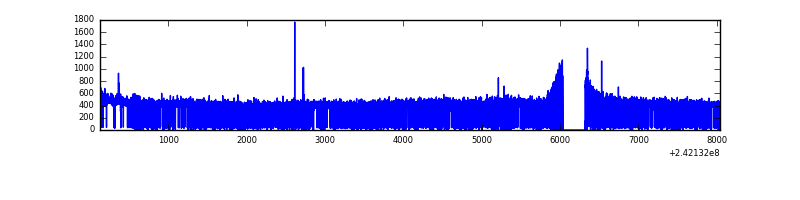 |
| D | 7909 | 7513 | 4 | 4 | 0.05% | 0.05% | 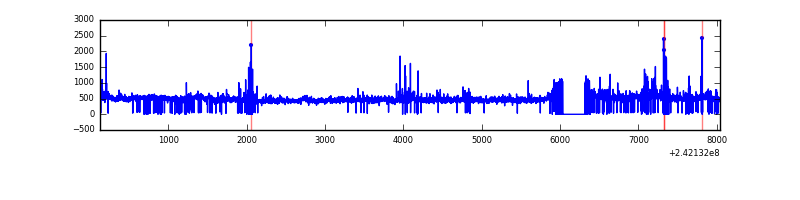 |
Top three noisy pixels from each quadrant. If the there are fewer than three noisy pixels in the level2.evt file, extra rows are filled as -1
| Pixel properties | Quadrant properties | ||||||
|---|---|---|---|---|---|---|---|
| Quadrant | DetID | PixID | Counts | Sigma | Mean | Median | Sigma |
| A | 13 | 251 | 1393326 | 12988.35 | 516 | 504 | 107.2 |
| A | 3 | 80 | 68456 | 633.67 | 516 | 504 | 107.2 |
| A | 1 | 162 | 15647 | 141.21 | 516 | 504 | 107.2 |
| B | 4 | 239 | 210703 | 1576.61 | 693 | 676 | 133.2 |
| B | 10 | 245 | 69303 | 515.16 | 693 | 676 | 133.2 |
| B | 0 | 214 | 44487 | 328.88 | 693 | 676 | 133.2 |
| C | 14 | 234 | 12192 | 67.35 | 726 | 729 | 170.2 |
| C | 13 | 61 | 5382 | 27.34 | 726 | 729 | 170.2 |
| C | 8 | 128 | 4101 | 19.81 | 726 | 729 | 170.2 |
| D | 8 | 195 | 322675 | 1615.04 | 829 | 805 | 199.3 |
| D | 5 | 222 | 68934 | 341.85 | 829 | 805 | 199.3 |
| D | 1 | 20 | 67106 | 332.68 | 829 | 805 | 199.3 |
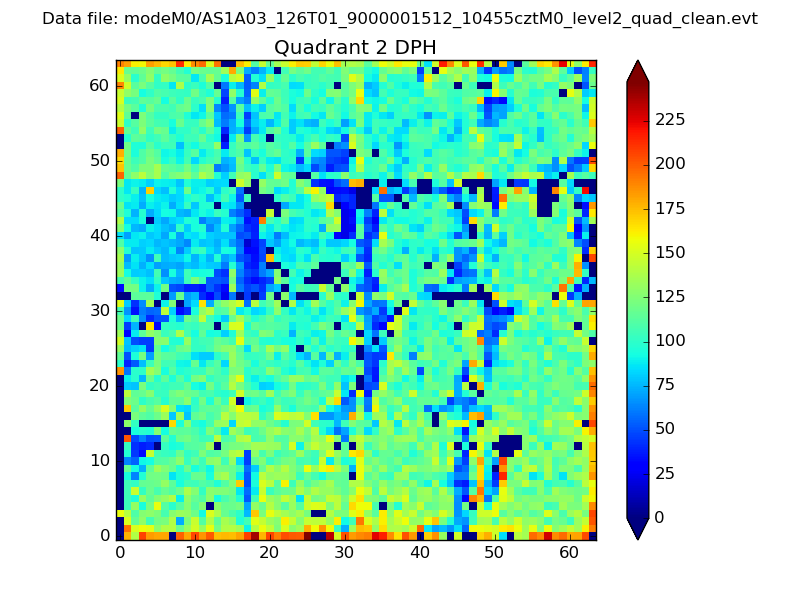
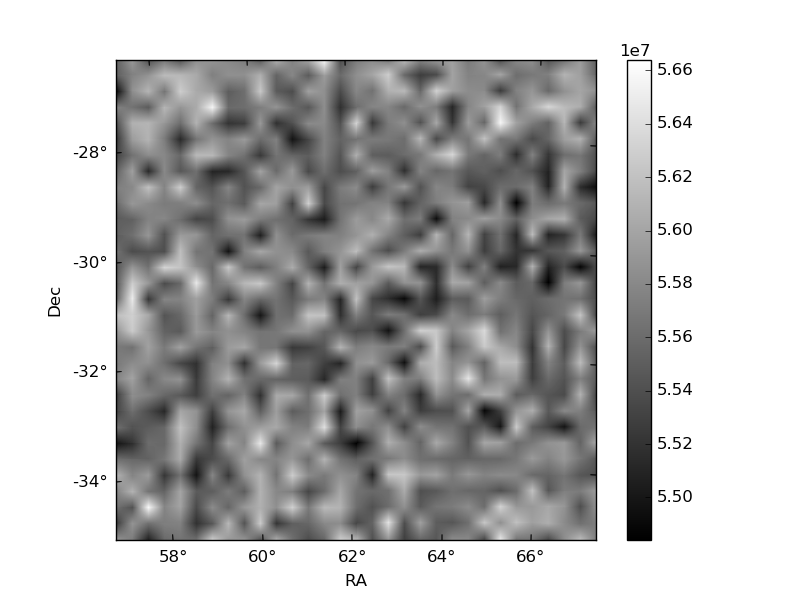
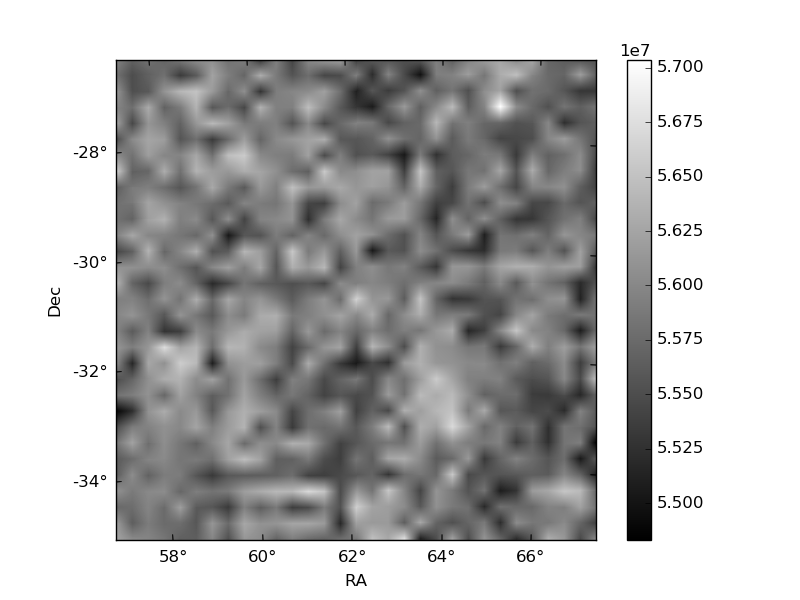
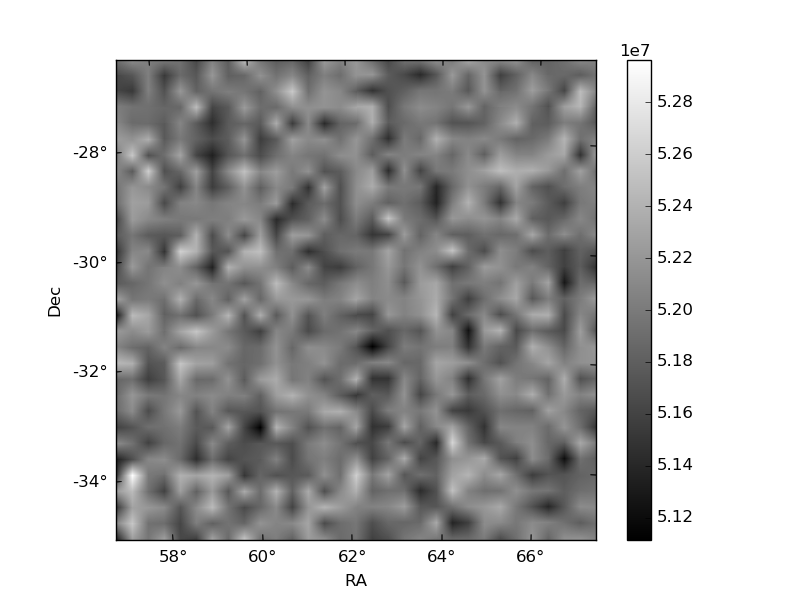
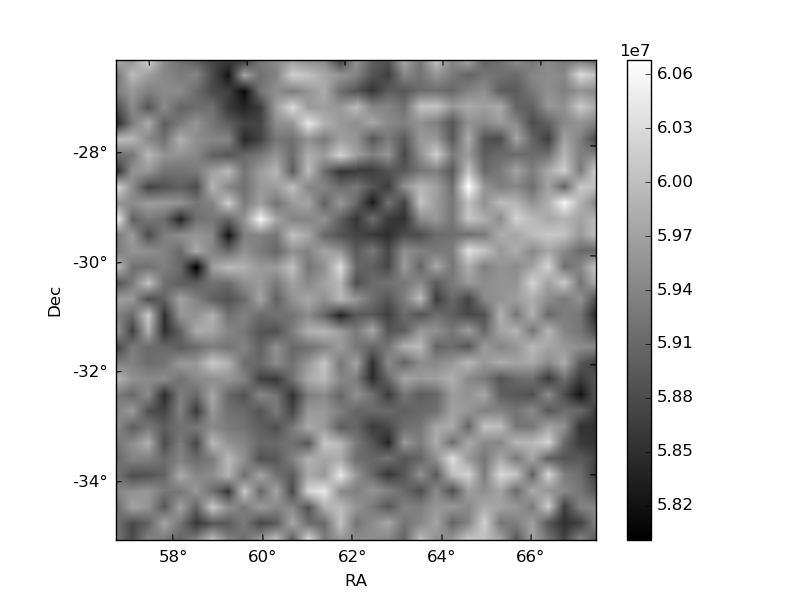
Histogram calculated using DETX and DETY for each event in the final _common_clean file
| Quadrant A |  |
 |
Quadrant B |
|---|---|---|---|
| Quadrant D | 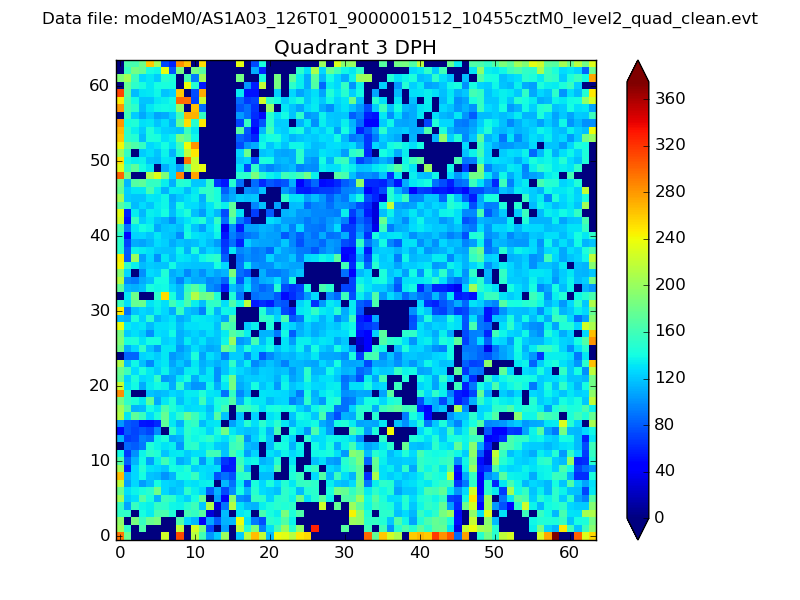 |
 |
Quadrant C |
| Plot type | Count rate plots | Images |
|---|---|---|
| Comparison with Poisson distribution Blue bars denote a histogram of data divided into 1 sec bins. Red curve is a Poisson curve with rate = median count rate of data. |
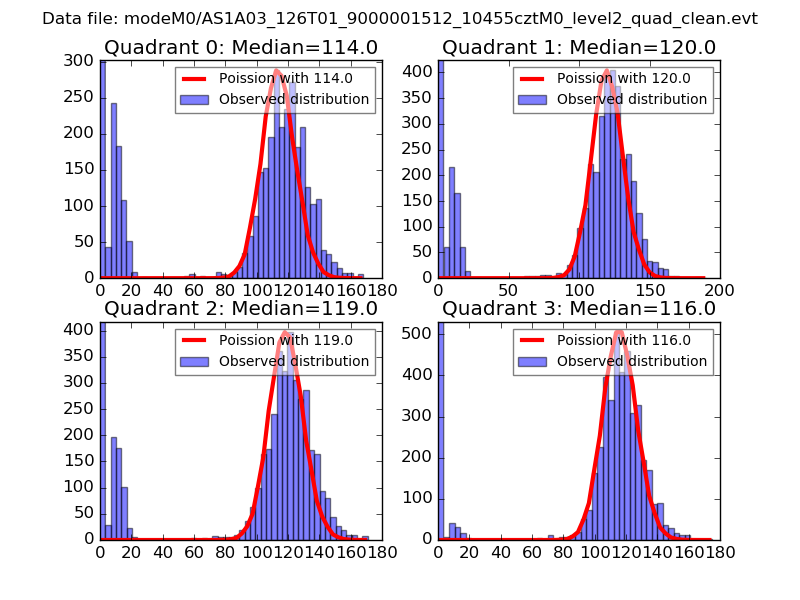 |
 |
| Quadrant-wise count rates Data is divided into 100 sec bins |
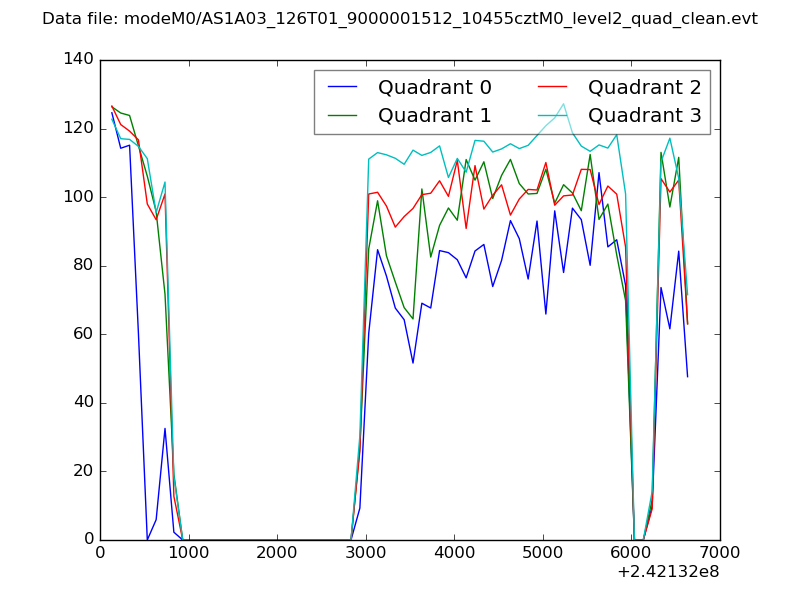 |
|
| Module-wise count rates for Quadrant A Data is divided into 100 sec bins |
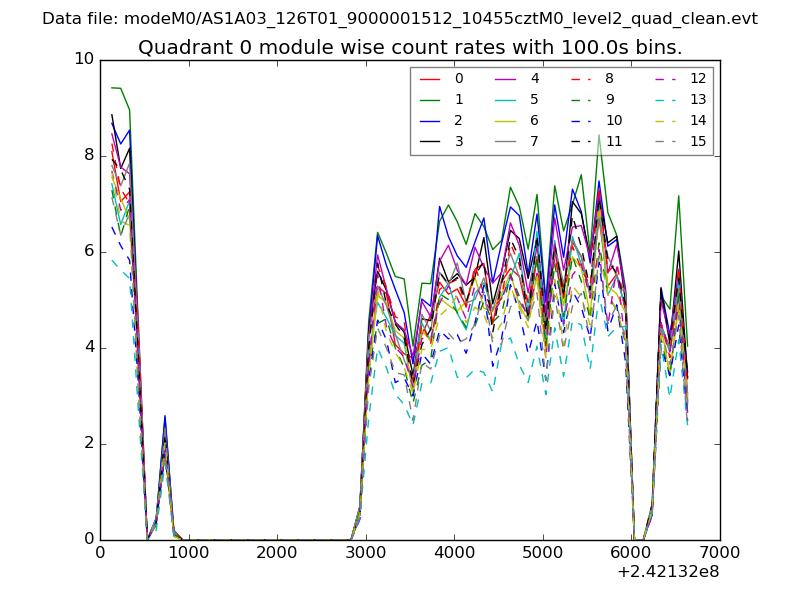 |
 |
| Module-wise count rates for Quadrant B Data is divided into 100 sec bins |
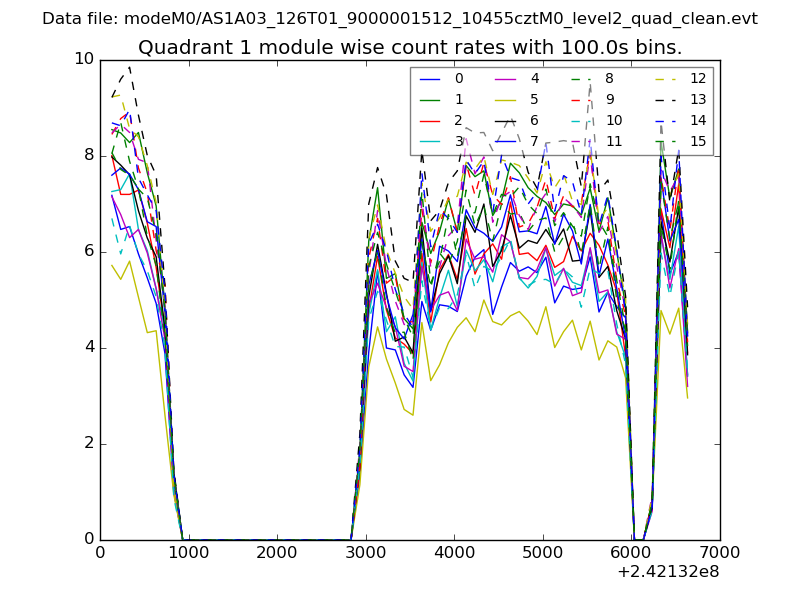 |
 |
| Module-wise count rates for Quadrant C Data is divided into 100 sec bins |
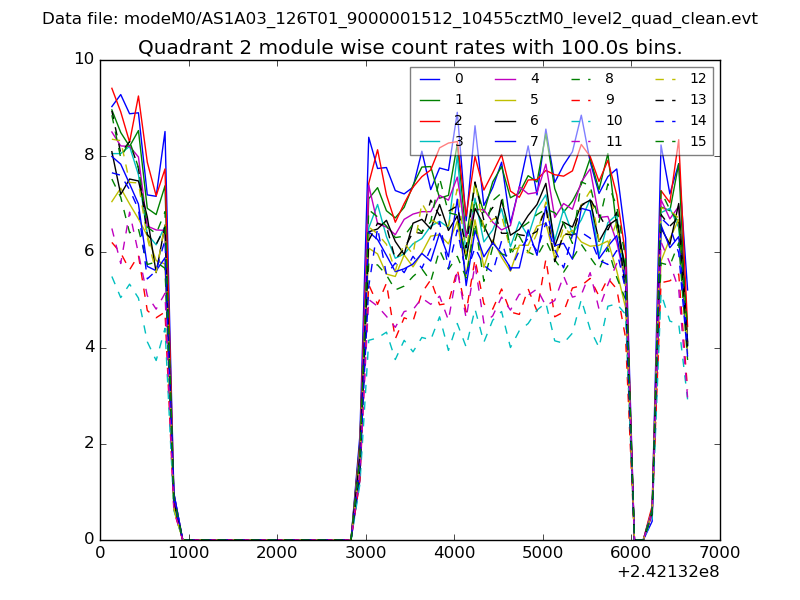 |
 |
| Module-wise count rates for Quadrant D Data is divided into 100 sec bins |
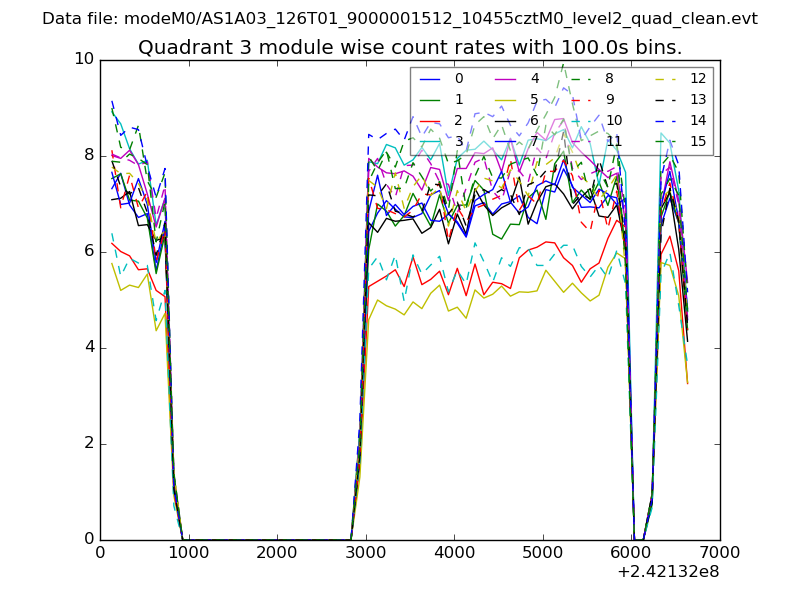 |
 |
| Parameter | Plot |
|---|---|
| CZT HV Monitor | 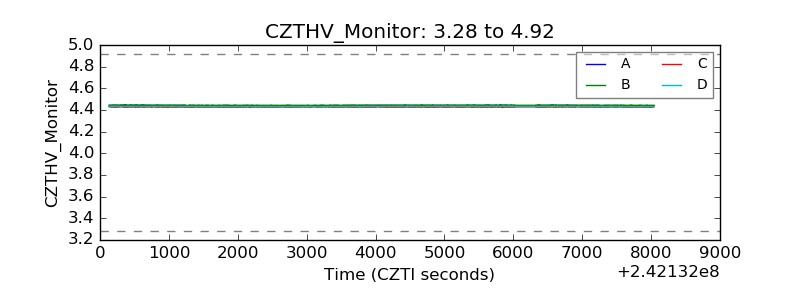 |
| D_VDD | 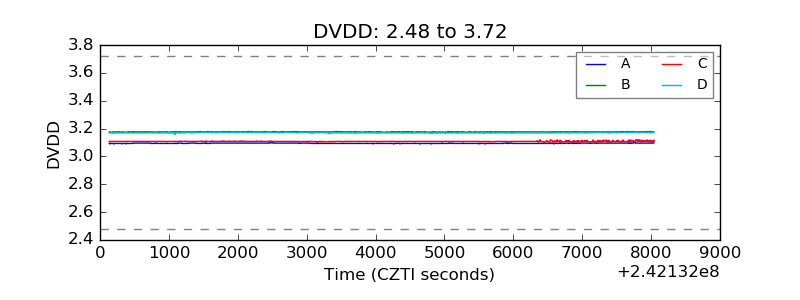 |
| Temperature 1 | 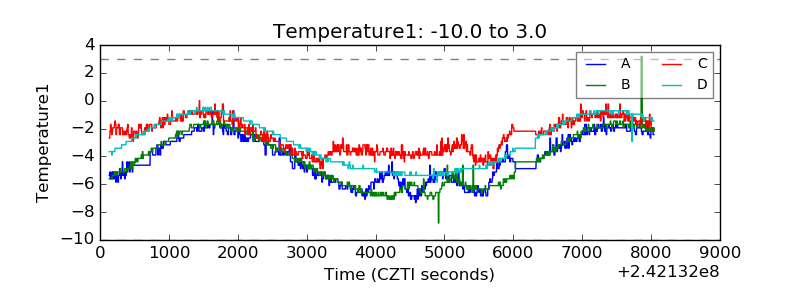 |
| Veto HV Monitor | 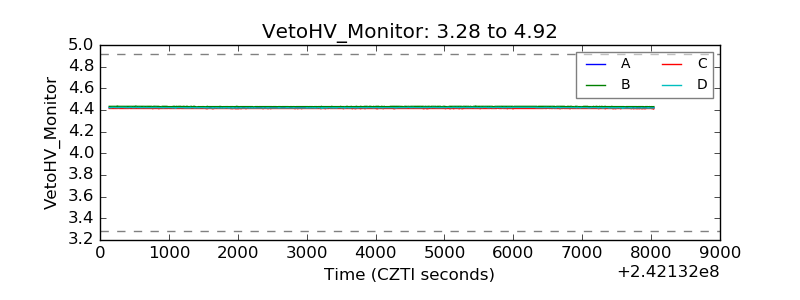 |
| Veto LLD | 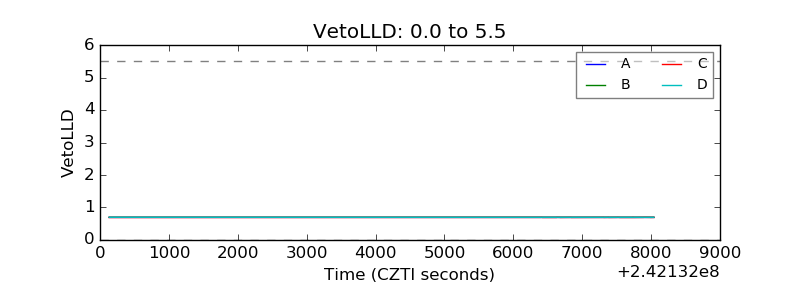 |
| Alpha Counter | 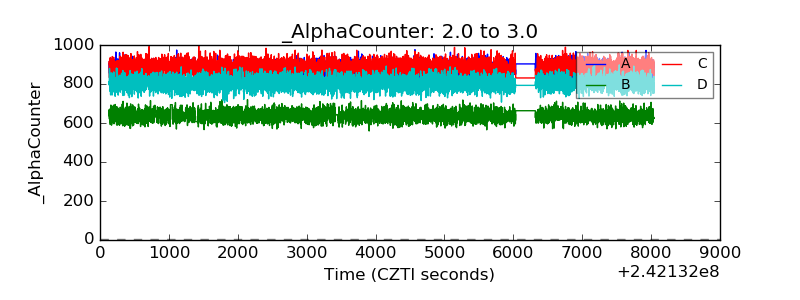 |
| _CPM_Rate | 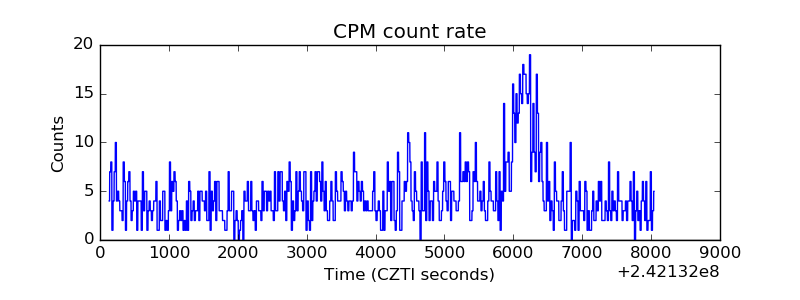 |
| CZT Counter | 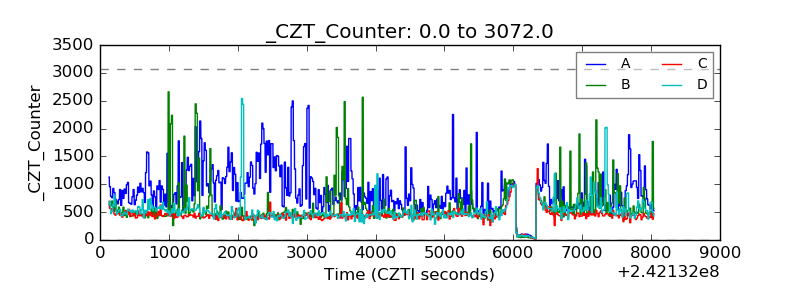 |
| +2.5 Volts monitor |  |
| +5 Volts monitor |  |
| _ROLL_ROT | 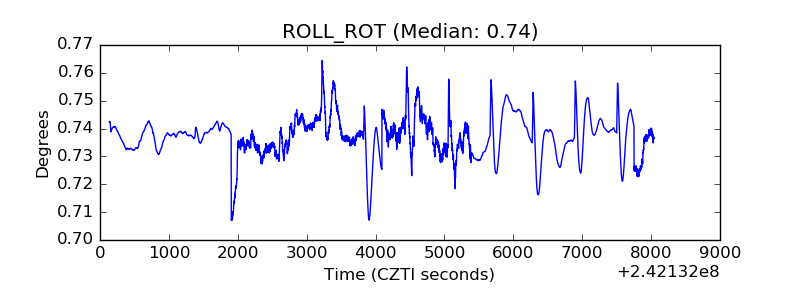 |
| _Roll_DEC | 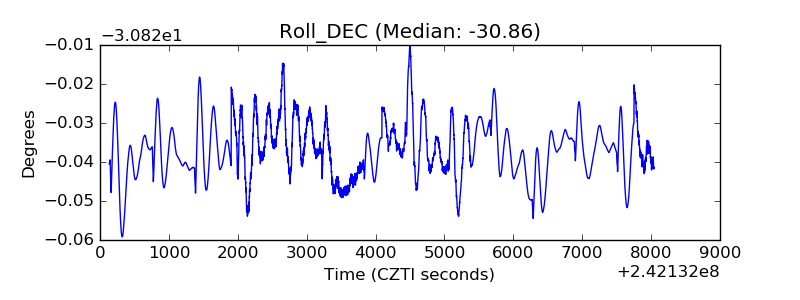 |
| _Roll_RA | 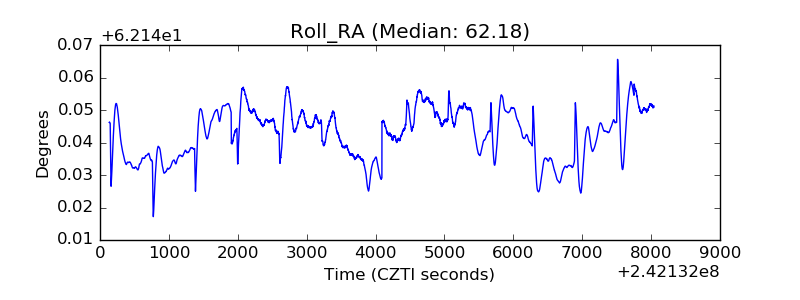 |
| Veto Counter | 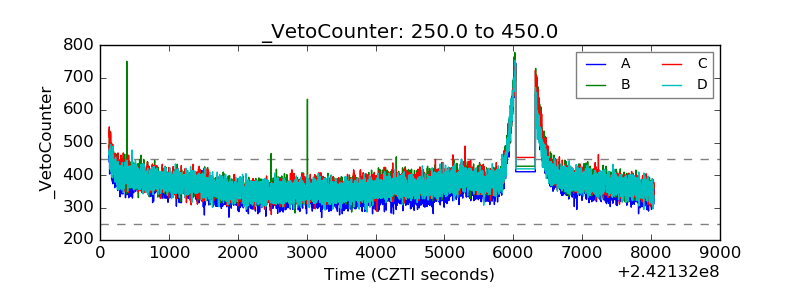 |