| Param | Original file | Final file |
|---|---|---|
| Filename | modeM0/AS1A03_126T01_9000001512_10456cztM0_level2.evt | modeM0/AS1A03_126T01_9000001512_10456cztM0_level2_quad_clean.evt |
| Size (bytes) | 389,779,200 | 51,456,960 |
| Size | 371.7 MB | 49.1 MB |
| Events in quadrant A | 2,967,463 | 253,566 |
| Events in quadrant B | 2,686,470 | 300,318 |
| Events in quadrant C | 2,493,260 | 302,086 |
| Events in quadrant D | 3,289,816 | 325,087 |
| Mode SS | |||
|---|---|---|---|
| Quadrant | BADHDUFLAG | Total packets | Discarded packets |
| A | 0 | 283 | 170 |
| B | 0 | 284 | 162 |
| C | 0 | 284 | 158 |
| D | 0 | 271 | 152 |
| Mode M0 | |||
|---|---|---|---|
| Quadrant | BADHDUFLAG | Total packets | Discarded packets |
| A | 0 | 37128 | 25333 |
| B | 0 | 32265 | 20943 |
| C | 0 | 28326 | 16964 |
| D | 0 | 33396 | 20089 |
| Mode M9 | |||
|---|---|---|---|
| Quadrant | BADHDUFLAG | Total packets | Discarded packets |
| A | 0 | 7 | 3 |
| B | 0 | 8 | 4 |
| C | 0 | 8 | 4 |
| D | 0 | 7 | 3 |
| Quadrant | Total seconds | Saturated seconds | Saturation percentage |
|---|---|---|---|
| A | 4638 | 38 | 0.819319% |
| B | 5247 | 51 | 0.971984% |
| C | 5621 | 20 | 0.355809% |
| D | 5934 | 53 | 0.893158% |
Noise dominated data is calculated using 1-second bins in cleaned event files. If a bin has >2000 counts, and if more than 50% of those come from <1% of pixels, then it is considered to be noise-dominated and hence unusable.
| Quadrant | # 1 sec bins | Bins with >0 counts | Bins with >2000 counts | High rate bins dominated by noise | Noise dominated (total time) | Noise dominated (detector-on time) | Marked lightcurve |
|---|---|---|---|---|---|---|---|
| A | 7534 | 5894 | 1 | 1 | 0.01% | 0.02% | 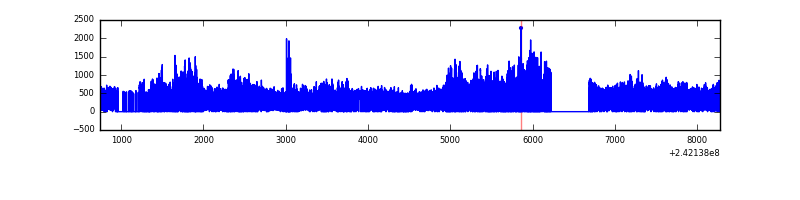 |
| B | 7534 | 6345 | 3 | 3 | 0.04% | 0.05% | 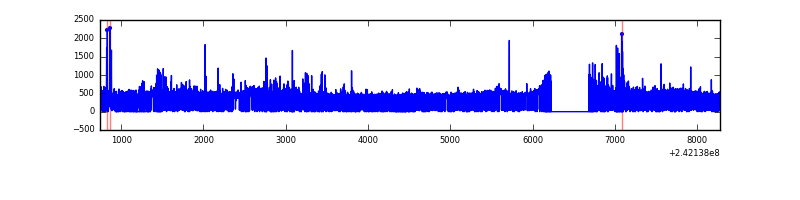 |
| C | 7534 | 6659 | 1 | 1 | 0.01% | 0.02% | 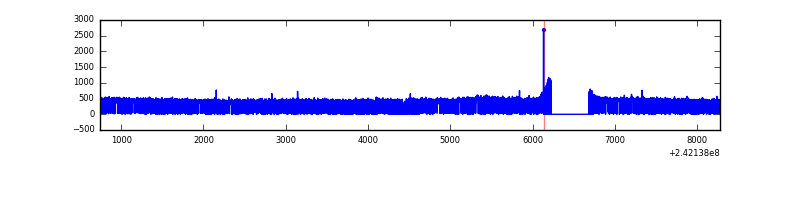 |
| D | 7534 | 6556 | 14 | 14 | 0.19% | 0.21% | 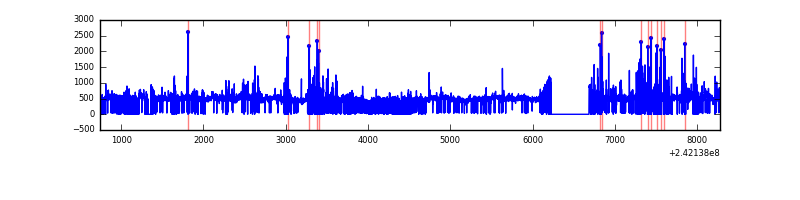 |
Top three noisy pixels from each quadrant. If the there are fewer than three noisy pixels in the level2.evt file, extra rows are filled as -1
| Pixel properties | Quadrant properties | ||||||
|---|---|---|---|---|---|---|---|
| Quadrant | DetID | PixID | Counts | Sigma | Mean | Median | Sigma |
| A | 13 | 251 | 799546 | 7243.41 | 532 | 521 | 110.3 |
| A | 3 | 80 | 78284 | 704.95 | 532 | 521 | 110.3 |
| A | 1 | 162 | 14201 | 124.01 | 532 | 521 | 110.3 |
| B | 4 | 239 | 138036 | 1171.7 | 606 | 590 | 117.3 |
| B | 11 | 51 | 83977 | 710.86 | 606 | 590 | 117.3 |
| B | 0 | 214 | 31897 | 266.89 | 606 | 590 | 117.3 |
| C | 8 | 128 | 8533 | 53.11 | 634 | 636 | 148.7 |
| C | 8 | 112 | 4875 | 28.51 | 634 | 636 | 148.7 |
| C | 13 | 61 | 4759 | 27.73 | 634 | 636 | 148.7 |
| D | 8 | 195 | 332499 | 2057.36 | 669 | 651 | 161.3 |
| D | 1 | 52 | 139249 | 859.27 | 669 | 651 | 161.3 |
| D | 5 | 222 | 111318 | 686.1 | 669 | 651 | 161.3 |
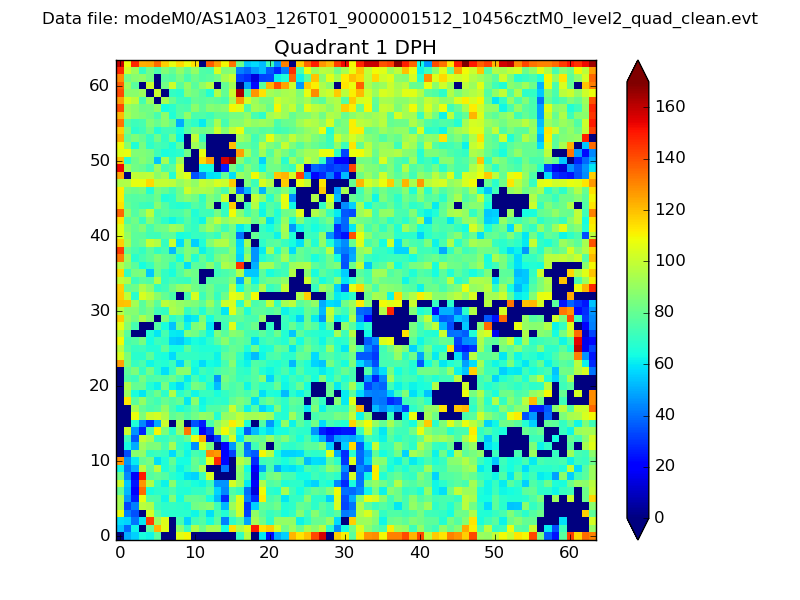
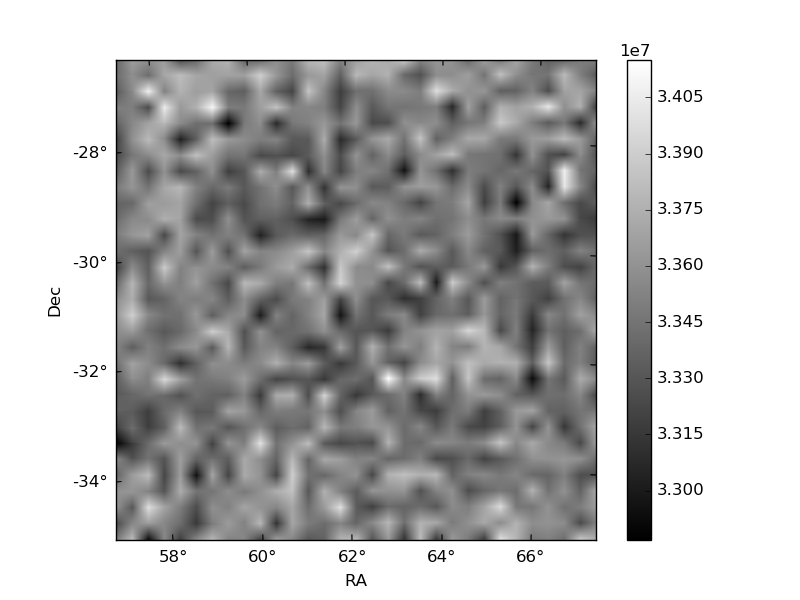
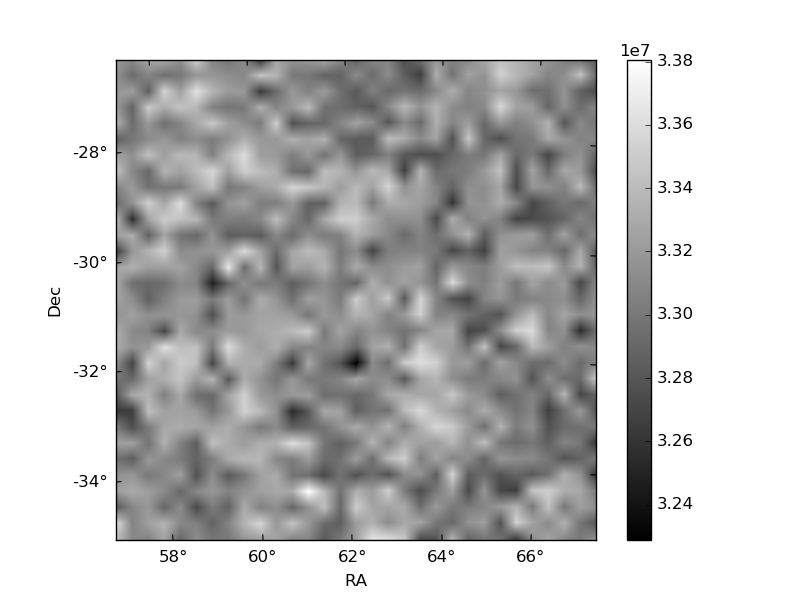
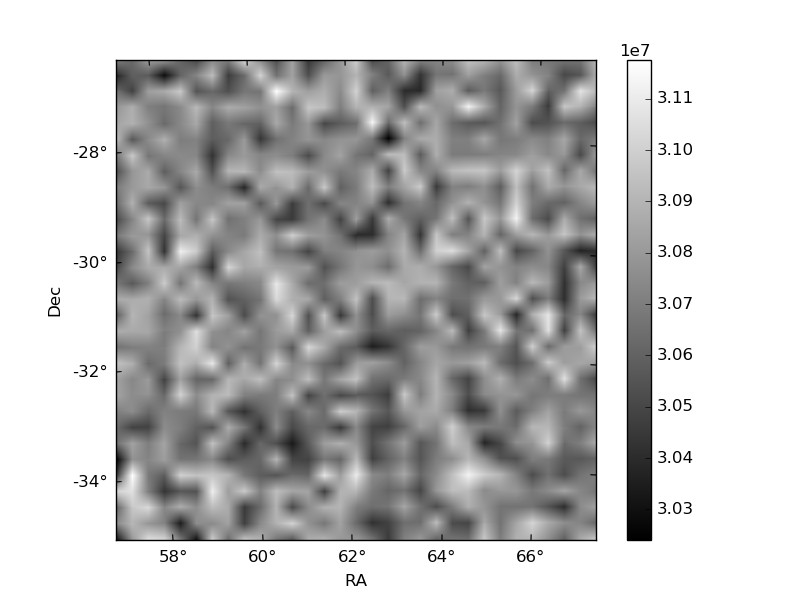
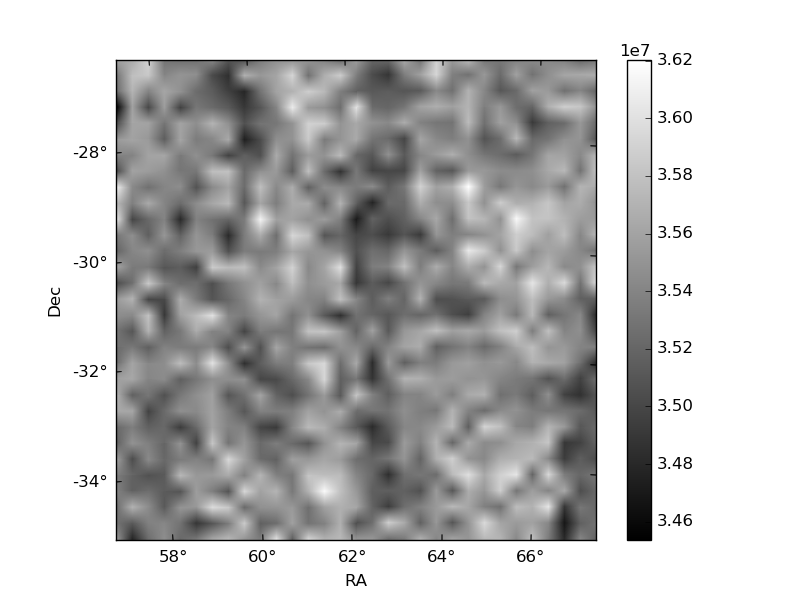
Histogram calculated using DETX and DETY for each event in the final _common_clean file
| Quadrant A | 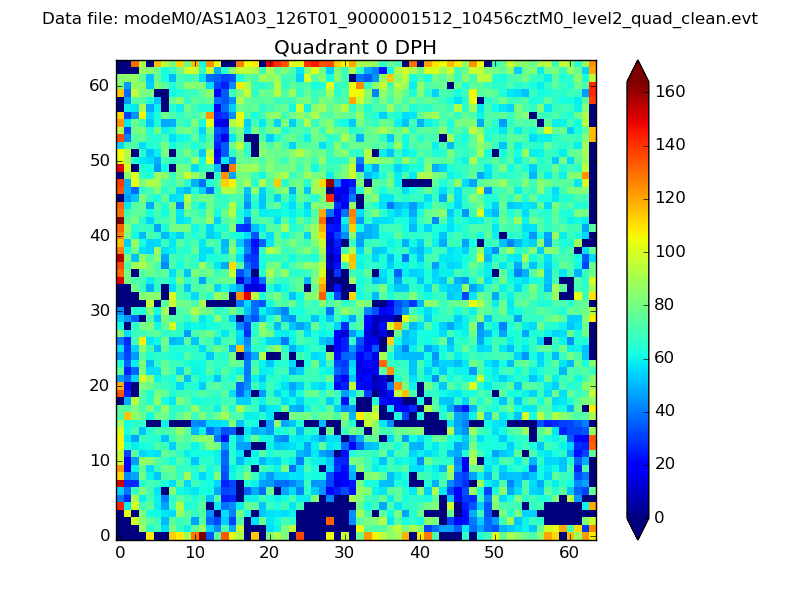 |
 |
Quadrant B |
|---|---|---|---|
| Quadrant D | 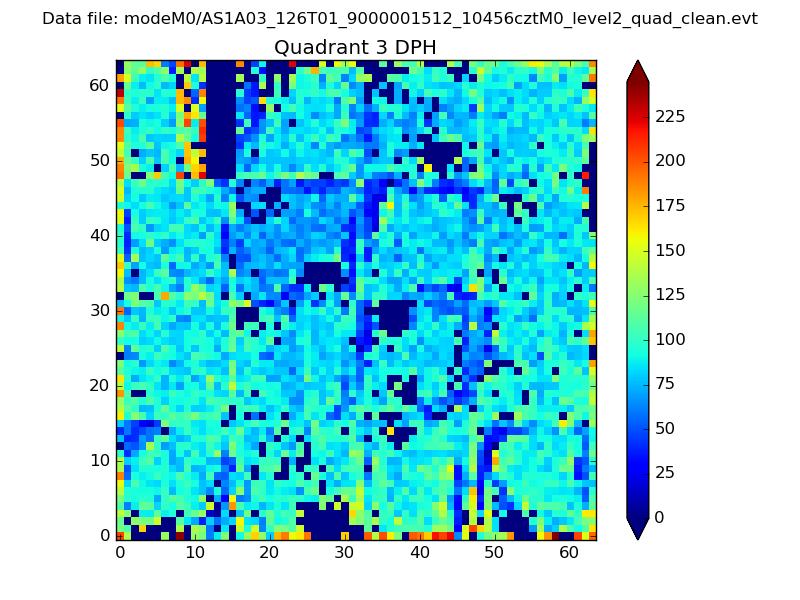 |
 |
Quadrant C |
| Plot type | Count rate plots | Images |
|---|---|---|
| Comparison with Poisson distribution Blue bars denote a histogram of data divided into 1 sec bins. Red curve is a Poisson curve with rate = median count rate of data. |
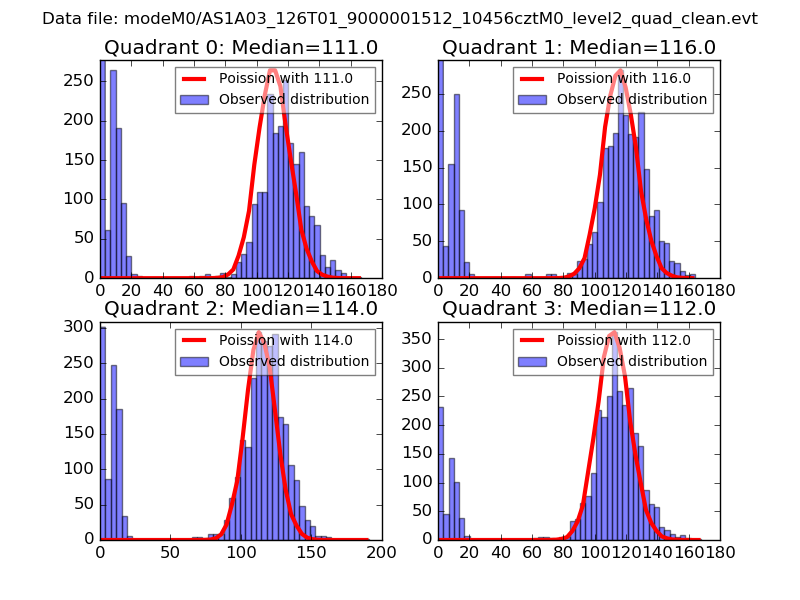 |
 |
| Quadrant-wise count rates Data is divided into 100 sec bins |
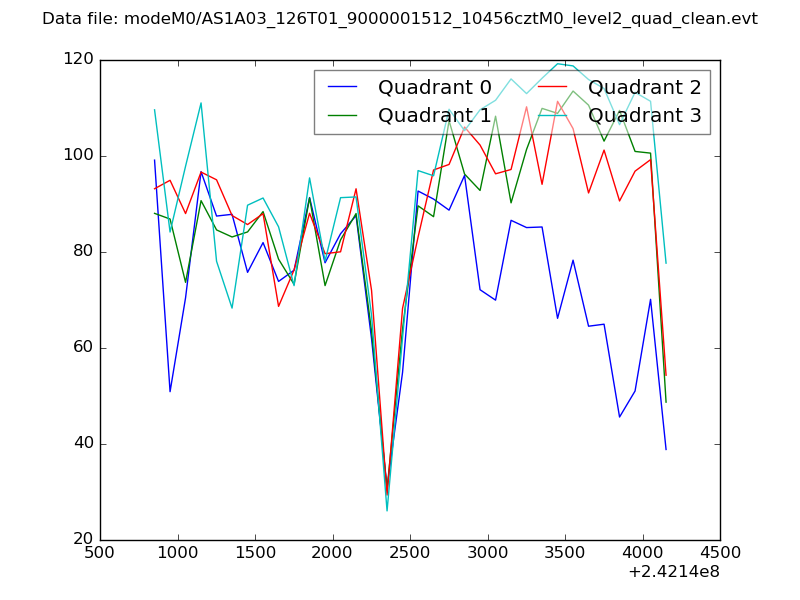 |
|
| Module-wise count rates for Quadrant A Data is divided into 100 sec bins |
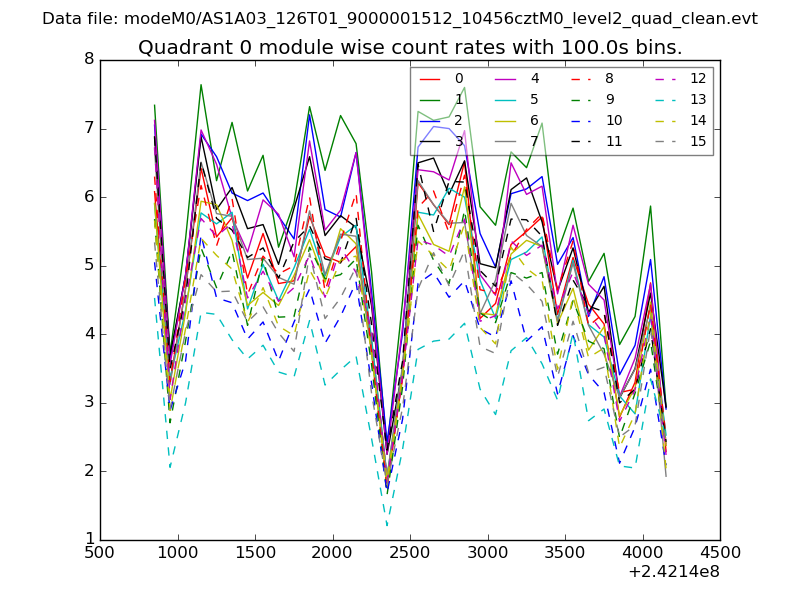 |
 |
| Module-wise count rates for Quadrant B Data is divided into 100 sec bins |
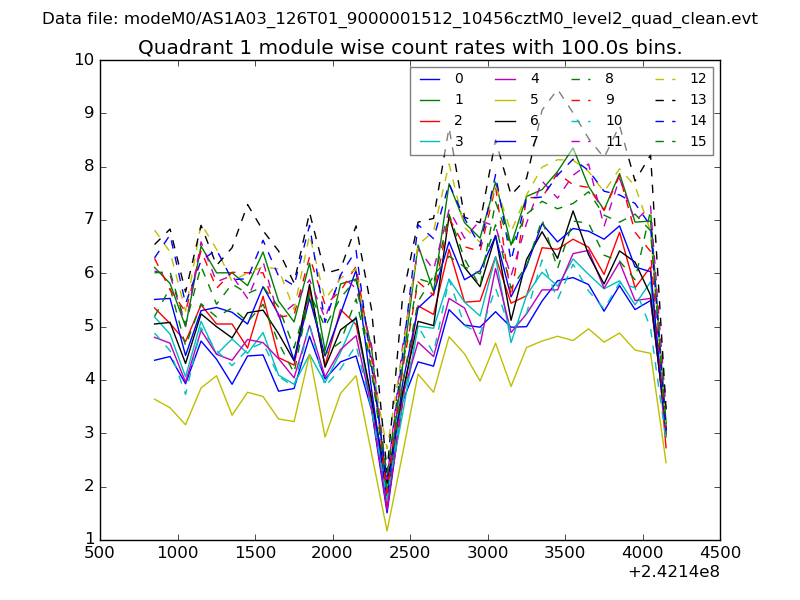 |
 |
| Module-wise count rates for Quadrant C Data is divided into 100 sec bins |
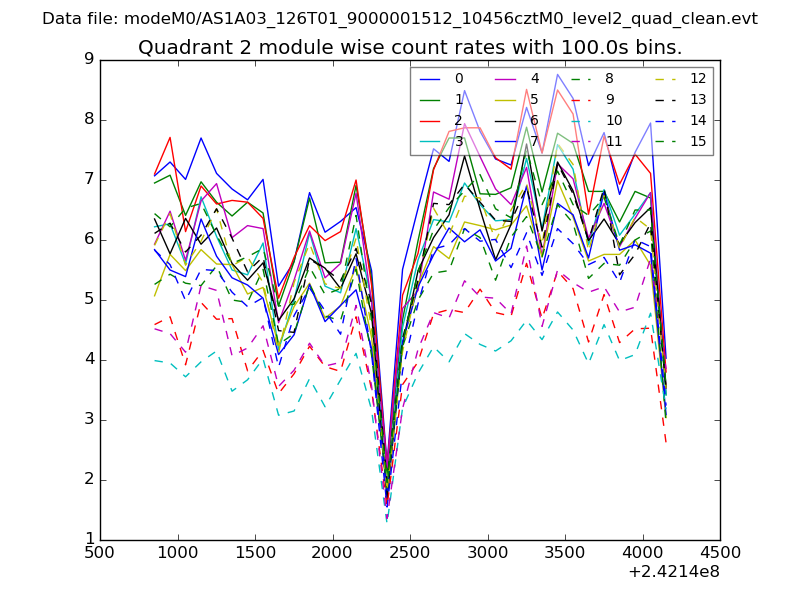 |
 |
| Module-wise count rates for Quadrant D Data is divided into 100 sec bins |
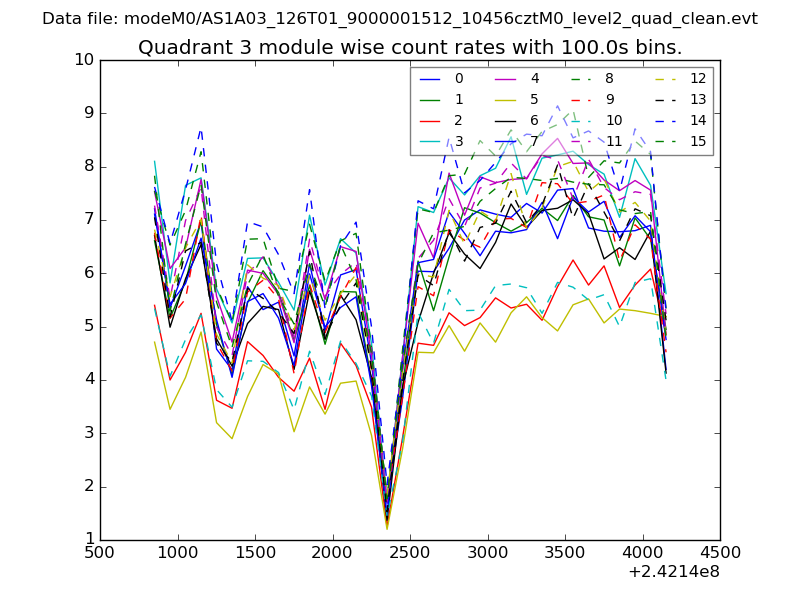 |
 |
| Parameter | Plot |
|---|---|
| CZT HV Monitor | 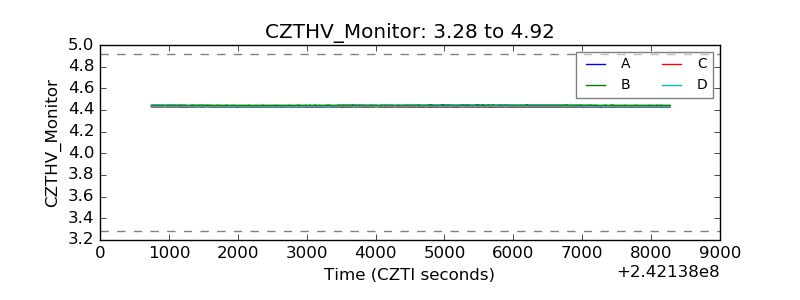 |
| D_VDD | 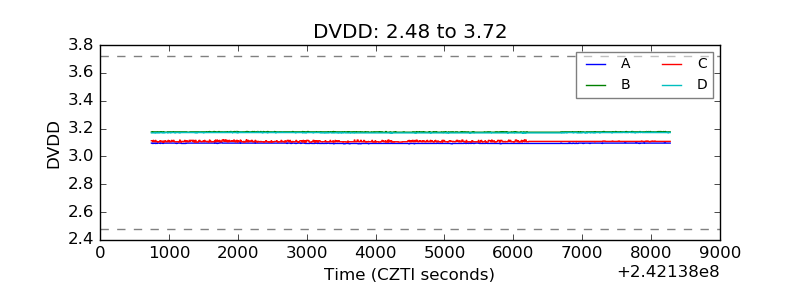 |
| Temperature 1 | 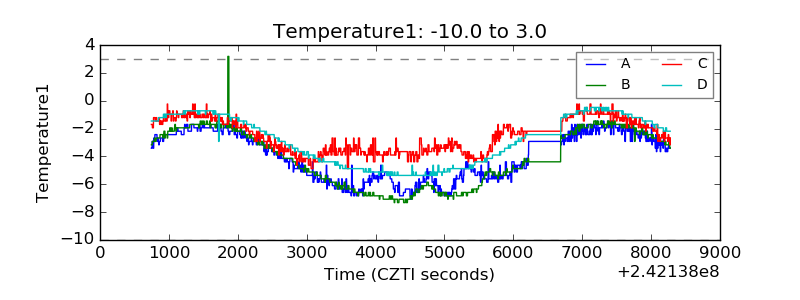 |
| Veto HV Monitor | 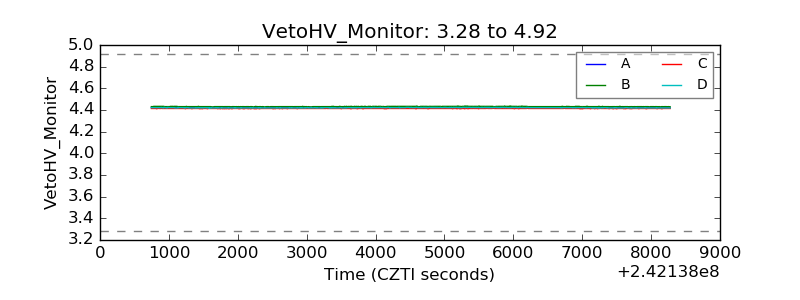 |
| Veto LLD | 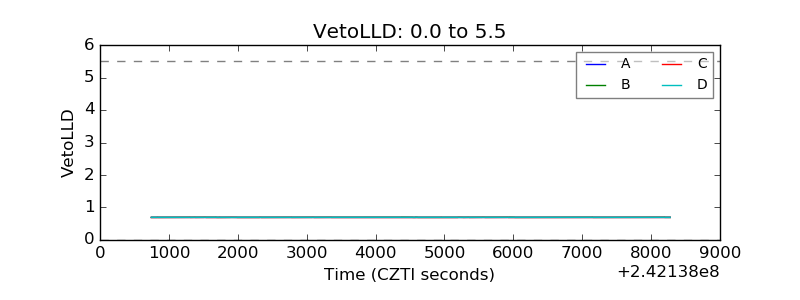 |
| Alpha Counter | 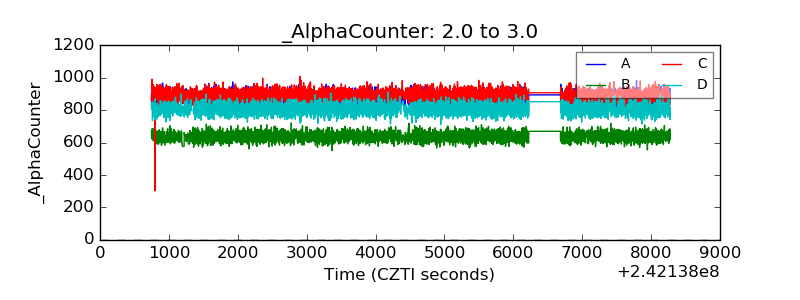 |
| _CPM_Rate | 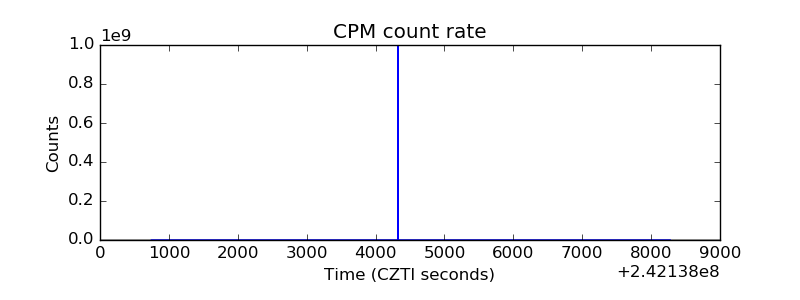 |
| CZT Counter | 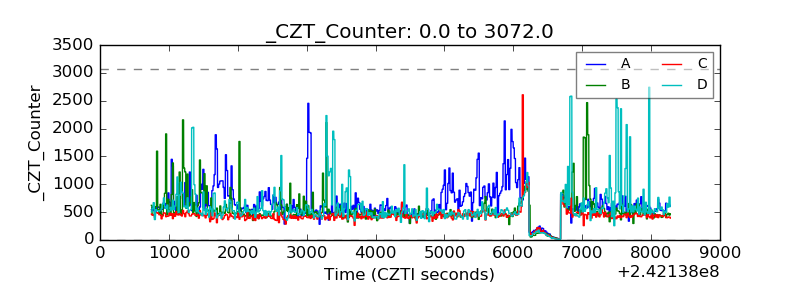 |
| +2.5 Volts monitor |  |
| +5 Volts monitor |  |
| _ROLL_ROT | 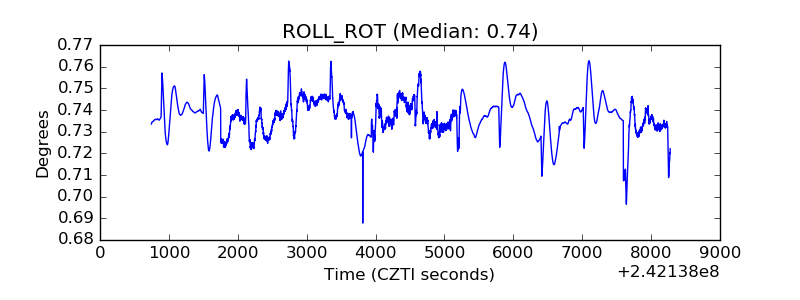 |
| _Roll_DEC | 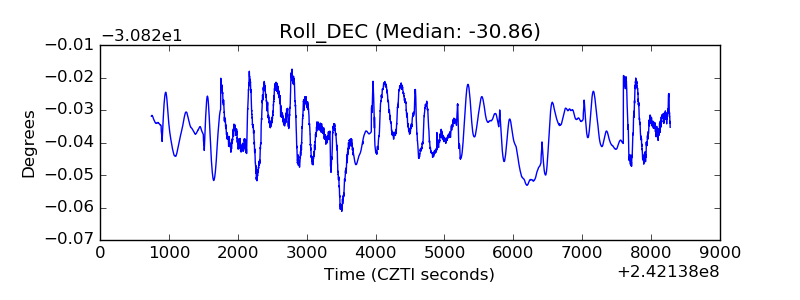 |
| _Roll_RA |  |
| Veto Counter | 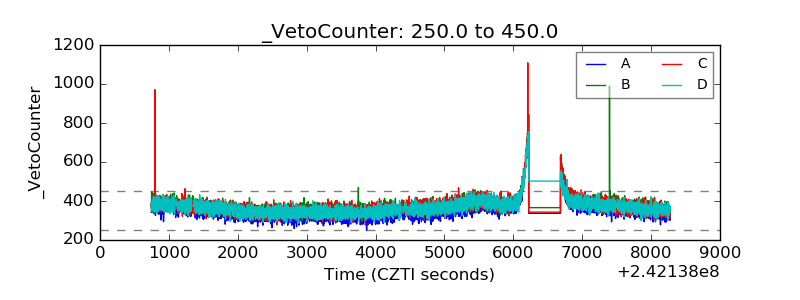 |