| Param | Original file | Final file |
|---|---|---|
| Filename | modeM0/AS1A03_126T01_9000001512_10459cztM0_level2.evt | modeM0/AS1A03_126T01_9000001512_10459cztM0_level2_quad_clean.evt |
| Size (bytes) | 386,712,000 | 68,094,720 |
| Size | 368.8 MB | 64.9 MB |
| Events in quadrant A | 2,558,916 | 315,621 |
| Events in quadrant B | 2,697,969 | 415,917 |
| Events in quadrant C | 2,598,470 | 489,706 |
| Events in quadrant D | 3,483,772 | 458,880 |
| Mode SS | |||
|---|---|---|---|
| Quadrant | BADHDUFLAG | Total packets | Discarded packets |
| A | 0 | 286 | 153 |
| B | 0 | 286 | 155 |
| C | 0 | 286 | 152 |
| D | 0 | 278 | 142 |
| Mode M0 | |||
|---|---|---|---|
| Quadrant | BADHDUFLAG | Total packets | Discarded packets |
| A | 0 | 42380 | 32040 |
| B | 0 | 32208 | 20735 |
| C | 0 | 28301 | 16679 |
| D | 0 | 32065 | 17877 |
| Mode M9 | |||
|---|---|---|---|
| Quadrant | BADHDUFLAG | Total packets | Discarded packets |
| A | 0 | 30 | 14 |
| B | 0 | 32 | 16 |
| C | 0 | 32 | 16 |
| D | 0 | 28 | 12 |
| Quadrant | Total seconds | Saturated seconds | Saturation percentage |
|---|---|---|---|
| A | 4192 | 63 | 1.502863% |
| B | 5338 | 54 | 1.011615% |
| C | 5739 | 22 | 0.383342% |
| D | 6328 | 28 | 0.442478% |
Noise dominated data is calculated using 1-second bins in cleaned event files. If a bin has >2000 counts, and if more than 50% of those come from <1% of pixels, then it is considered to be noise-dominated and hence unusable.
| Quadrant | # 1 sec bins | Bins with >0 counts | Bins with >2000 counts | High rate bins dominated by noise | Noise dominated (total time) | Noise dominated (detector-on time) | Marked lightcurve |
|---|---|---|---|---|---|---|---|
| A | 8601 | 5224 | 0 | 0 | 0.00% | 0.00% | 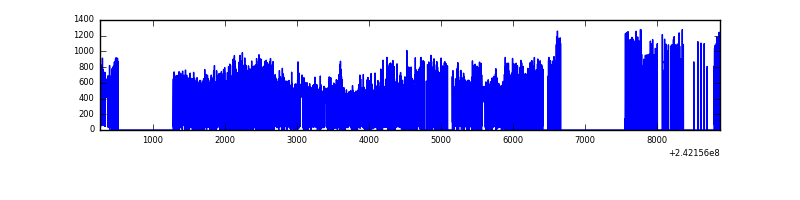 |
| B | 8608 | 6327 | 2 | 2 | 0.02% | 0.03% | 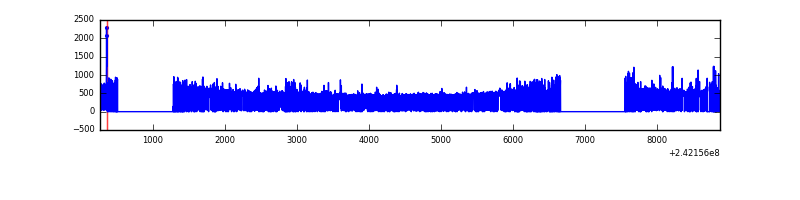 |
| C | 8608 | 6671 | 0 | 0 | 0.00% | 0.00% | 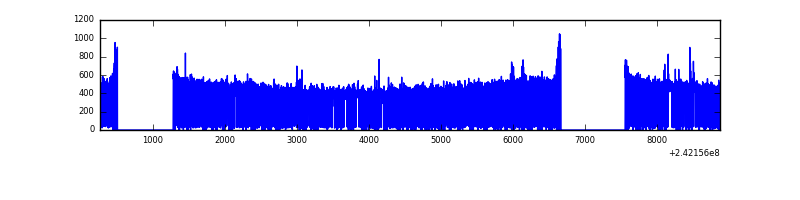 |
| D | 8607 | 6705 | 0 | 0 | 0.00% | 0.00% | 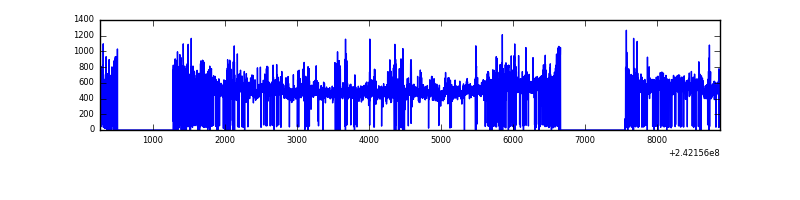 |
Top three noisy pixels from each quadrant. If the there are fewer than three noisy pixels in the level2.evt file, extra rows are filled as -1
| Pixel properties | Quadrant properties | ||||||
|---|---|---|---|---|---|---|---|
| Quadrant | DetID | PixID | Counts | Sigma | Mean | Median | Sigma |
| A | 13 | 251 | 545279 | 5392.12 | 488 | 478 | 101.0 |
| A | 3 | 80 | 73267 | 720.42 | 488 | 478 | 101.0 |
| A | 1 | 162 | 18021 | 173.63 | 488 | 478 | 101.0 |
| B | 4 | 239 | 117876 | 960.47 | 629 | 613 | 122.1 |
| B | 0 | 219 | 34258 | 275.58 | 629 | 613 | 122.1 |
| B | 0 | 187 | 27903 | 223.52 | 629 | 613 | 122.1 |
| C | 14 | 234 | 10127 | 61.29 | 661 | 662 | 154.4 |
| C | 14 | 67 | 7030 | 41.24 | 661 | 662 | 154.4 |
| C | 13 | 61 | 4904 | 27.47 | 661 | 662 | 154.4 |
| D | 8 | 195 | 499978 | 2859.06 | 720 | 700 | 174.6 |
| D | 1 | 52 | 138670 | 790.07 | 720 | 700 | 174.6 |
| D | 2 | 14 | 35723 | 200.56 | 720 | 700 | 174.6 |
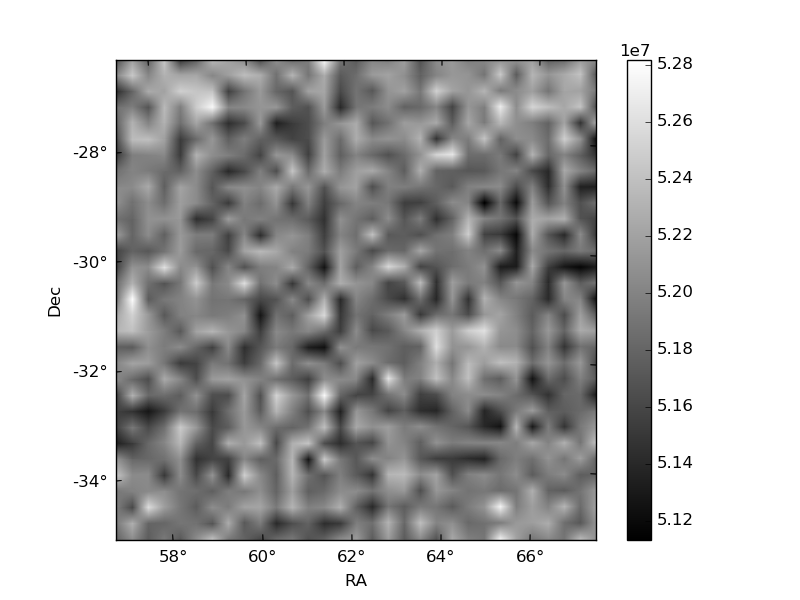
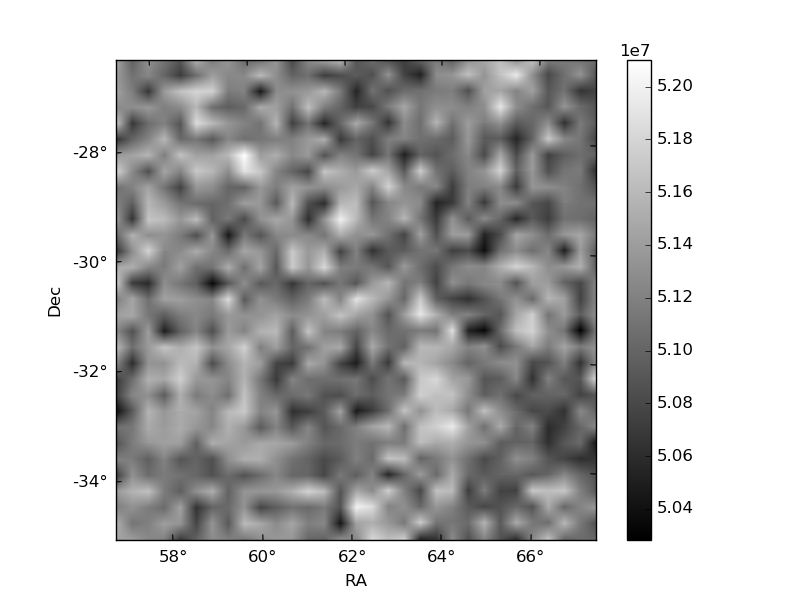
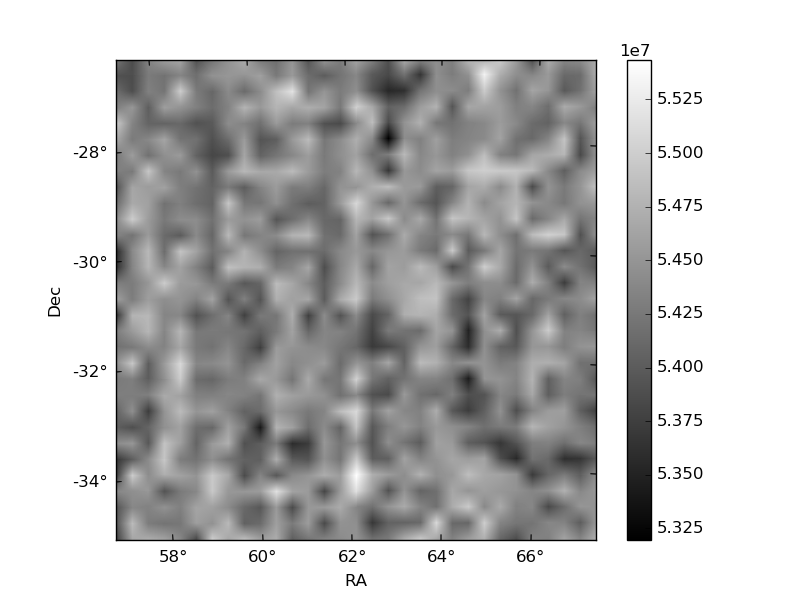
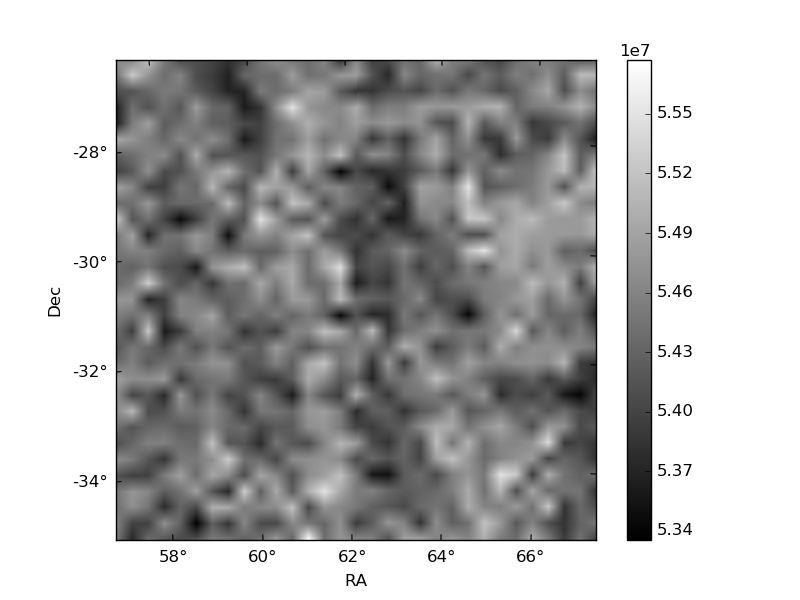
Histogram calculated using DETX and DETY for each event in the final _common_clean file
| Quadrant A | 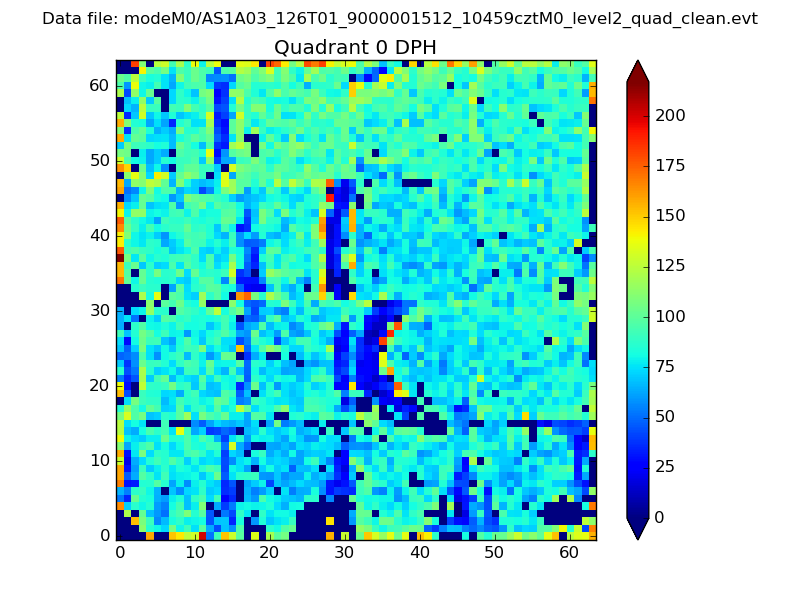 |
 |
Quadrant B |
|---|---|---|---|
| Quadrant D | 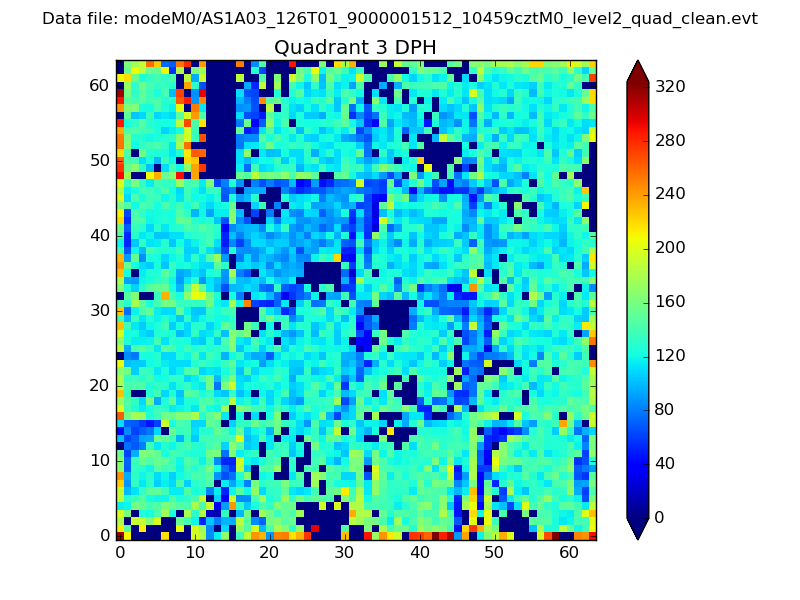 |
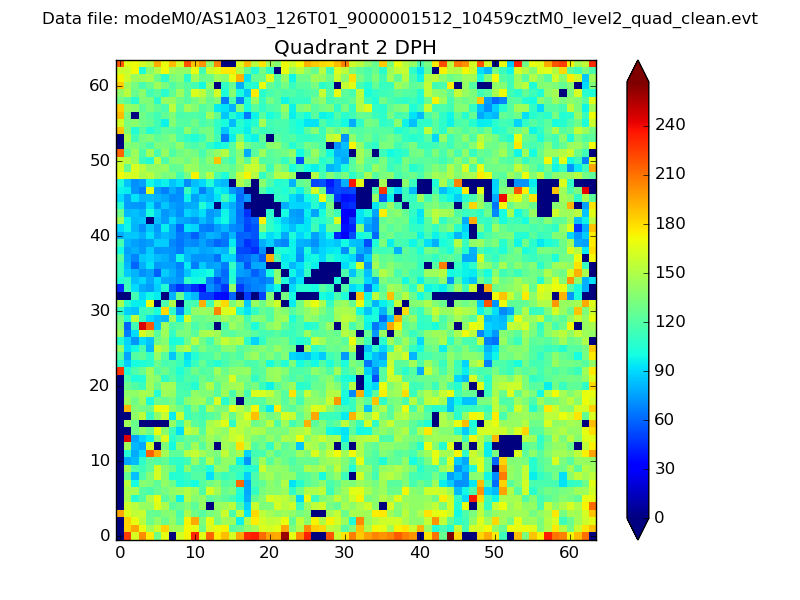 |
Quadrant C |
| Plot type | Count rate plots | Images |
|---|---|---|
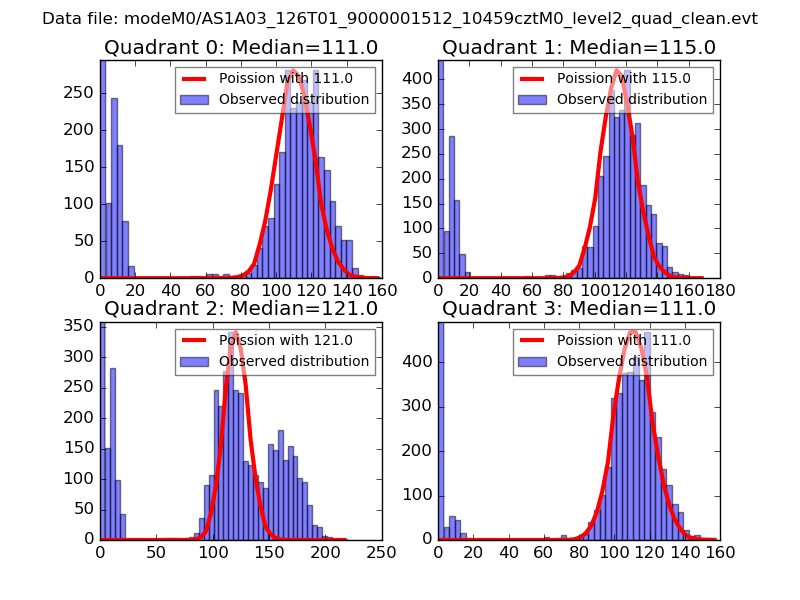
| Comparison with Poisson distribution Blue bars denote a histogram of data divided into 1 sec bins. Red curve is a Poisson curve with rate = median count rate of data. |
 |
 |
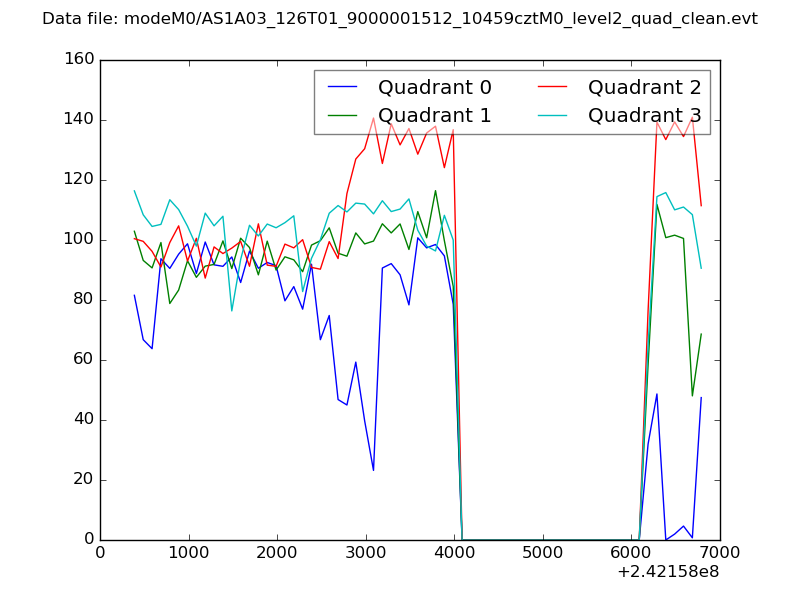
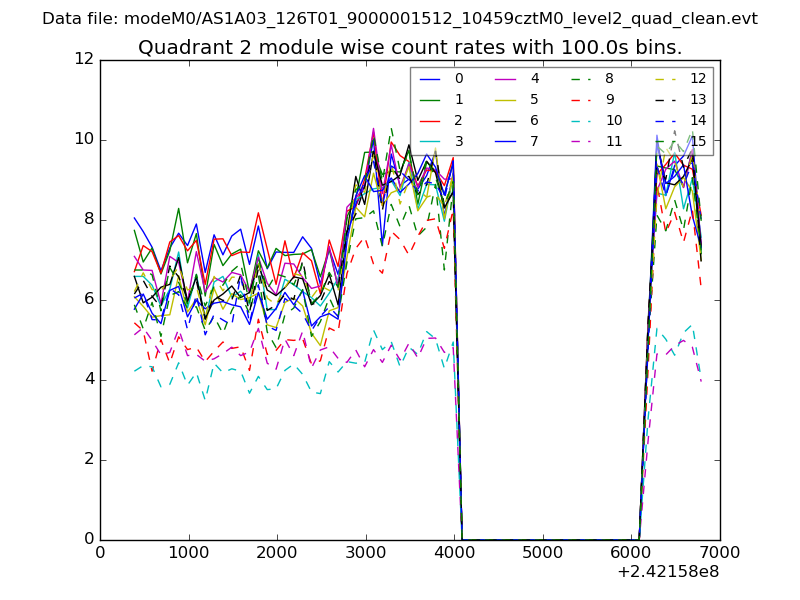
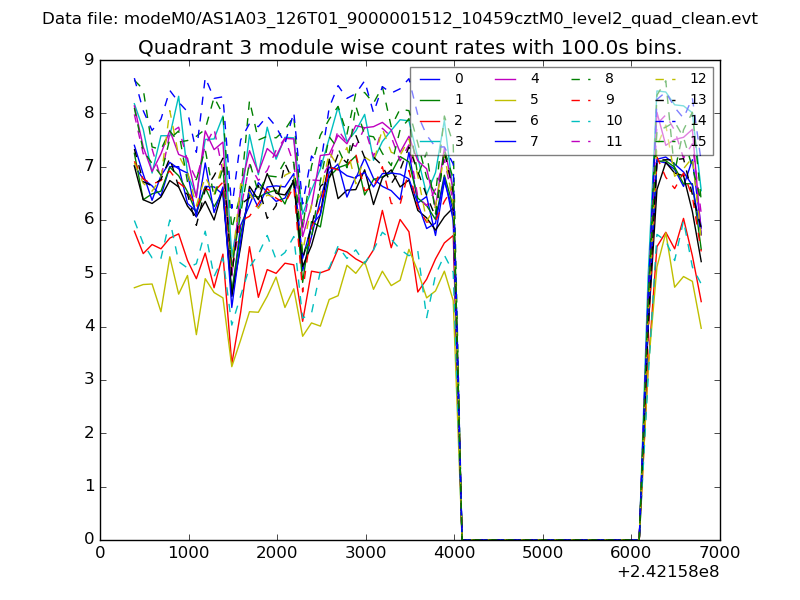
| Quadrant-wise count rates Data is divided into 100 sec bins |
 |
|
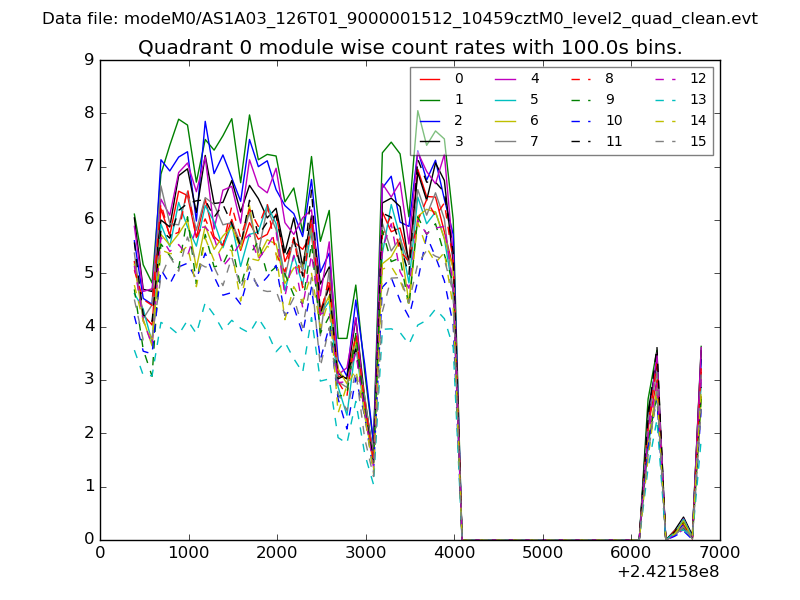
| Module-wise count rates for Quadrant A Data is divided into 100 sec bins |
 |
 |
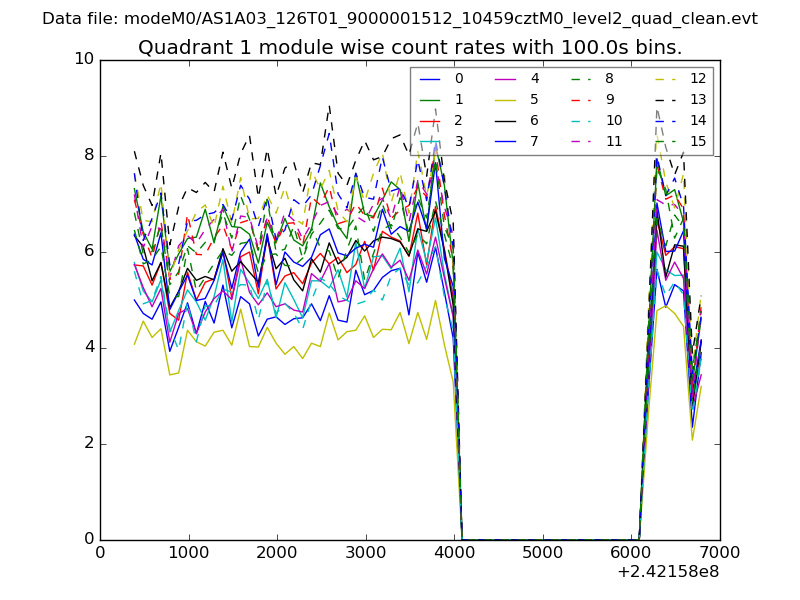
| Module-wise count rates for Quadrant B Data is divided into 100 sec bins |
 |
 |
| Module-wise count rates for Quadrant C Data is divided into 100 sec bins |
 |
 |
| Module-wise count rates for Quadrant D Data is divided into 100 sec bins |
 |
 |
| Parameter | Plot |
|---|---|
| CZT HV Monitor | 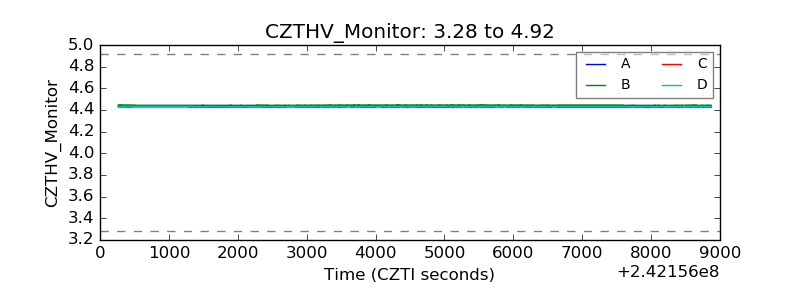 |
| D_VDD | 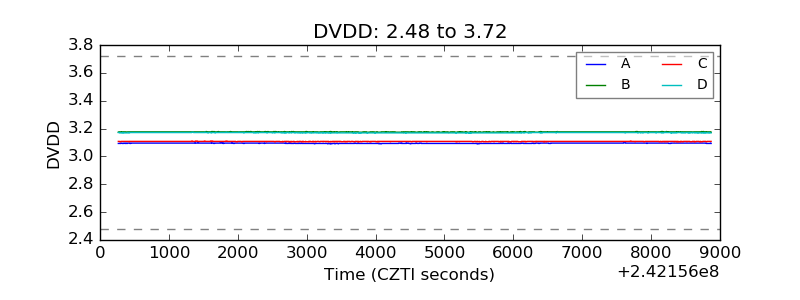 |
| Temperature 1 | 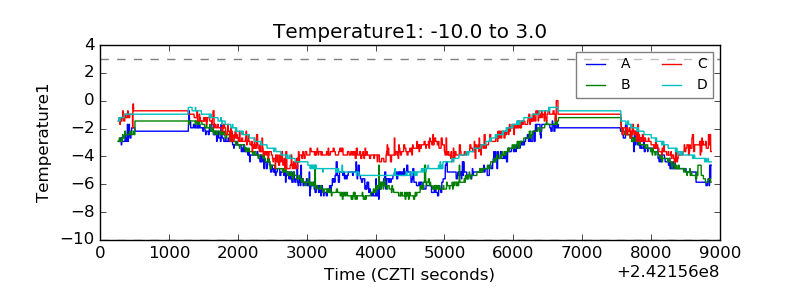 |
| Veto HV Monitor | 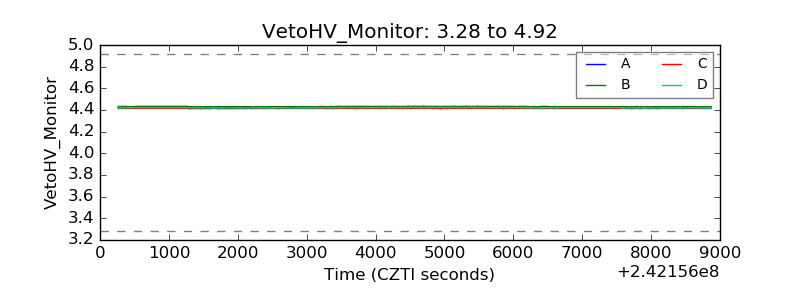 |
| Veto LLD | 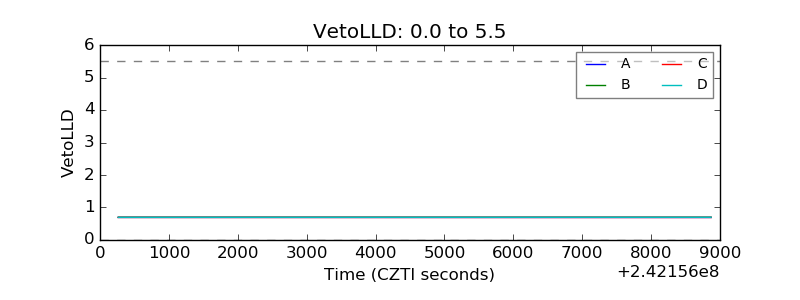 |
| Alpha Counter | 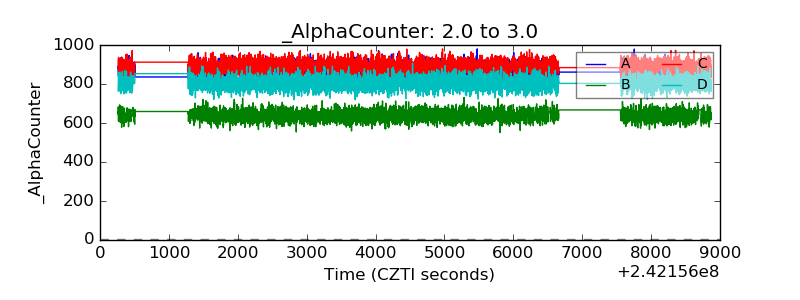 |
| _CPM_Rate | 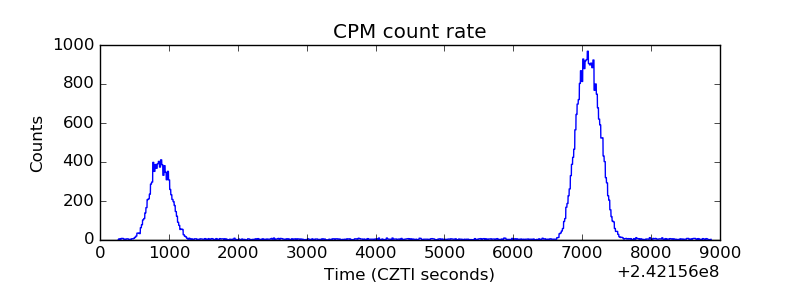 |
| CZT Counter |  |
| +2.5 Volts monitor |  |
| +5 Volts monitor | 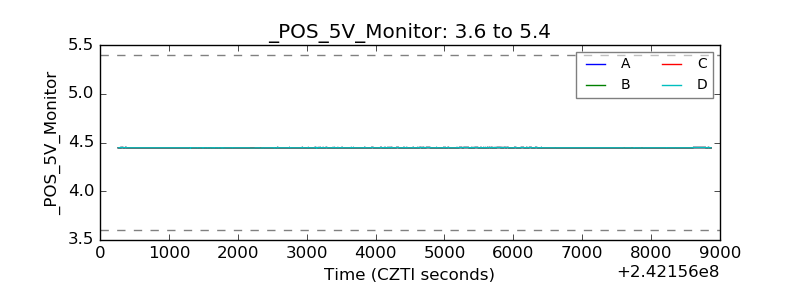 |
| _ROLL_ROT |  |
| _Roll_DEC | 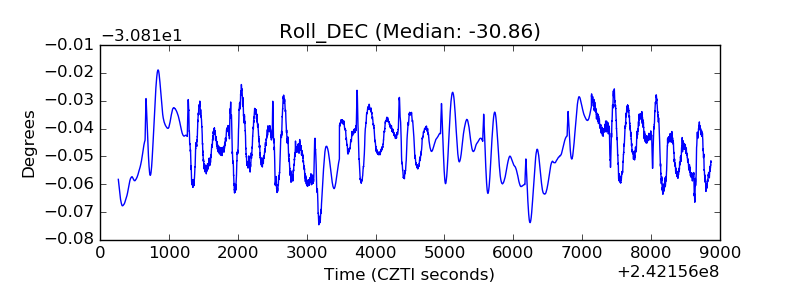 |
| _Roll_RA |  |
| Veto Counter | 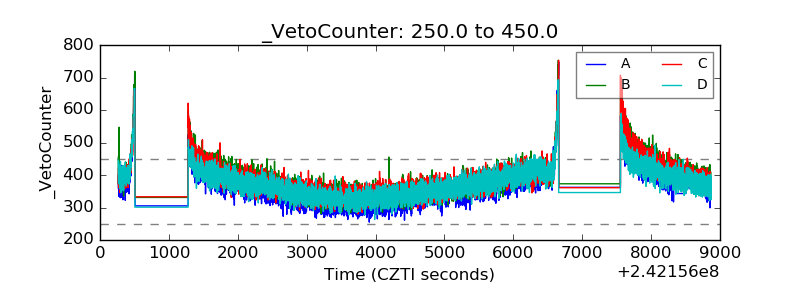 |