| Param | Original file | Final file |
|---|---|---|
| Filename | modeM0/AS1A03_126T01_9000001512_10460cztM0_level2.evt | modeM0/AS1A03_126T01_9000001512_10460cztM0_level2_quad_clean.evt |
| Size (bytes) | 321,036,480 | 60,624,000 |
| Size | 306.2 MB | 57.8 MB |
| Events in quadrant A | 1,664,812 | 130,112 |
| Events in quadrant B | 2,380,588 | 448,162 |
| Events in quadrant C | 2,327,673 | 472,360 |
| Events in quadrant D | 3,055,602 | 481,995 |
| Mode SS | |||
|---|---|---|---|
| Quadrant | BADHDUFLAG | Total packets | Discarded packets |
| A | 0 | 246 | 133 |
| B | 0 | 246 | 137 |
| C | 0 | 246 | 135 |
| D | 0 | 243 | 122 |
| Mode M0 | |||
|---|---|---|---|
| Quadrant | BADHDUFLAG | Total packets | Discarded packets |
| A | 0 | 56469 | 50395 |
| B | 0 | 28294 | 18271 |
| C | 0 | 24977 | 14610 |
| D | 0 | 29221 | 16909 |
| Mode M9 | |||
|---|---|---|---|
| Quadrant | BADHDUFLAG | Total packets | Discarded packets |
| A | 0 | 18 | 8 |
| B | 0 | 20 | 10 |
| C | 0 | 20 | 10 |
| D | 0 | 17 | 7 |
| Quadrant | Total seconds | Saturated seconds | Saturation percentage |
|---|---|---|---|
| A | 1722 | 98 | 5.691057% |
| B | 4678 | 24 | 0.513040% |
| C | 5119 | 9 | 0.175816% |
| D | 5396 | 22 | 0.407709% |
Noise dominated data is calculated using 1-second bins in cleaned event files. If a bin has >2000 counts, and if more than 50% of those come from <1% of pixels, then it is considered to be noise-dominated and hence unusable.
| Quadrant | # 1 sec bins | Bins with >0 counts | Bins with >2000 counts | High rate bins dominated by noise | Noise dominated (total time) | Noise dominated (detector-on time) | Marked lightcurve |
|---|---|---|---|---|---|---|---|
| A | 7237 | 2343 | 12 | 12 | 0.17% | 0.51% | 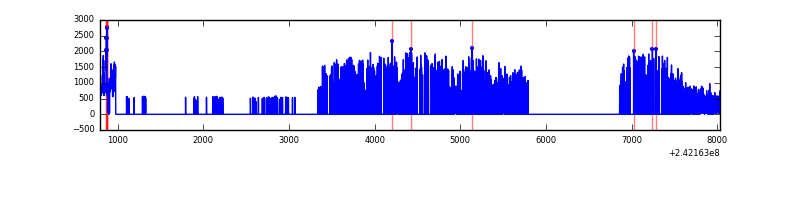 |
| B | 7236 | 5600 | 2 | 2 | 0.03% | 0.04% | 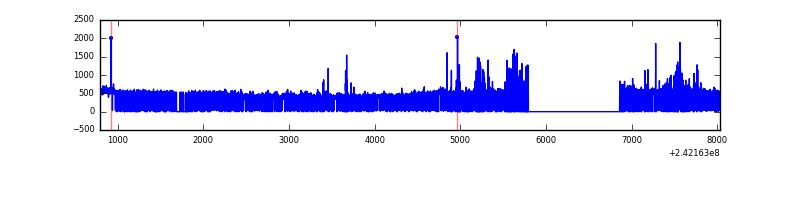 |
| C | 7237 | 5934 | 0 | 0 | 0.00% | 0.00% |  |
| D | 7237 | 5840 | 9 | 9 | 0.12% | 0.15% | 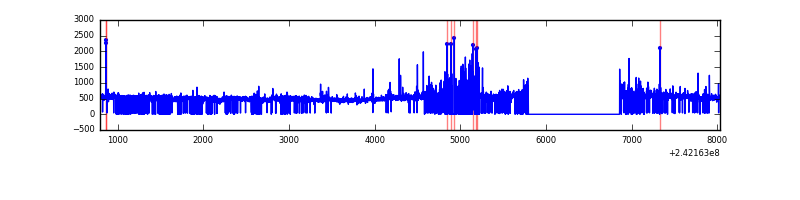 |
Top three noisy pixels from each quadrant. If the there are fewer than three noisy pixels in the level2.evt file, extra rows are filled as -1
| Pixel properties | Quadrant properties | ||||||
|---|---|---|---|---|---|---|---|
| Quadrant | DetID | PixID | Counts | Sigma | Mean | Median | Sigma |
| A | 13 | 251 | 803903 | 17972.94 | 209 | 205 | 44.7 |
| A | 5 | 16 | 28741 | 638.14 | 209 | 205 | 44.7 |
| A | 3 | 80 | 18938 | 418.92 | 209 | 205 | 44.7 |
| B | 4 | 239 | 132416 | 1229.87 | 553 | 539 | 107.2 |
| B | 0 | 219 | 34556 | 317.24 | 553 | 539 | 107.2 |
| B | 0 | 214 | 24598 | 224.37 | 553 | 539 | 107.2 |
| C | 14 | 234 | 17342 | 120.93 | 592 | 595 | 138.5 |
| C | 13 | 61 | 4439 | 27.76 | 592 | 595 | 138.5 |
| C | 3 | 202 | 1424 | 5.99 | 592 | 595 | 138.5 |
| D | 8 | 195 | 369537 | 2513.36 | 609 | 593 | 146.8 |
| D | 1 | 20 | 137997 | 936.04 | 609 | 593 | 146.8 |
| D | 12 | 233 | 132817 | 900.75 | 609 | 593 | 146.8 |
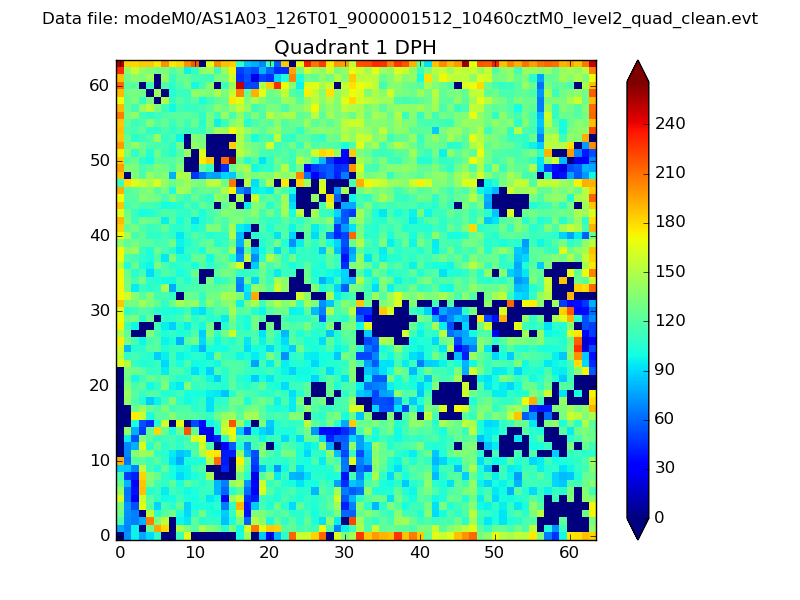
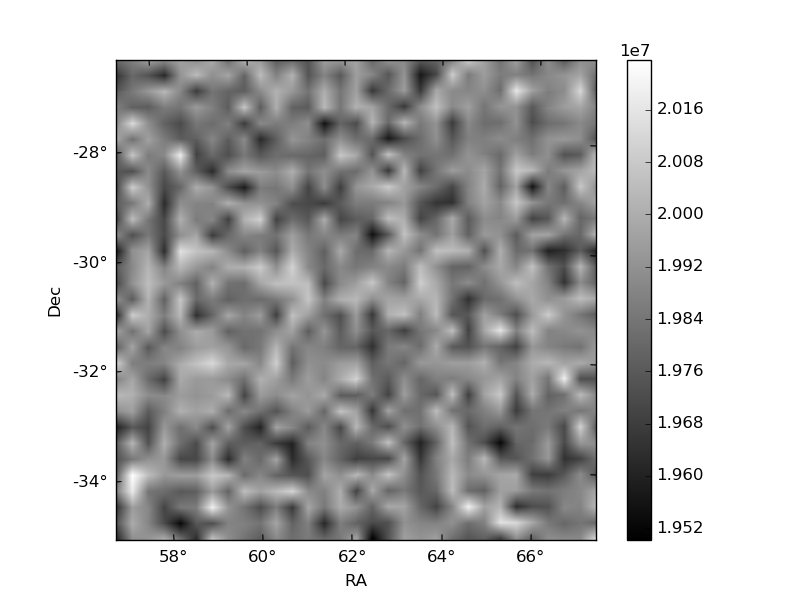
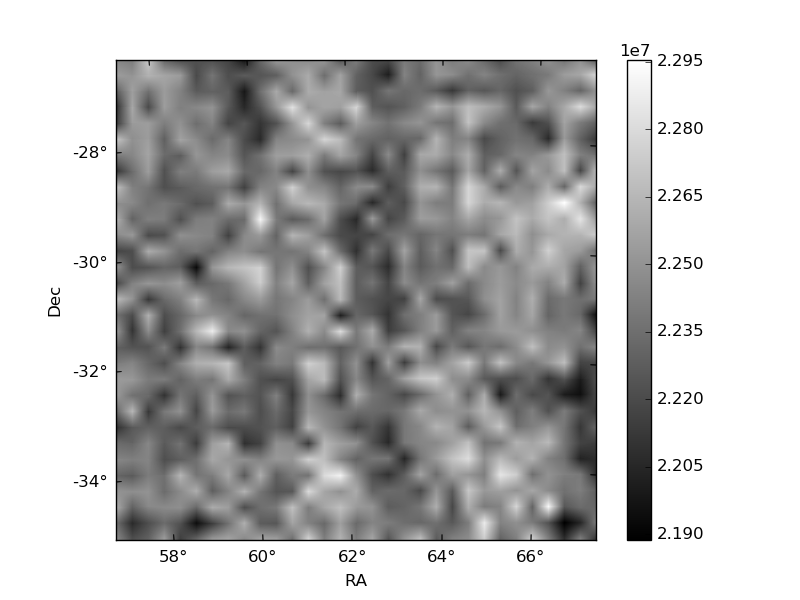
Histogram calculated using DETX and DETY for each event in the final _common_clean file
| Quadrant A | 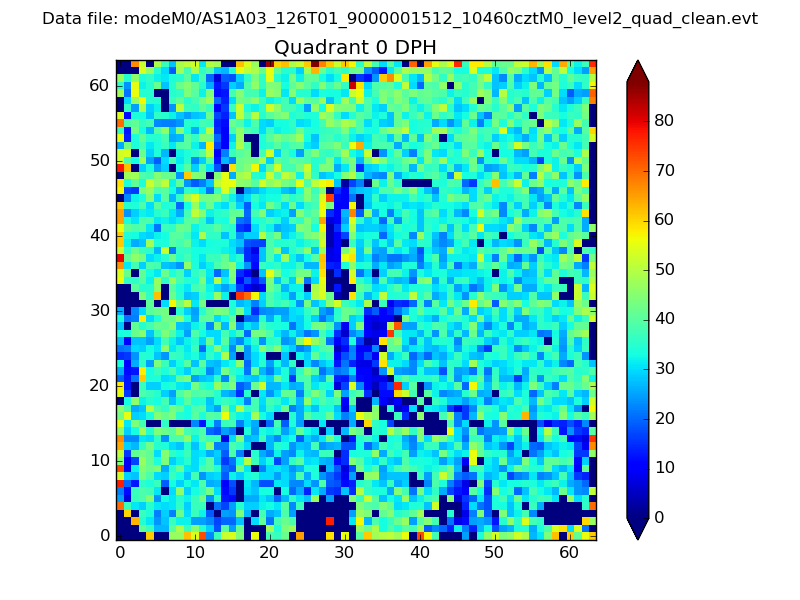 |
 |
Quadrant B |
|---|---|---|---|
| Quadrant D | 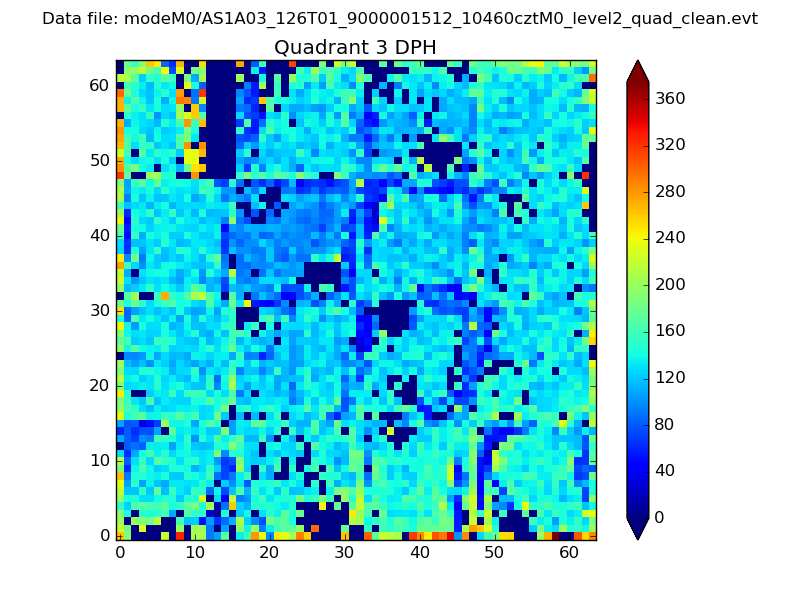 |
 |
Quadrant C |
| Plot type | Count rate plots | Images |
|---|---|---|
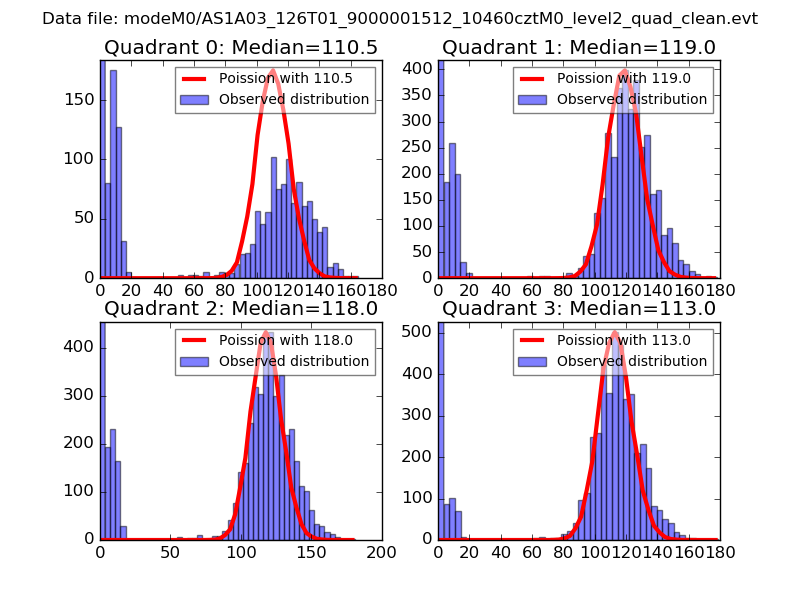
| Comparison with Poisson distribution Blue bars denote a histogram of data divided into 1 sec bins. Red curve is a Poisson curve with rate = median count rate of data. |
 |
 |
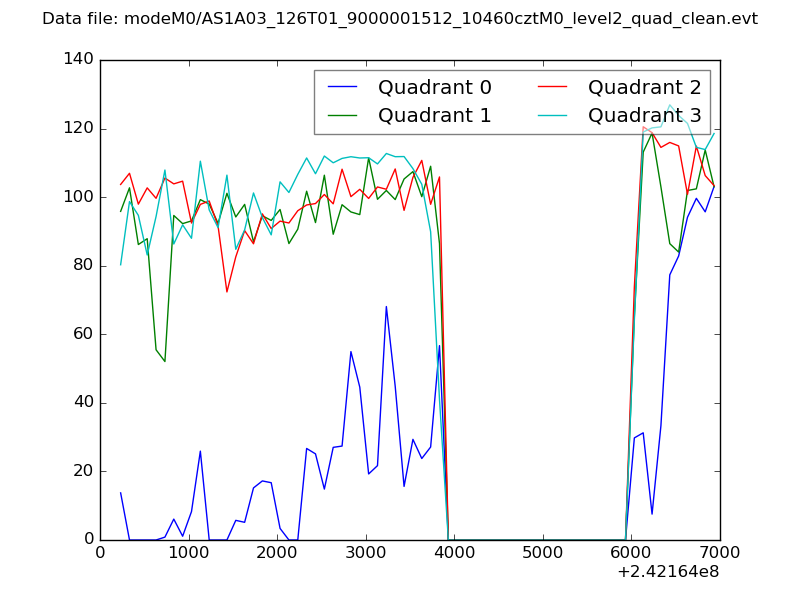
| Quadrant-wise count rates Data is divided into 100 sec bins |
 |
|
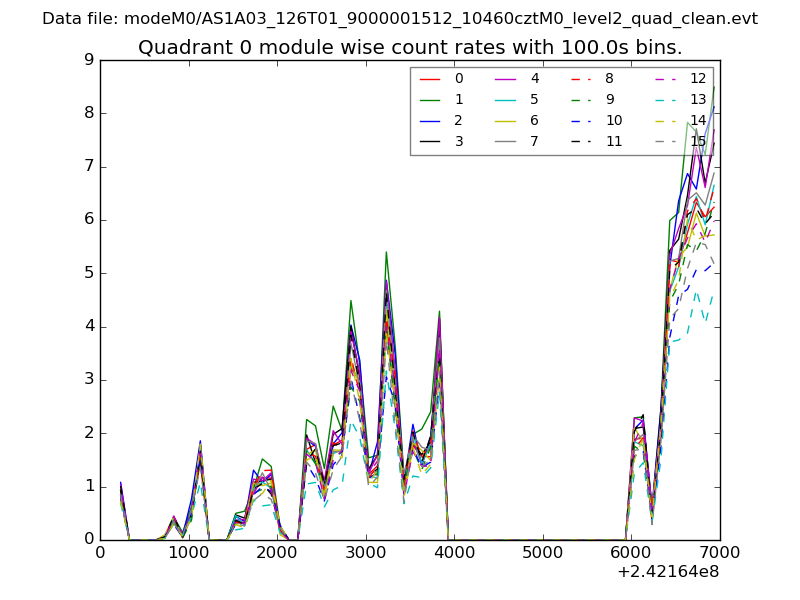
| Module-wise count rates for Quadrant A Data is divided into 100 sec bins |
 |
 |
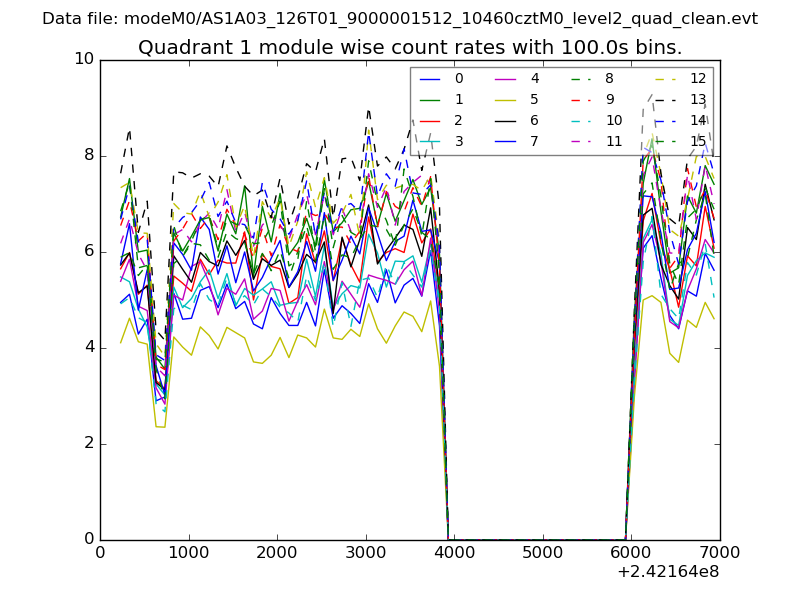
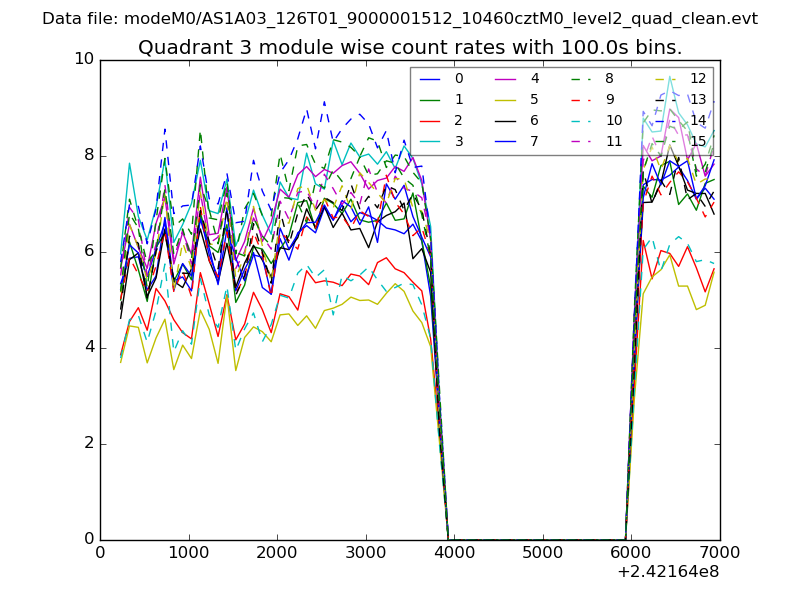
| Module-wise count rates for Quadrant B Data is divided into 100 sec bins |
 |
 |
| Module-wise count rates for Quadrant C Data is divided into 100 sec bins |
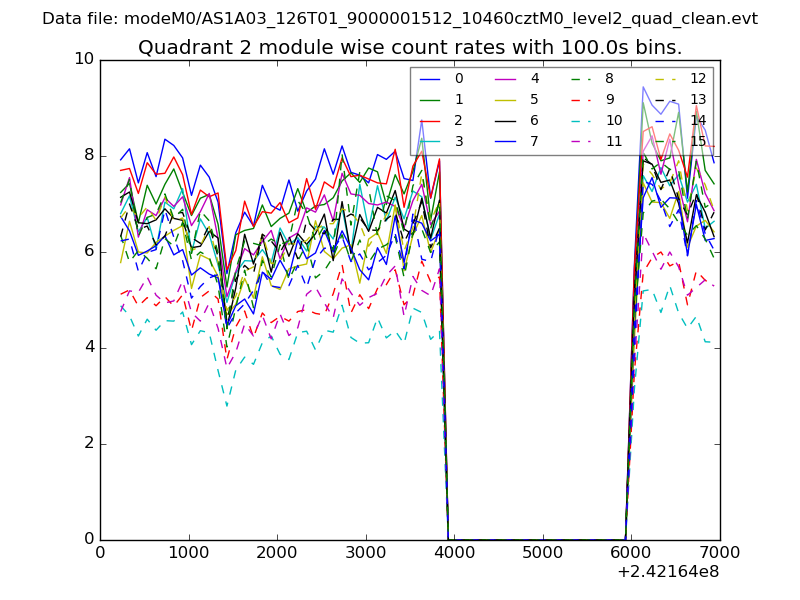 |
 |
| Module-wise count rates for Quadrant D Data is divided into 100 sec bins |
 |
 |
| Parameter | Plot |
|---|---|
| CZT HV Monitor | 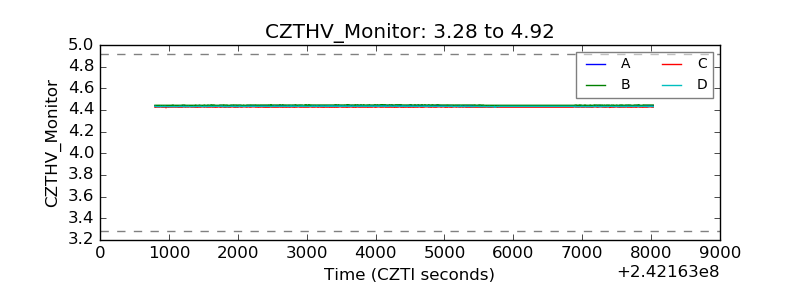 |
| D_VDD | 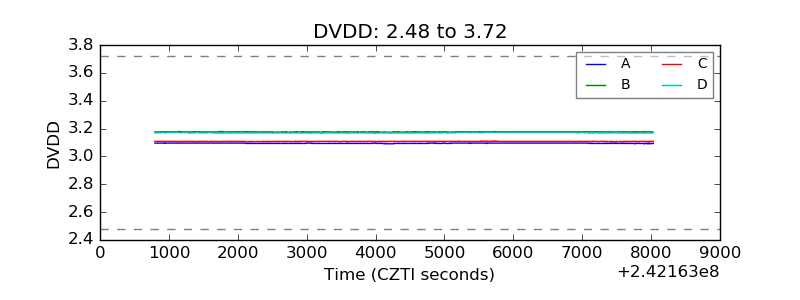 |
| Temperature 1 | 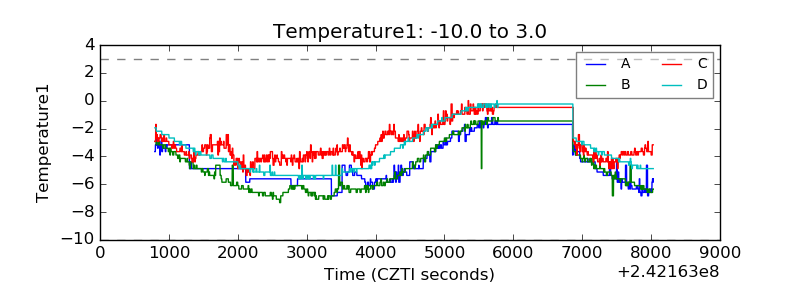 |
| Veto HV Monitor | 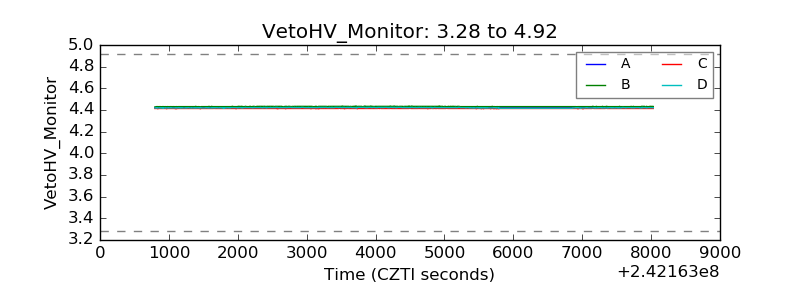 |
| Veto LLD | 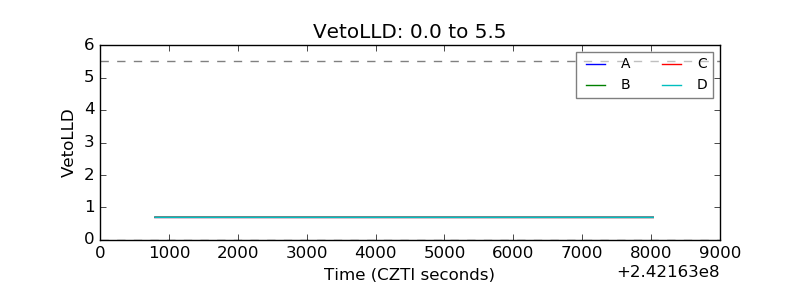 |
| Alpha Counter | 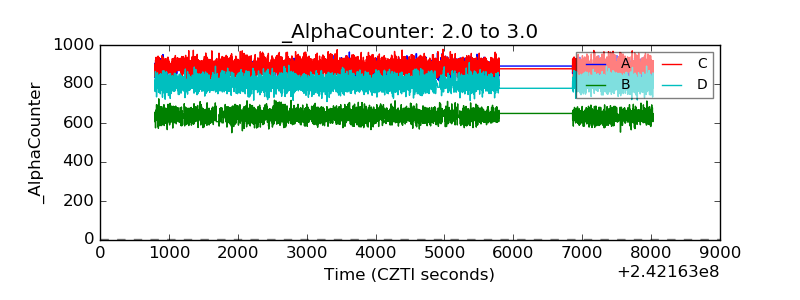 |
| _CPM_Rate | 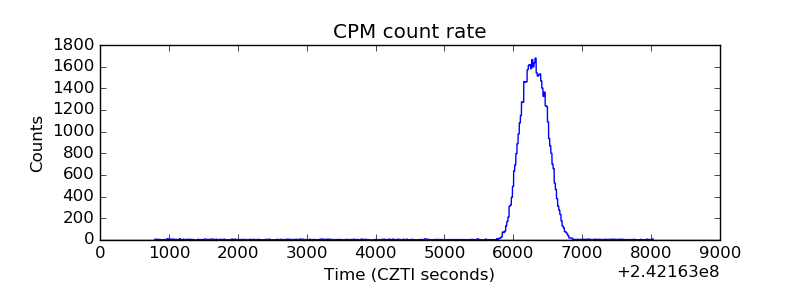 |
| CZT Counter | 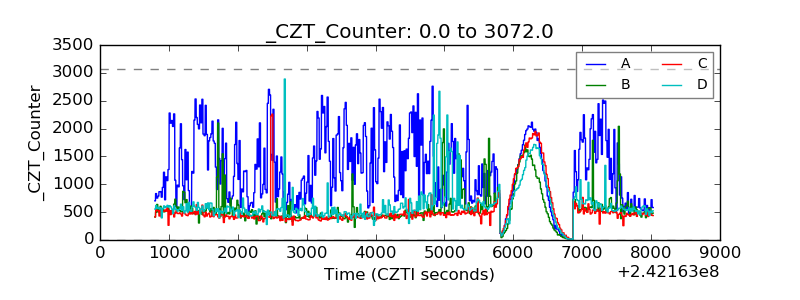 |
| +2.5 Volts monitor |  |
| +5 Volts monitor | 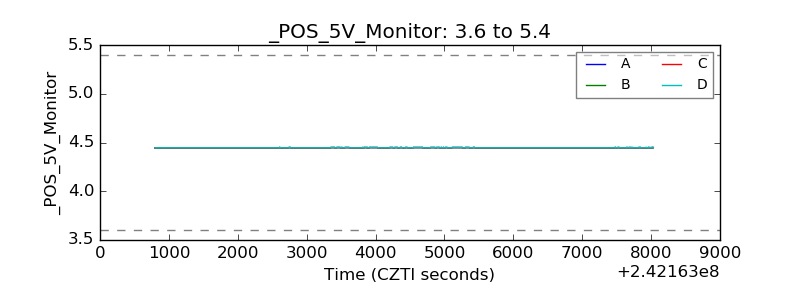 |
| _ROLL_ROT | 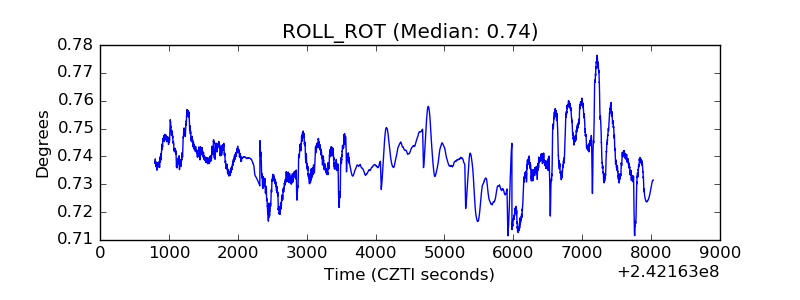 |
| _Roll_DEC | 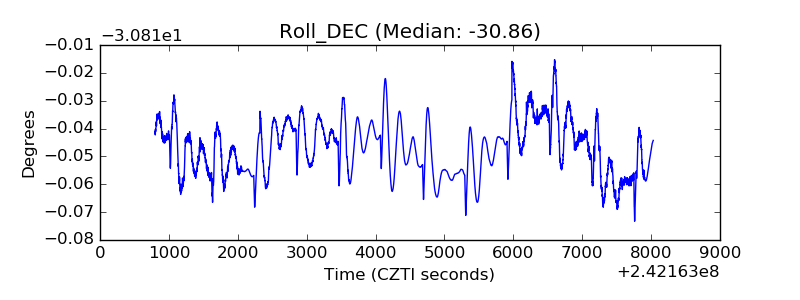 |
| _Roll_RA |  |
| Veto Counter | 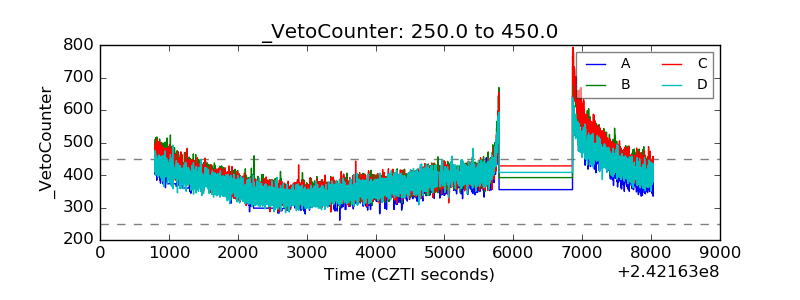 |