| Param | Original file | Final file |
|---|---|---|
| Filename | modeM0/AS1A03_126T01_9000001512_10463cztM0_level2.evt | modeM0/AS1A03_126T01_9000001512_10463cztM0_level2_quad_clean.evt |
| Size (bytes) | 389,937,600 | 80,691,840 |
| Size | 371.9 MB | 77.0 MB |
| Events in quadrant A | 3,251,740 | 397,104 |
| Events in quadrant B | 2,672,912 | 563,649 |
| Events in quadrant C | 2,518,284 | 563,551 |
| Events in quadrant D | 3,022,087 | 565,096 |
| Mode SS | |||
|---|---|---|---|
| Quadrant | BADHDUFLAG | Total packets | Discarded packets |
| A | 0 | 224 | 110 |
| B | 0 | 224 | 106 |
| C | 0 | 224 | 106 |
| D | 0 | 216 | 104 |
| Mode M0 | |||
|---|---|---|---|
| Quadrant | BADHDUFLAG | Total packets | Discarded packets |
| A | 0 | 30425 | 18123 |
| B | 0 | 24158 | 12957 |
| C | 0 | 22501 | 11662 |
| D | 0 | 25807 | 13544 |
| Mode M9 | |||
|---|---|---|---|
| Quadrant | BADHDUFLAG | Total packets | Discarded packets |
| A | 0 | 31 | 9 |
| B | 0 | 34 | 12 |
| C | 0 | 34 | 12 |
| D | 0 | 31 | 8 |
| Quadrant | Total seconds | Saturated seconds | Saturation percentage |
|---|---|---|---|
| A | 4123 | 197 | 4.778074% |
| B | 5145 | 60 | 1.166181% |
| C | 5275 | 10 | 0.189573% |
| D | 5549 | 10 | 0.180213% |
Noise dominated data is calculated using 1-second bins in cleaned event files. If a bin has >2000 counts, and if more than 50% of those come from <1% of pixels, then it is considered to be noise-dominated and hence unusable.
| Quadrant | # 1 sec bins | Bins with >0 counts | Bins with >2000 counts | High rate bins dominated by noise | Noise dominated (total time) | Noise dominated (detector-on time) | Marked lightcurve |
|---|---|---|---|---|---|---|---|
| A | 7407 | 4877 | 161 | 161 | 2.17% | 3.30% | 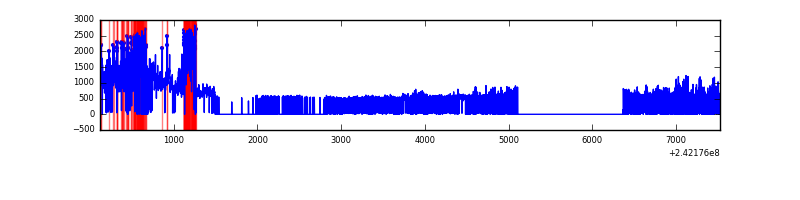 |
| B | 7408 | 5864 | 16 | 16 | 0.22% | 0.27% | 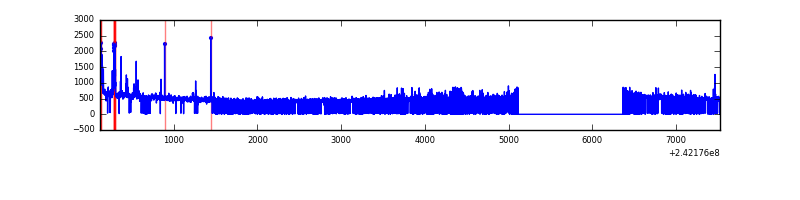 |
| C | 7408 | 5969 | 0 | 0 | 0.00% | 0.00% | 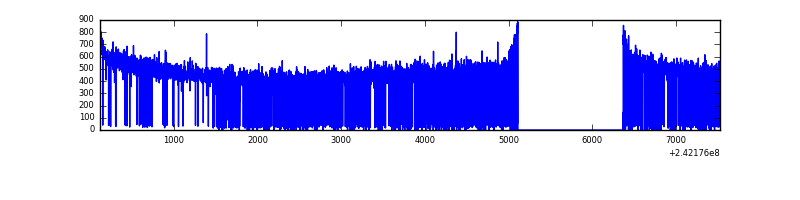 |
| D | 7408 | 5832 | 2 | 2 | 0.03% | 0.03% | 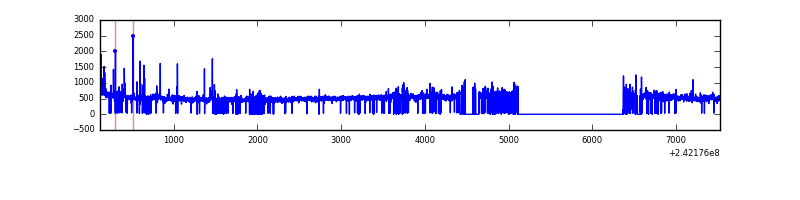 |
Top three noisy pixels from each quadrant. If the there are fewer than three noisy pixels in the level2.evt file, extra rows are filled as -1
| Pixel properties | Quadrant properties | ||||||
|---|---|---|---|---|---|---|---|
| Quadrant | DetID | PixID | Counts | Sigma | Mean | Median | Sigma |
| A | 13 | 251 | 1210428 | 11632.33 | 510 | 500 | 104.0 |
| A | 3 | 80 | 48225 | 458.83 | 510 | 500 | 104.0 |
| A | 1 | 162 | 15453 | 143.76 | 510 | 500 | 104.0 |
| B | 4 | 239 | 133762 | 1094.09 | 637 | 623 | 121.7 |
| B | 0 | 214 | 31570 | 254.31 | 637 | 623 | 121.7 |
| B | 12 | 111 | 12908 | 100.95 | 637 | 623 | 121.7 |
| C | 14 | 67 | 5026 | 29.31 | 644 | 649 | 149.3 |
| C | 13 | 61 | 4791 | 27.74 | 644 | 649 | 149.3 |
| C | 8 | 222 | 1858 | 8.1 | 644 | 649 | 149.3 |
| D | 8 | 195 | 311916 | 1998.44 | 657 | 639 | 155.8 |
| D | 1 | 20 | 65269 | 414.93 | 657 | 639 | 155.8 |
| D | 1 | 52 | 61481 | 390.61 | 657 | 639 | 155.8 |
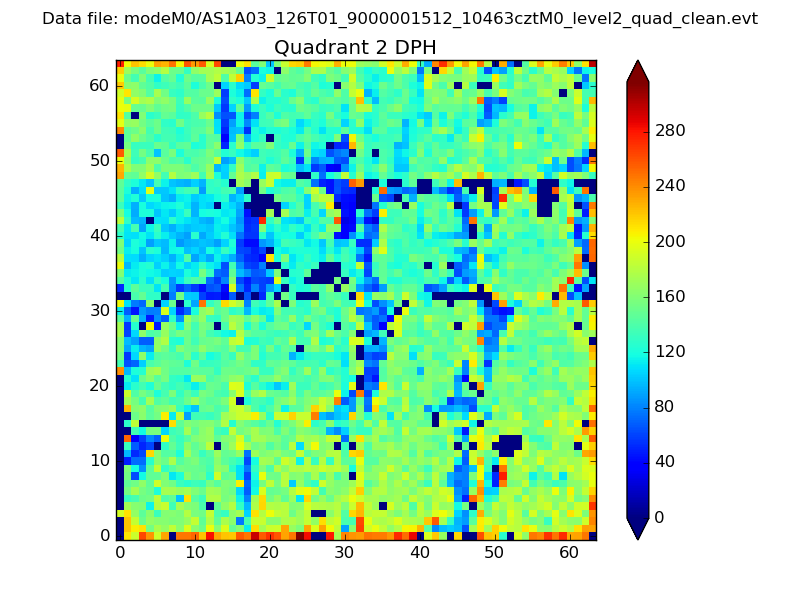
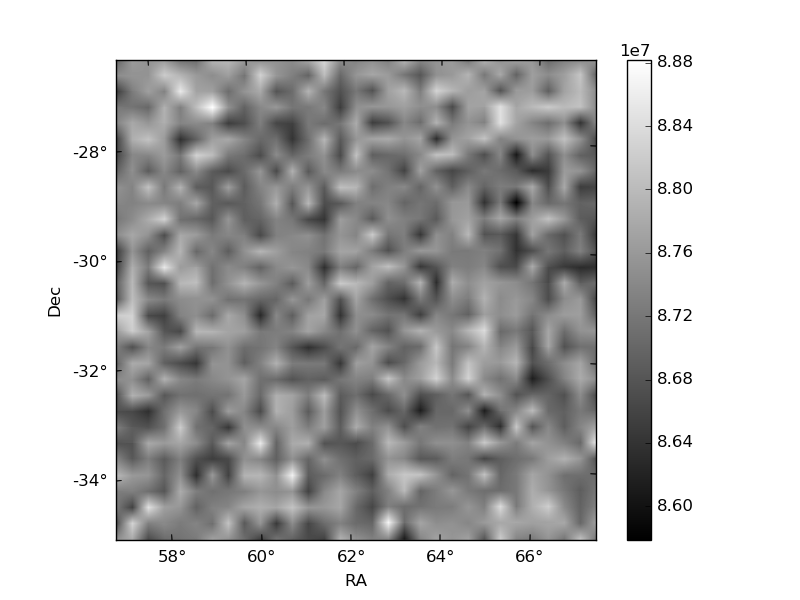
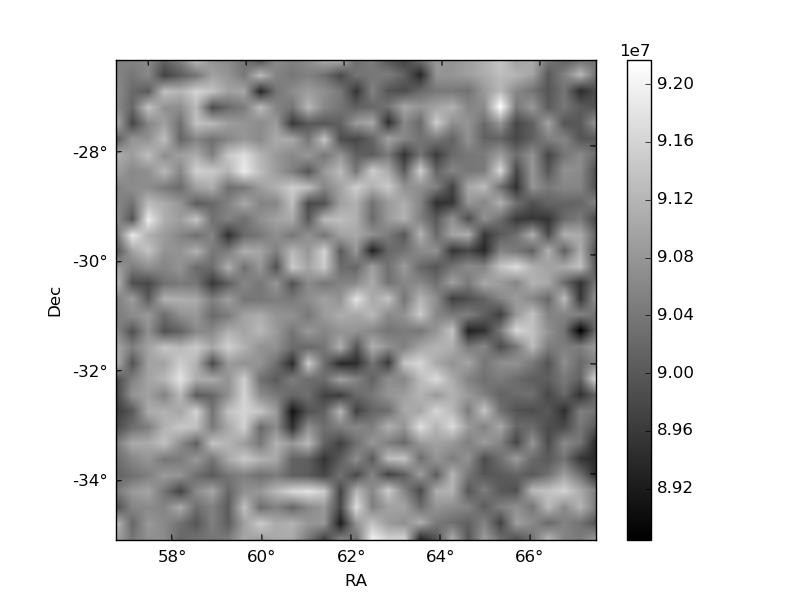
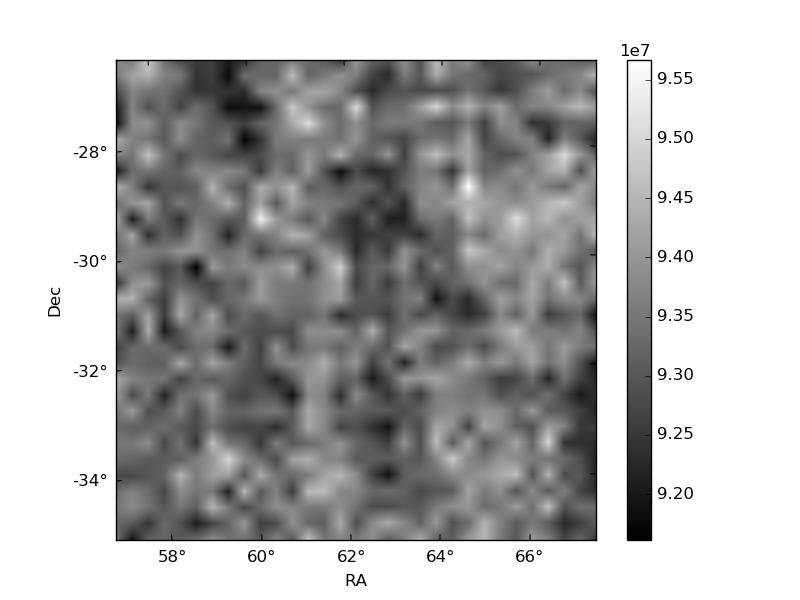
Histogram calculated using DETX and DETY for each event in the final _common_clean file
| Quadrant A |  |
 |
Quadrant B |
|---|---|---|---|
| Quadrant D | 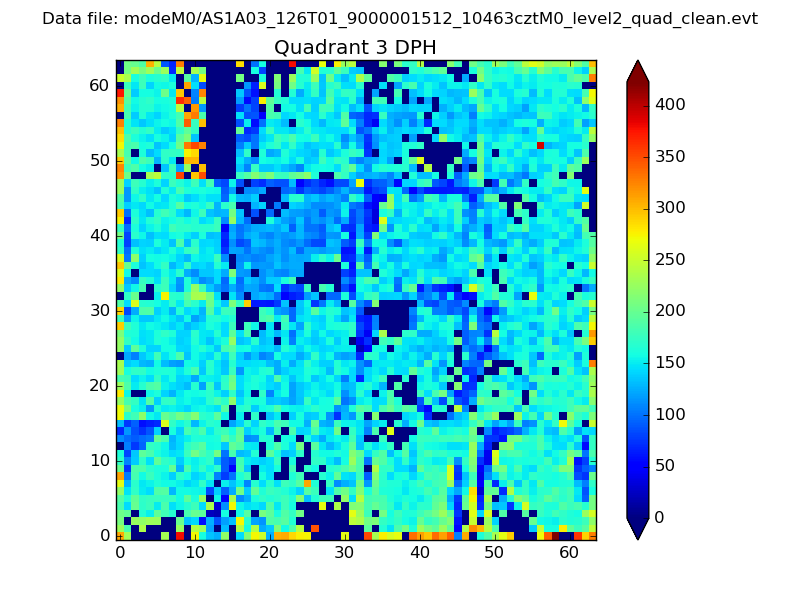 |
 |
Quadrant C |
| Plot type | Count rate plots | Images |
|---|---|---|
| Comparison with Poisson distribution Blue bars denote a histogram of data divided into 1 sec bins. Red curve is a Poisson curve with rate = median count rate of data. |
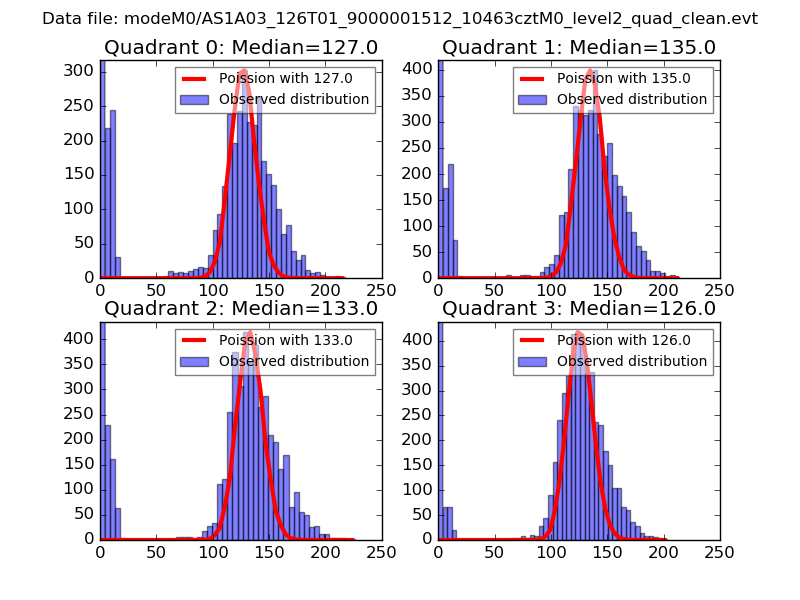 |
 |
| Quadrant-wise count rates Data is divided into 100 sec bins |
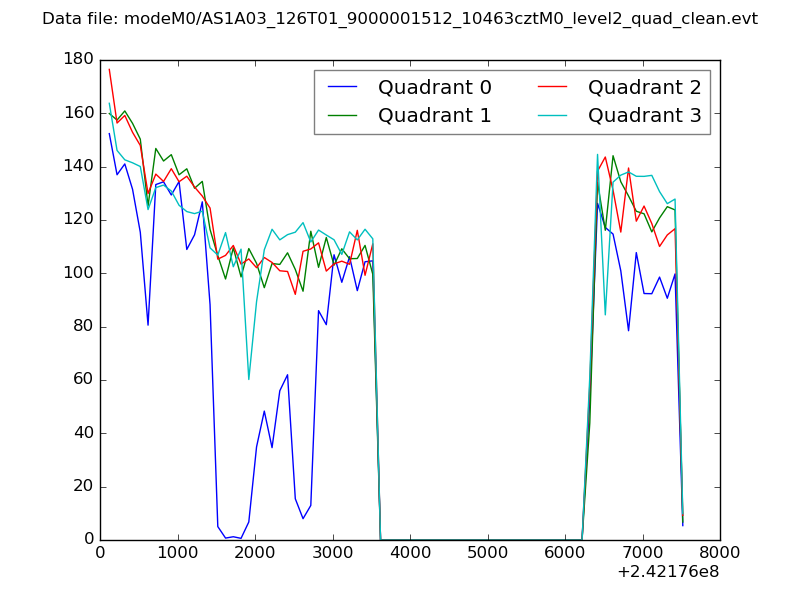 |
|
| Module-wise count rates for Quadrant A Data is divided into 100 sec bins |
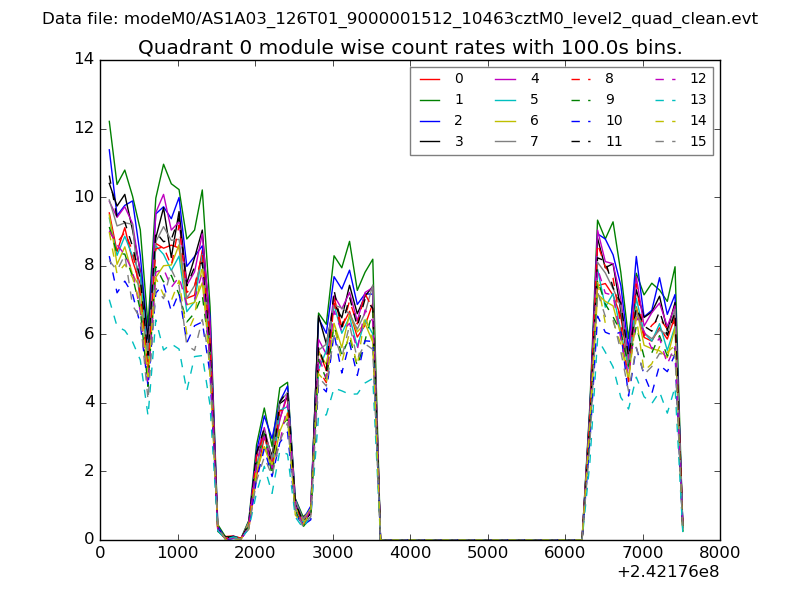 |
 |
| Module-wise count rates for Quadrant B Data is divided into 100 sec bins |
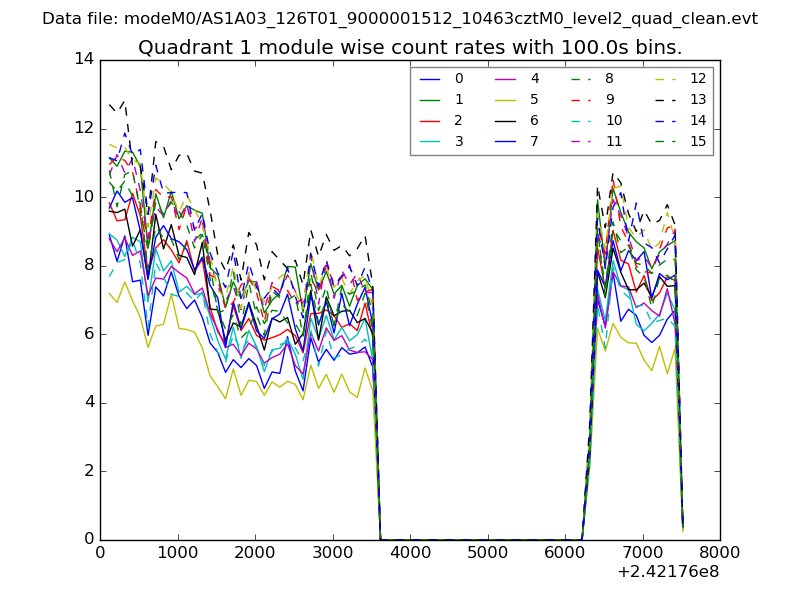 |
 |
| Module-wise count rates for Quadrant C Data is divided into 100 sec bins |
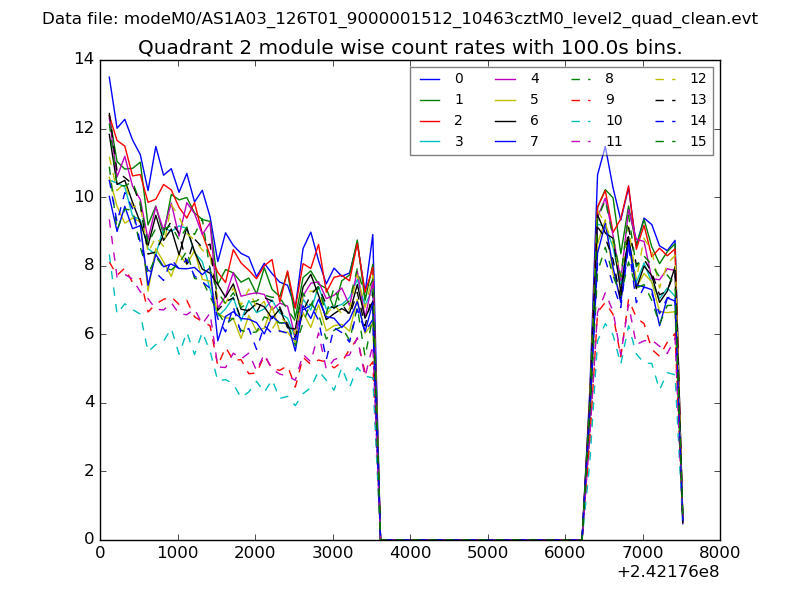 |
 |
| Module-wise count rates for Quadrant D Data is divided into 100 sec bins |
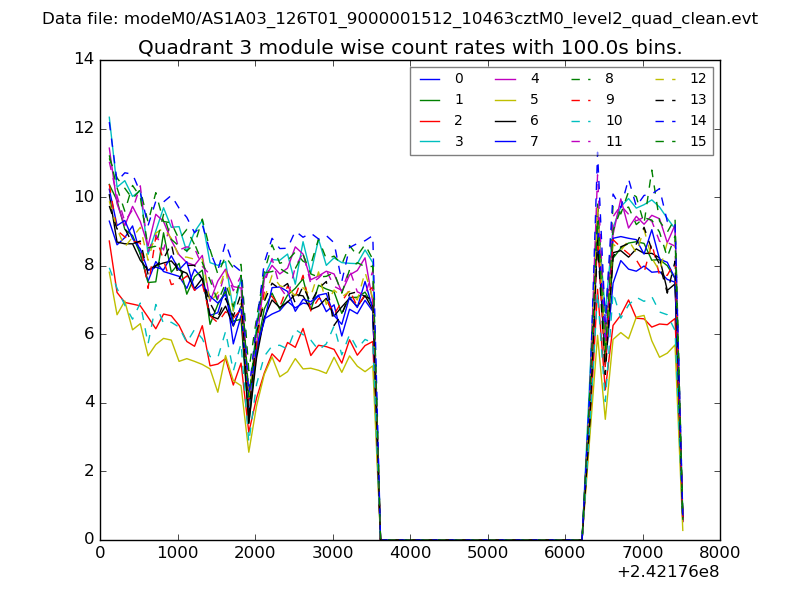 |
 |
| Parameter | Plot |
|---|---|
| CZT HV Monitor | 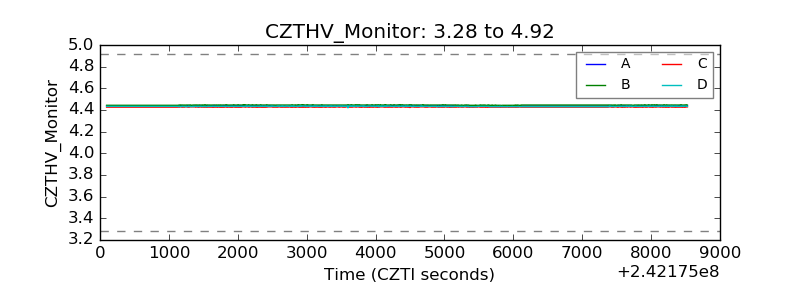 |
| D_VDD | 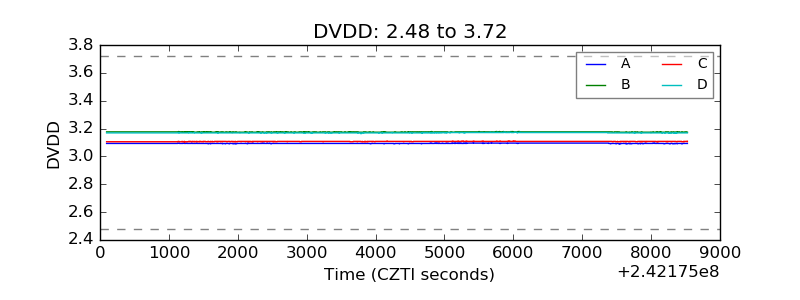 |
| Temperature 1 | 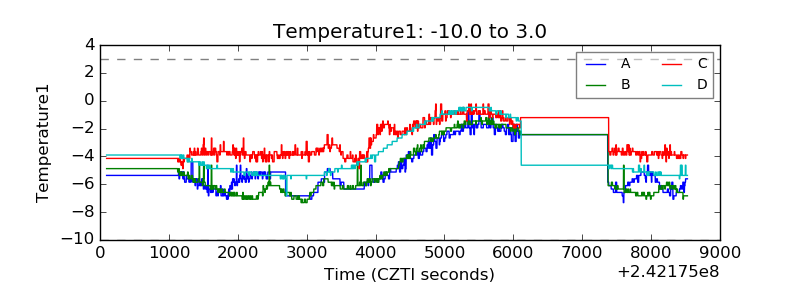 |
| Veto HV Monitor | 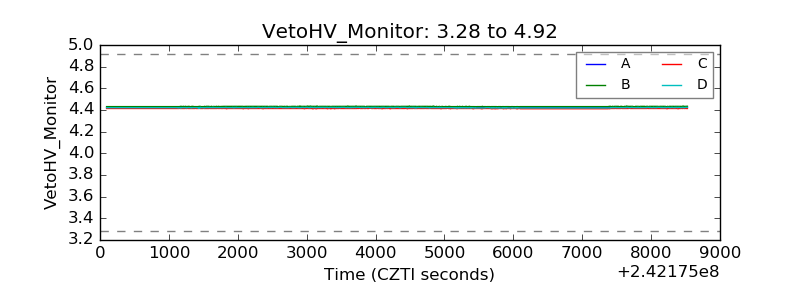 |
| Veto LLD |  |
| Alpha Counter | 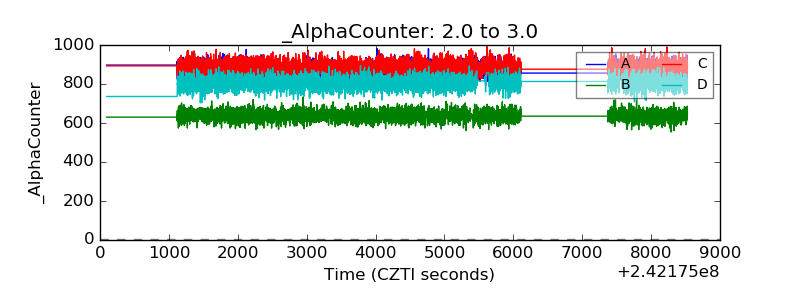 |
| _CPM_Rate | 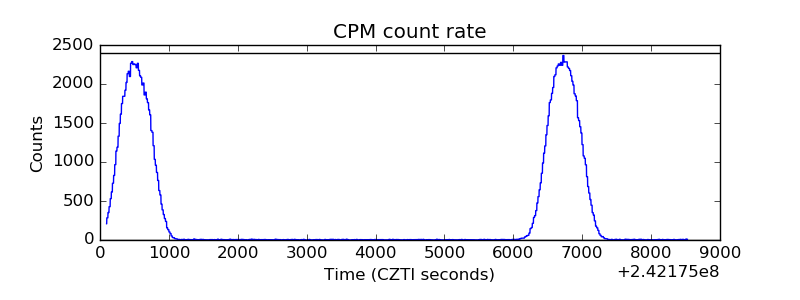 |
| CZT Counter |  |
| +2.5 Volts monitor |  |
| +5 Volts monitor | 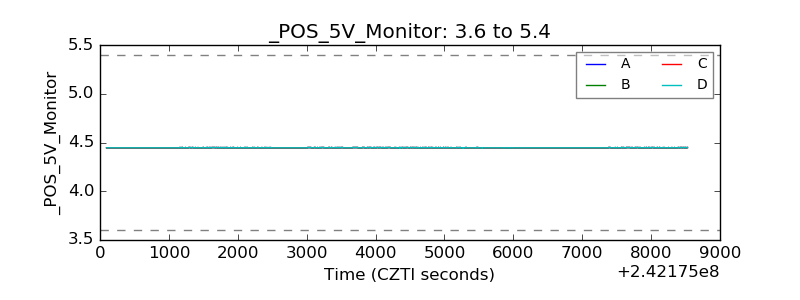 |
| _ROLL_ROT | 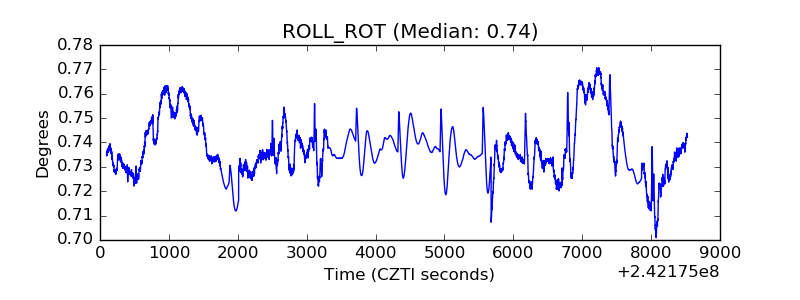 |
| _Roll_DEC | 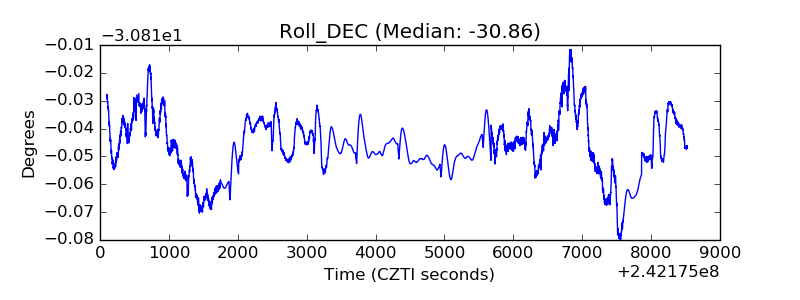 |
| _Roll_RA |  |
| Veto Counter | 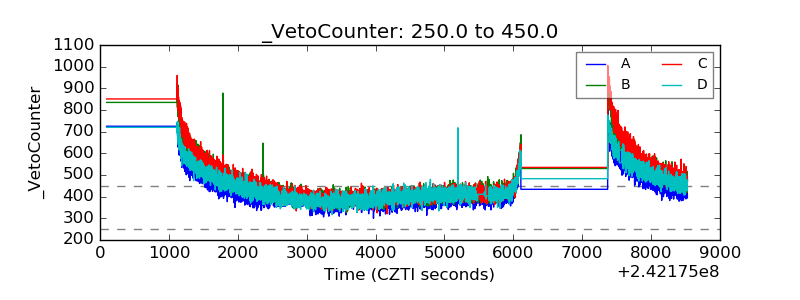 |