| Param | Original file | Final file |
|---|---|---|
| Filename | modeM0/AS1A03_126T01_9000001512_10464cztM0_level2.evt | modeM0/AS1A03_126T01_9000001512_10464cztM0_level2_quad_clean.evt |
| Size (bytes) | 501,255,360 | 102,271,680 |
| Size | 478.0 MB | 97.5 MB |
| Events in quadrant A | 3,590,637 | 659,969 |
| Events in quadrant B | 3,798,247 | 682,372 |
| Events in quadrant C | 3,259,916 | 672,566 |
| Events in quadrant D | 4,083,674 | 622,083 |
| Mode SS | |||
|---|---|---|---|
| Quadrant | BADHDUFLAG | Total packets | Discarded packets |
| A | 0 | 134 | 0 |
| B | 0 | 134 | 0 |
| C | 0 | 134 | 0 |
| D | 0 | 134 | 0 |
| Mode M0 | |||
|---|---|---|---|
| Quadrant | BADHDUFLAG | Total packets | Discarded packets |
| A | 0 | 14865 | 3 |
| B | 0 | 15473 | 2 |
| C | 0 | 13840 | 2 |
| D | 0 | 16327 | 2 |
| Mode M9 | |||
|---|---|---|---|
| Quadrant | BADHDUFLAG | Total packets | Discarded packets |
| A | 0 | 17 | 0 |
| B | 0 | 17 | 0 |
| C | 0 | 17 | 0 |
| D | 0 | 18 | 0 |
| Quadrant | Total seconds | Saturated seconds | Saturation percentage |
|---|---|---|---|
| A | 6602 | 18 | 0.272645% |
| B | 6602 | 177 | 2.681006% |
| C | 6602 | 28 | 0.424114% |
| D | 6602 | 130 | 1.969100% |
Noise dominated data is calculated using 1-second bins in cleaned event files. If a bin has >2000 counts, and if more than 50% of those come from <1% of pixels, then it is considered to be noise-dominated and hence unusable.
| Quadrant | # 1 sec bins | Bins with >0 counts | Bins with >2000 counts | High rate bins dominated by noise | Noise dominated (total time) | Noise dominated (detector-on time) | Marked lightcurve |
|---|---|---|---|---|---|---|---|
| A | 7907 | 6604 | 2 | 2 | 0.03% | 0.03% | 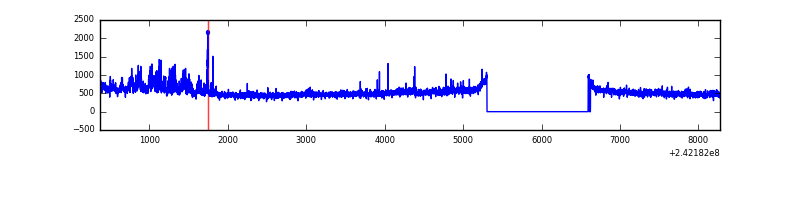 |
| B | 7907 | 6604 | 117 | 117 | 1.48% | 1.77% | 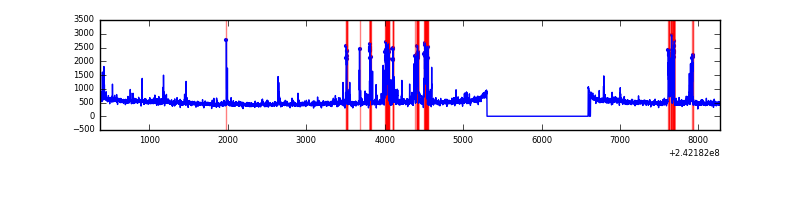 |
| C | 7907 | 6603 | 3 | 3 | 0.04% | 0.05% | 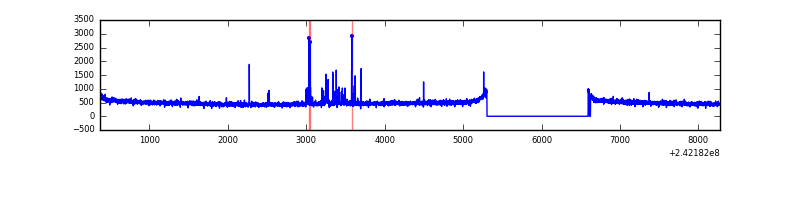 |
| D | 7907 | 6604 | 89 | 89 | 1.13% | 1.35% | 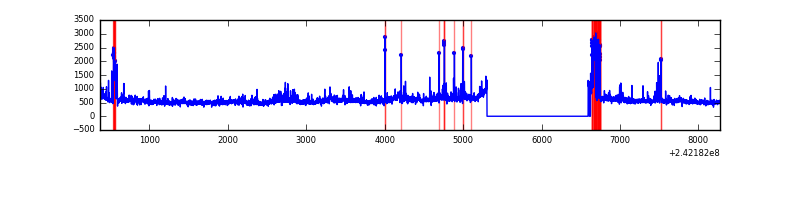 |
Top three noisy pixels from each quadrant. If the there are fewer than three noisy pixels in the level2.evt file, extra rows are filled as -1
| Pixel properties | Quadrant properties | ||||||
|---|---|---|---|---|---|---|---|
| Quadrant | DetID | PixID | Counts | Sigma | Mean | Median | Sigma |
| A | 13 | 251 | 338430 | 2065.16 | 813 | 796 | 163.5 |
| A | 3 | 80 | 73851 | 446.85 | 813 | 796 | 163.5 |
| A | 1 | 162 | 21748 | 128.15 | 813 | 796 | 163.5 |
| B | 4 | 239 | 519331 | 3391.77 | 819 | 801 | 152.9 |
| B | 0 | 214 | 46395 | 298.24 | 819 | 801 | 152.9 |
| B | 0 | 187 | 23718 | 149.9 | 819 | 801 | 152.9 |
| C | 14 | 234 | 78414 | 414.31 | 813 | 818 | 187.3 |
| C | 13 | 61 | 6031 | 27.83 | 813 | 818 | 187.3 |
| C | 14 | 67 | 6014 | 27.74 | 813 | 818 | 187.3 |
| D | 8 | 195 | 477410 | 2544.64 | 788 | 768 | 187.3 |
| D | 1 | 52 | 259346 | 1380.47 | 788 | 768 | 187.3 |
| D | 1 | 20 | 188876 | 1004.25 | 788 | 768 | 187.3 |
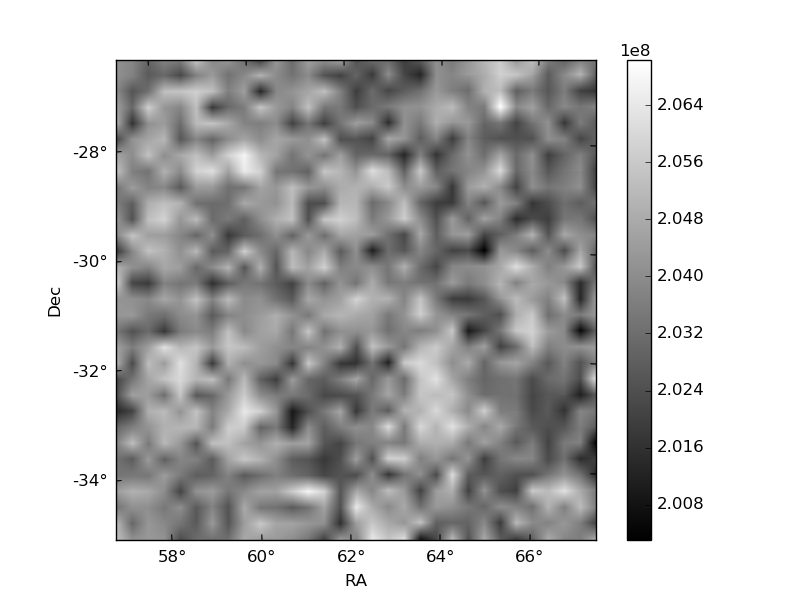
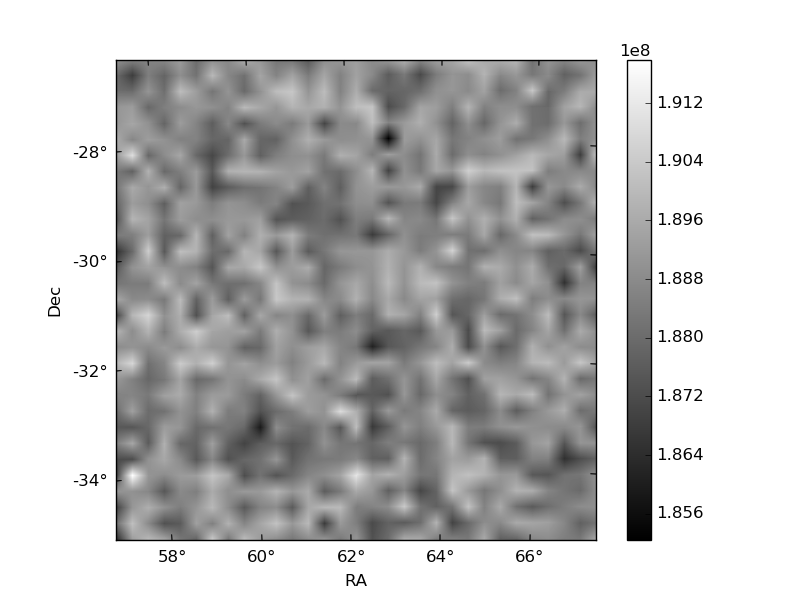
Histogram calculated using DETX and DETY for each event in the final _common_clean file
| Quadrant A | 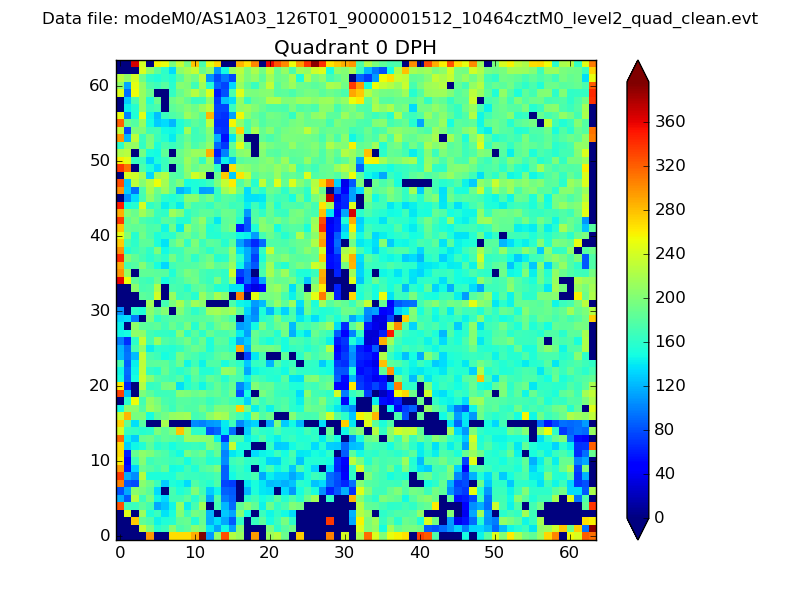 |
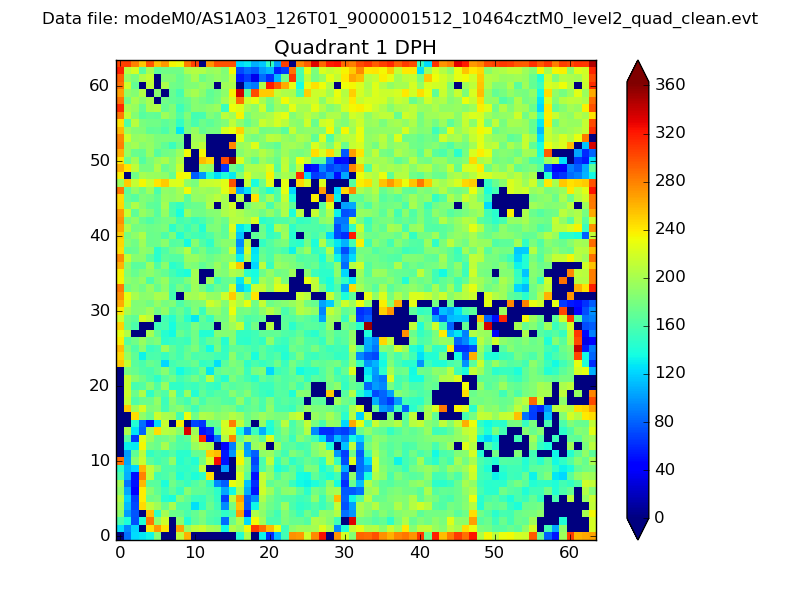 |
Quadrant B |
|---|---|---|---|
| Quadrant D |  |
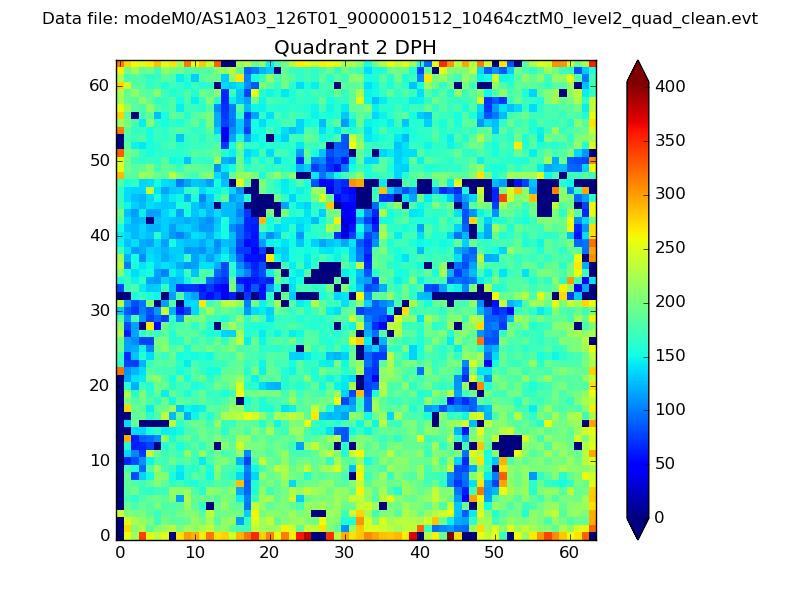 |
Quadrant C |
| Plot type | Count rate plots | Images |
|---|---|---|
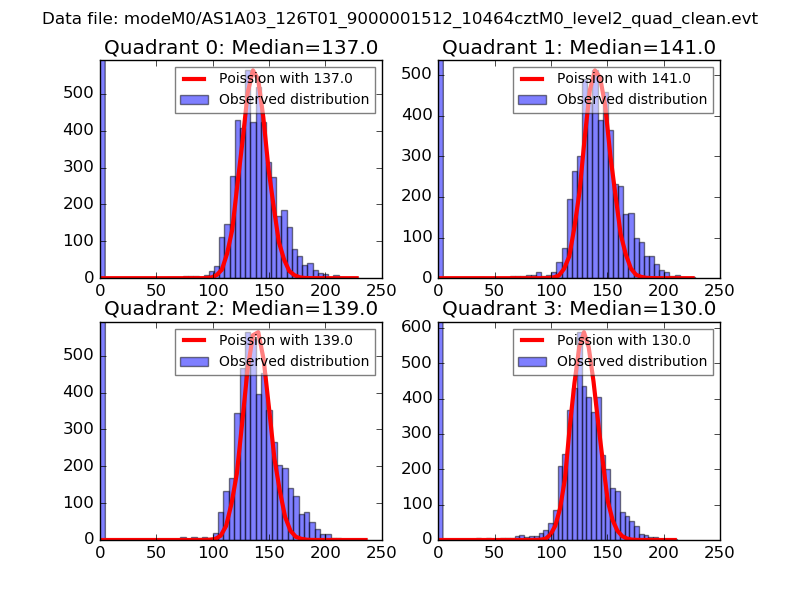
| Comparison with Poisson distribution Blue bars denote a histogram of data divided into 1 sec bins. Red curve is a Poisson curve with rate = median count rate of data. |
 |
 |
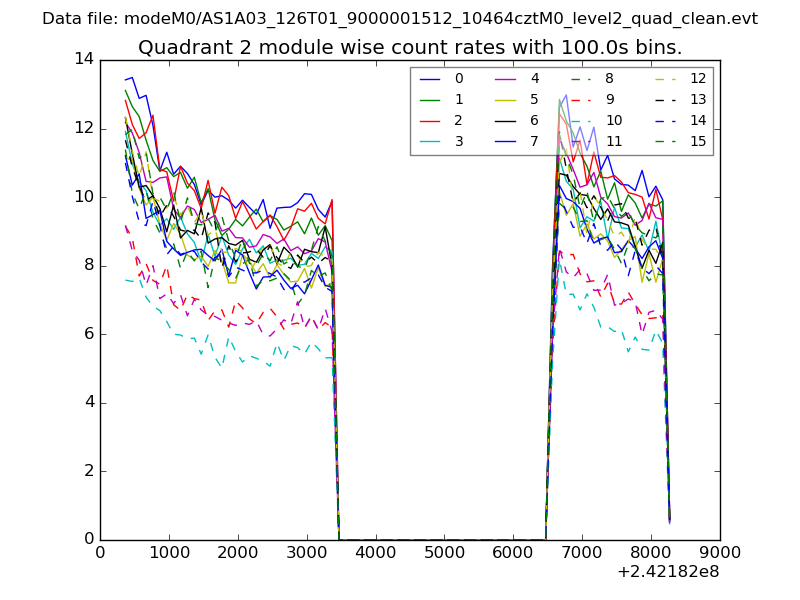
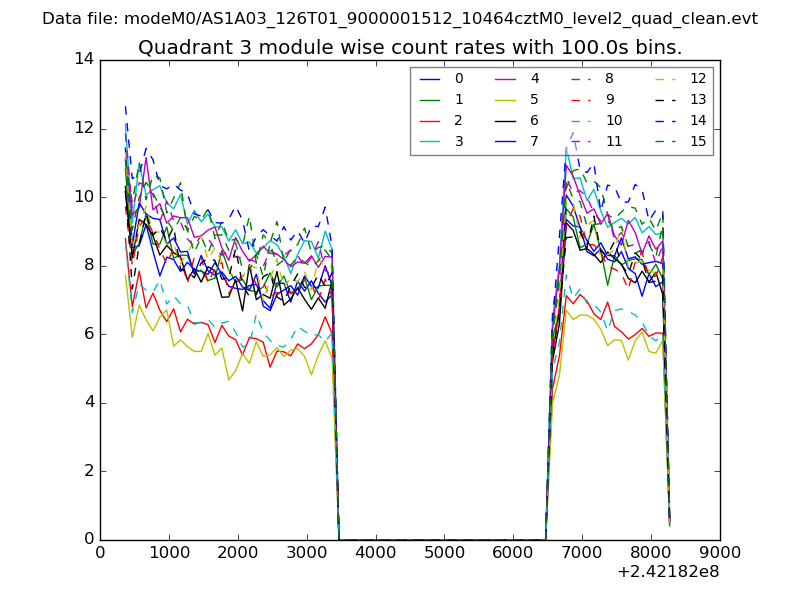
| Quadrant-wise count rates Data is divided into 100 sec bins |
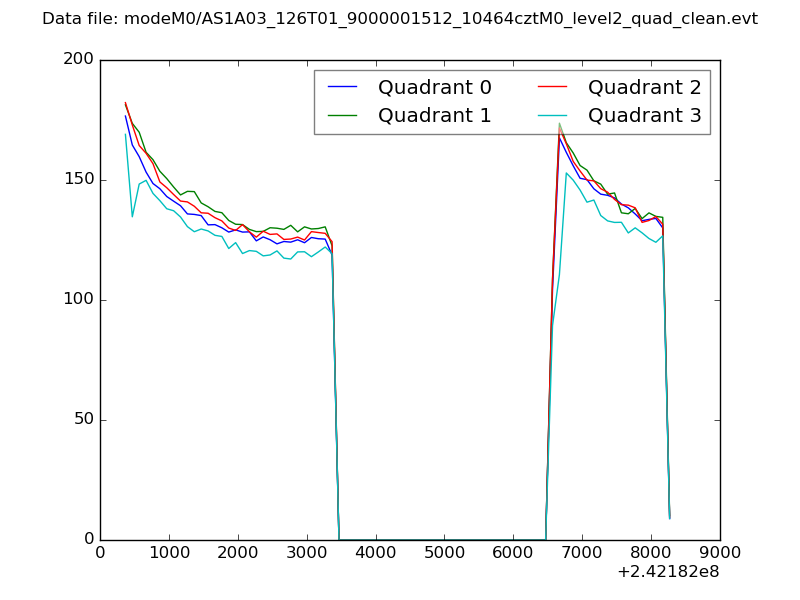 |
|
| Module-wise count rates for Quadrant A Data is divided into 100 sec bins |
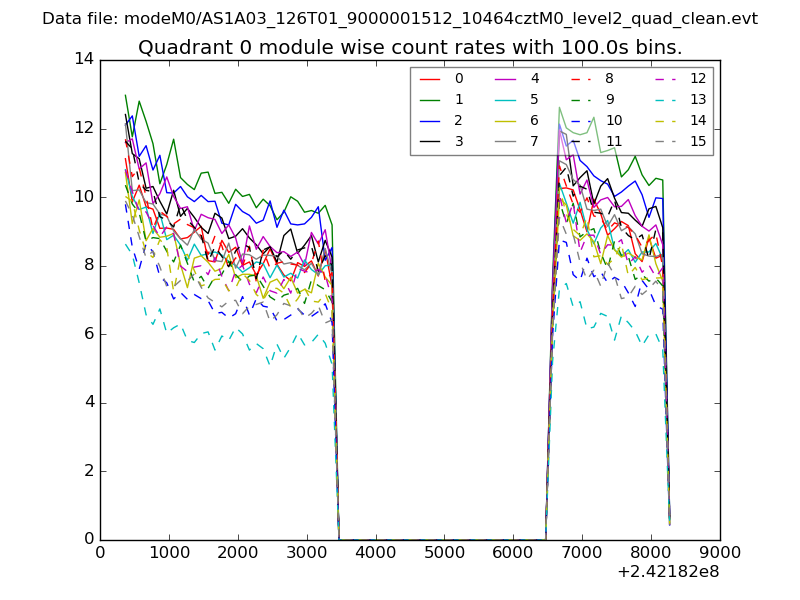 |
 |
| Module-wise count rates for Quadrant B Data is divided into 100 sec bins |
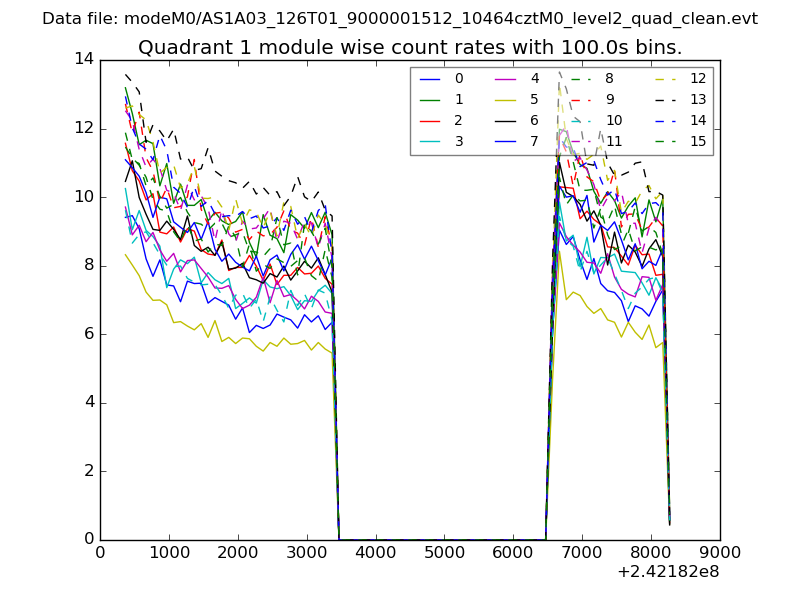 |
 |
| Module-wise count rates for Quadrant C Data is divided into 100 sec bins |
 |
 |
| Module-wise count rates for Quadrant D Data is divided into 100 sec bins |
 |
 |
| Parameter | Plot |
|---|---|
| CZT HV Monitor | 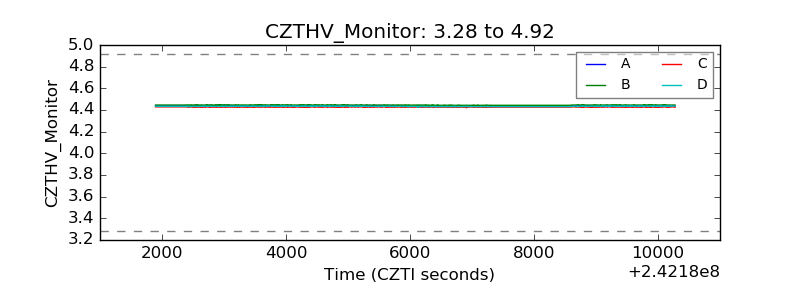 |
| D_VDD | 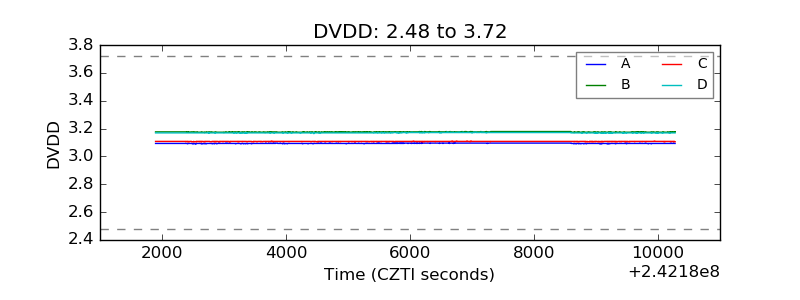 |
| Temperature 1 | 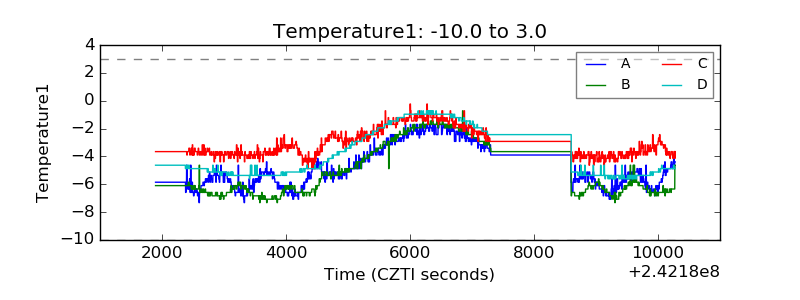 |
| Veto HV Monitor | 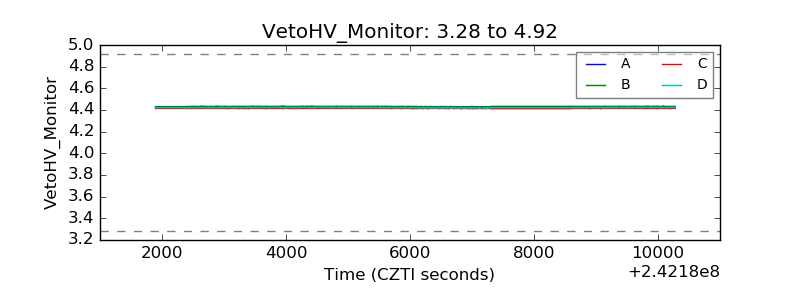 |
| Veto LLD | 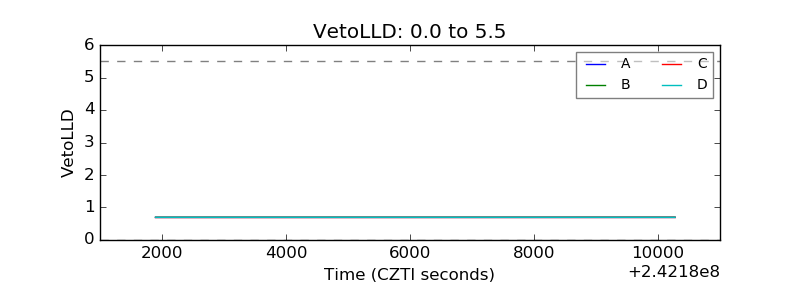 |
| Alpha Counter | 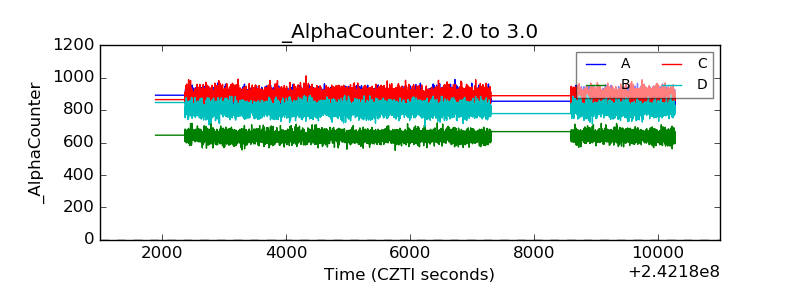 |
| _CPM_Rate | 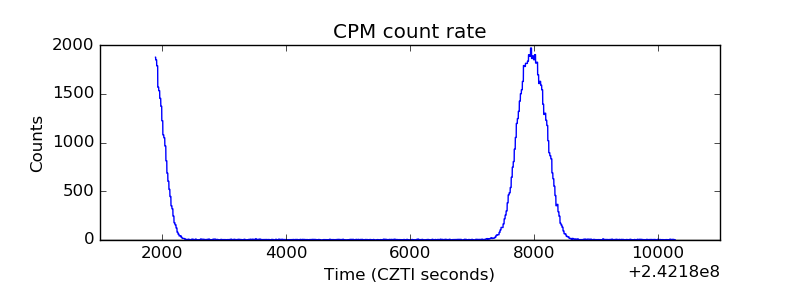 |
| CZT Counter |  |
| +2.5 Volts monitor |  |
| +5 Volts monitor |  |
| _ROLL_ROT | 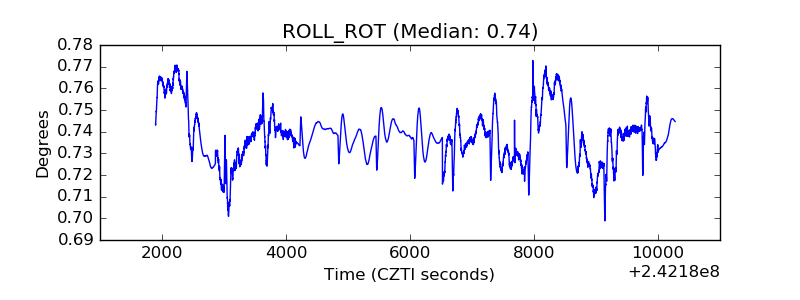 |
| _Roll_DEC | 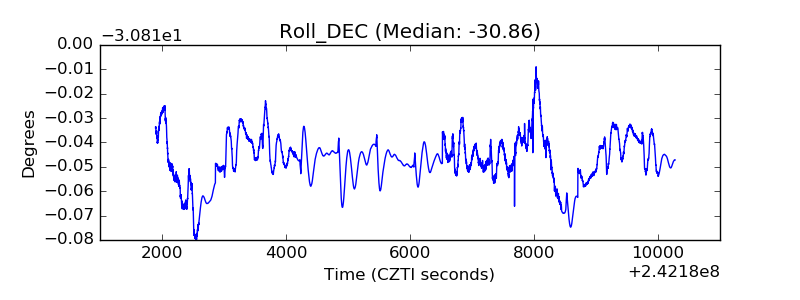 |
| _Roll_RA |  |
| Veto Counter | 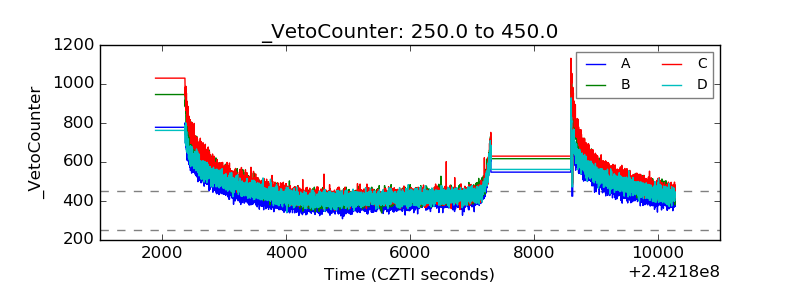 |