| Param | Original file | Final file |
|---|---|---|
| Filename | modeM0/AS1A03_126T01_9000001512_10465cztM0_level2.evt | modeM0/AS1A03_126T01_9000001512_10465cztM0_level2_quad_clean.evt |
| Size (bytes) | 353,445,120 | 67,700,160 |
| Size | 337.1 MB | 64.6 MB |
| Events in quadrant A | 2,452,228 | 418,999 |
| Events in quadrant B | 2,411,628 | 413,820 |
| Events in quadrant C | 2,348,244 | 428,886 |
| Events in quadrant D | 3,159,291 | 446,640 |
| Mode SS | |||
|---|---|---|---|
| Quadrant | BADHDUFLAG | Total packets | Discarded packets |
| A | 0 | 242 | 133 |
| B | 0 | 242 | 138 |
| C | 0 | 242 | 132 |
| D | 0 | 231 | 121 |
| Mode M0 | |||
|---|---|---|---|
| Quadrant | BADHDUFLAG | Total packets | Discarded packets |
| A | 0 | 23907 | 13802 |
| B | 0 | 31116 | 21231 |
| C | 0 | 24519 | 14426 |
| D | 0 | 29399 | 16857 |
| Mode M9 | |||
|---|---|---|---|
| Quadrant | BADHDUFLAG | Total packets | Discarded packets |
| A | 0 | 25 | 12 |
| B | 0 | 26 | 13 |
| C | 0 | 26 | 13 |
| D | 0 | 22 | 9 |
| Quadrant | Total seconds | Saturated seconds | Saturation percentage |
|---|---|---|---|
| A | 4871 | 22 | 0.451653% |
| B | 4362 | 67 | 1.535993% |
| C | 4937 | 20 | 0.405104% |
| D | 5257 | 39 | 0.741868% |
Noise dominated data is calculated using 1-second bins in cleaned event files. If a bin has >2000 counts, and if more than 50% of those come from <1% of pixels, then it is considered to be noise-dominated and hence unusable.
| Quadrant | # 1 sec bins | Bins with >0 counts | Bins with >2000 counts | High rate bins dominated by noise | Noise dominated (total time) | Noise dominated (detector-on time) | Marked lightcurve |
|---|---|---|---|---|---|---|---|
| A | 7282 | 5782 | 0 | 0 | 0.00% | 0.00% | 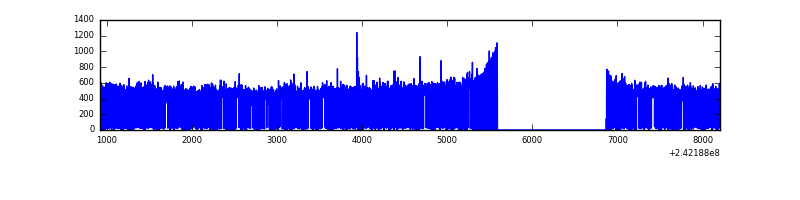 |
| B | 7282 | 5267 | 4 | 4 | 0.05% | 0.08% | 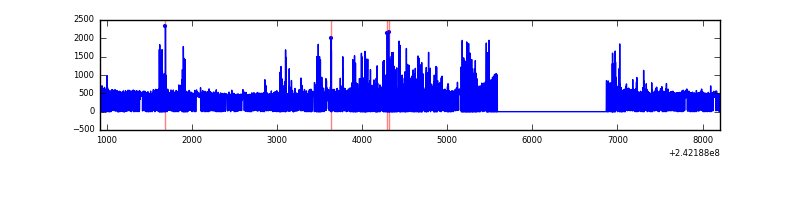 |
| C | 7281 | 5795 | 0 | 0 | 0.00% | 0.00% | 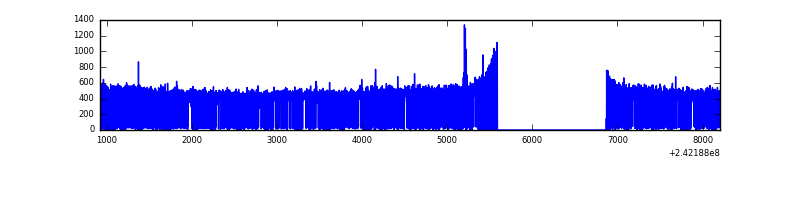 |
| D | 7283 | 5772 | 10 | 10 | 0.14% | 0.17% | 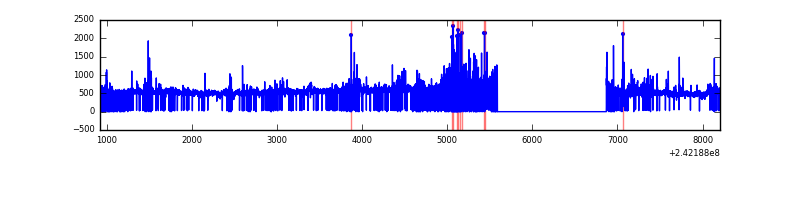 |
Top three noisy pixels from each quadrant. If the there are fewer than three noisy pixels in the level2.evt file, extra rows are filled as -1
| Pixel properties | Quadrant properties | ||||||
|---|---|---|---|---|---|---|---|
| Quadrant | DetID | PixID | Counts | Sigma | Mean | Median | Sigma |
| A | 13 | 251 | 70760 | 583.05 | 592 | 581 | 120.4 |
| A | 3 | 80 | 62106 | 511.15 | 592 | 581 | 120.4 |
| A | 1 | 162 | 15888 | 127.17 | 592 | 581 | 120.4 |
| B | 4 | 239 | 275282 | 2692.23 | 532 | 519 | 102.1 |
| B | 0 | 214 | 41212 | 398.73 | 532 | 519 | 102.1 |
| B | 12 | 111 | 10776 | 100.5 | 532 | 519 | 102.1 |
| C | 14 | 234 | 8740 | 58.64 | 599 | 604 | 138.8 |
| C | 13 | 61 | 4411 | 27.44 | 599 | 604 | 138.8 |
| C | 14 | 67 | 1586 | 7.08 | 599 | 604 | 138.8 |
| D | 8 | 195 | 452304 | 3056.77 | 625 | 611 | 147.8 |
| D | 1 | 20 | 191523 | 1291.97 | 625 | 611 | 147.8 |
| D | 1 | 52 | 110263 | 742.05 | 625 | 611 | 147.8 |
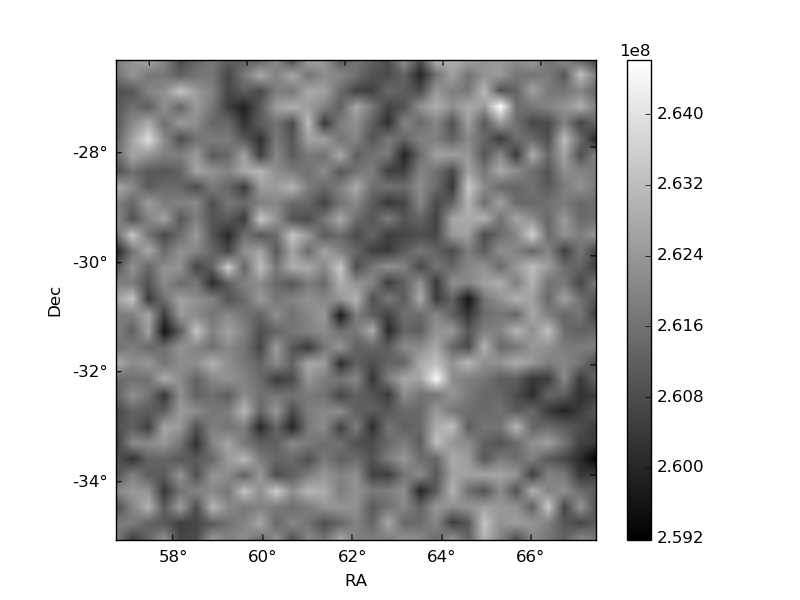
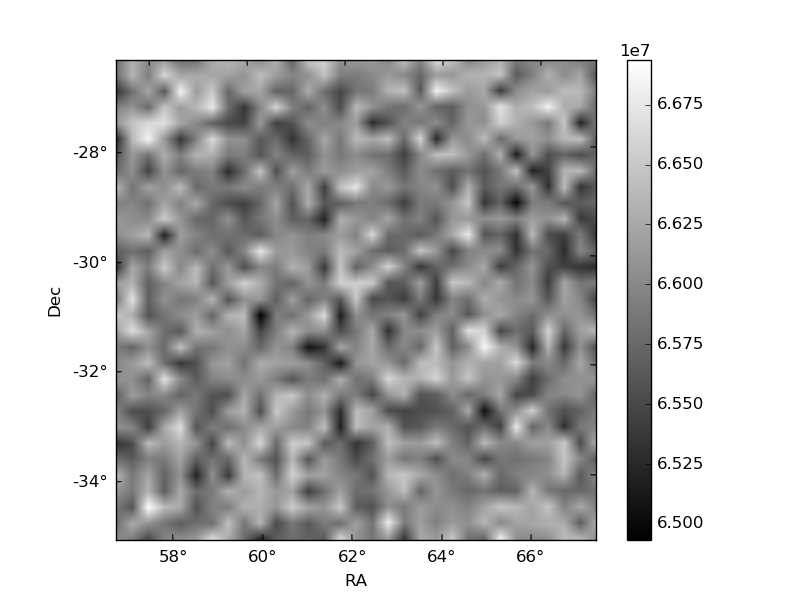
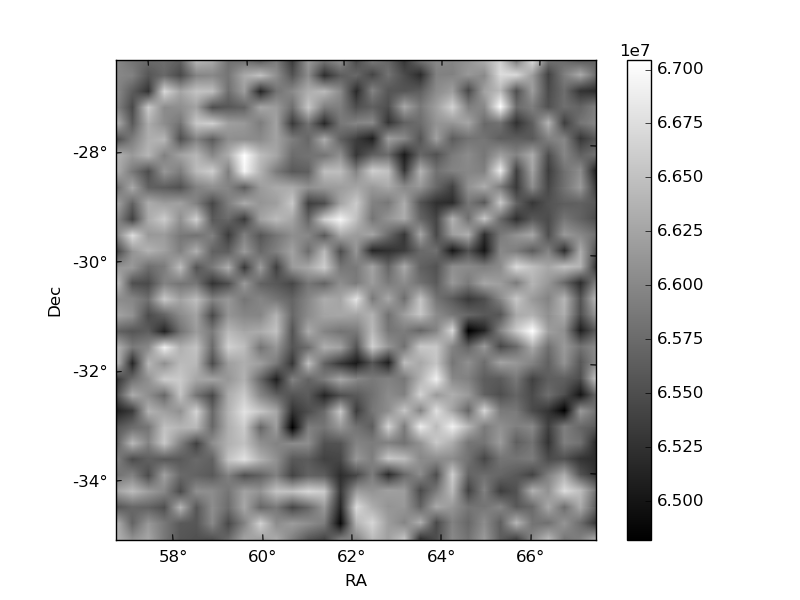
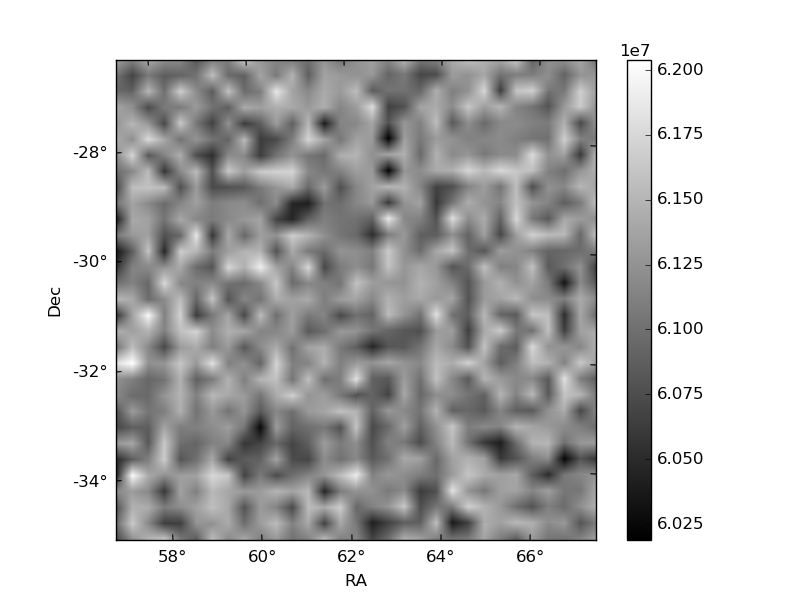
Histogram calculated using DETX and DETY for each event in the final _common_clean file
| Quadrant A | 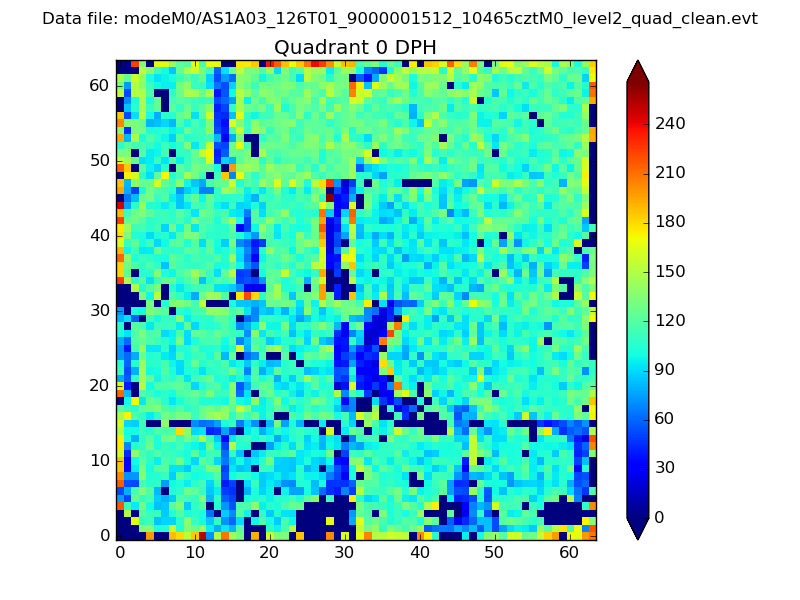 |
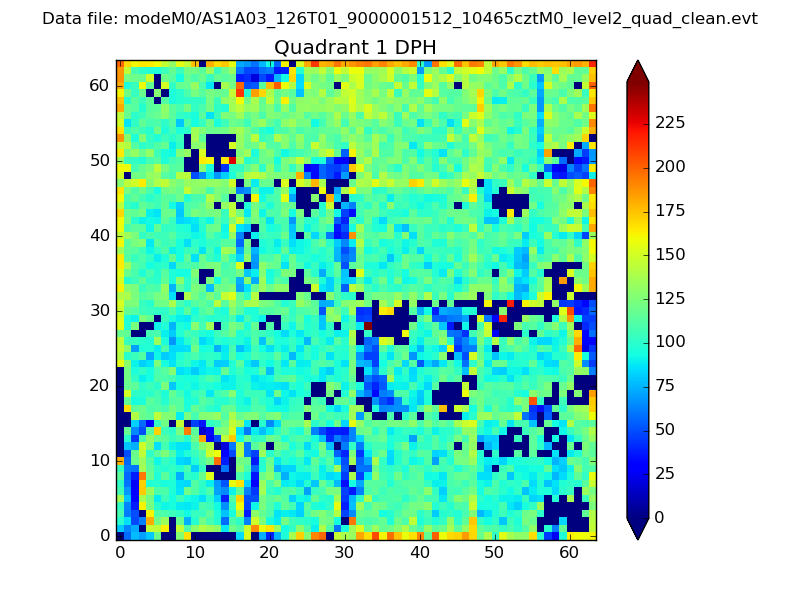 |
Quadrant B |
|---|---|---|---|
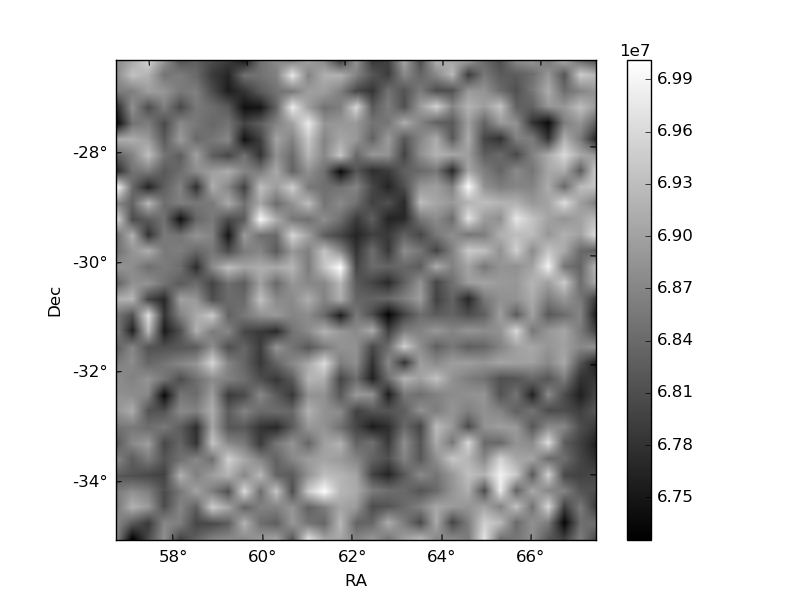
| Quadrant D | 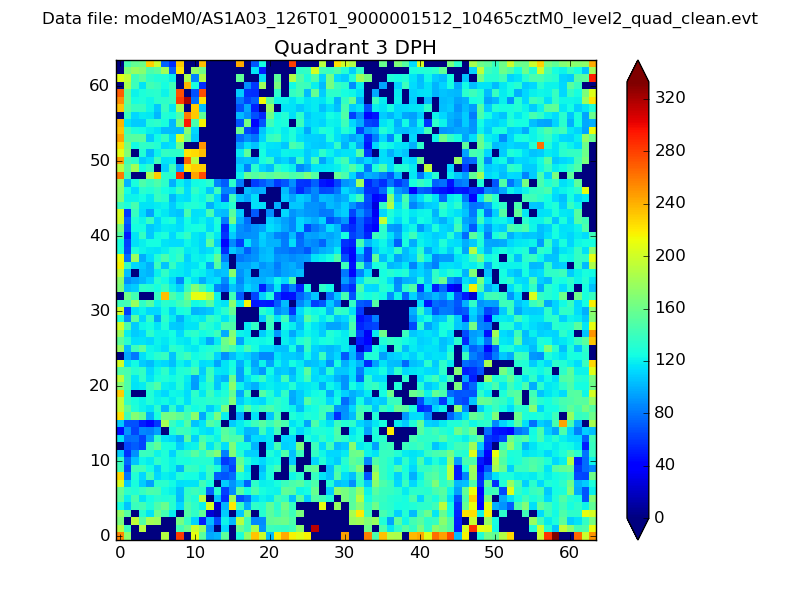 |
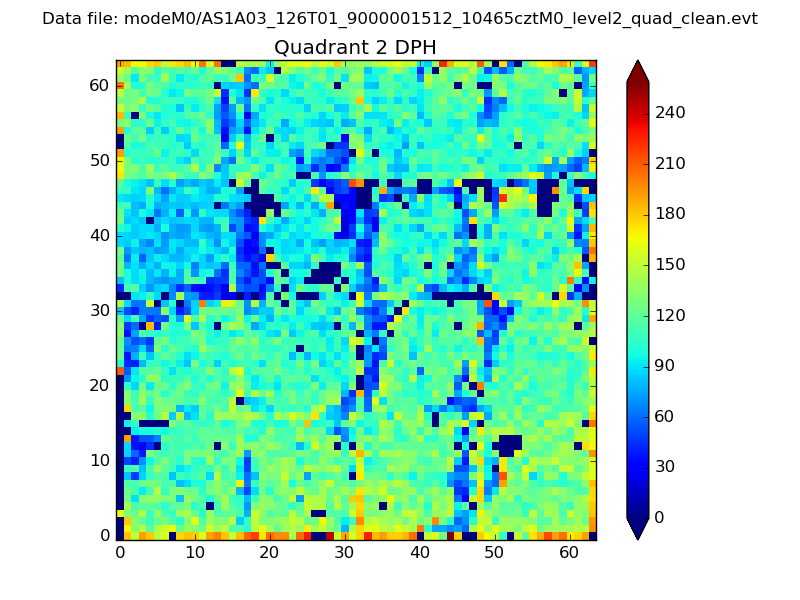 |
Quadrant C |
| Plot type | Count rate plots | Images |
|---|---|---|
| Comparison with Poisson distribution Blue bars denote a histogram of data divided into 1 sec bins. Red curve is a Poisson curve with rate = median count rate of data. |
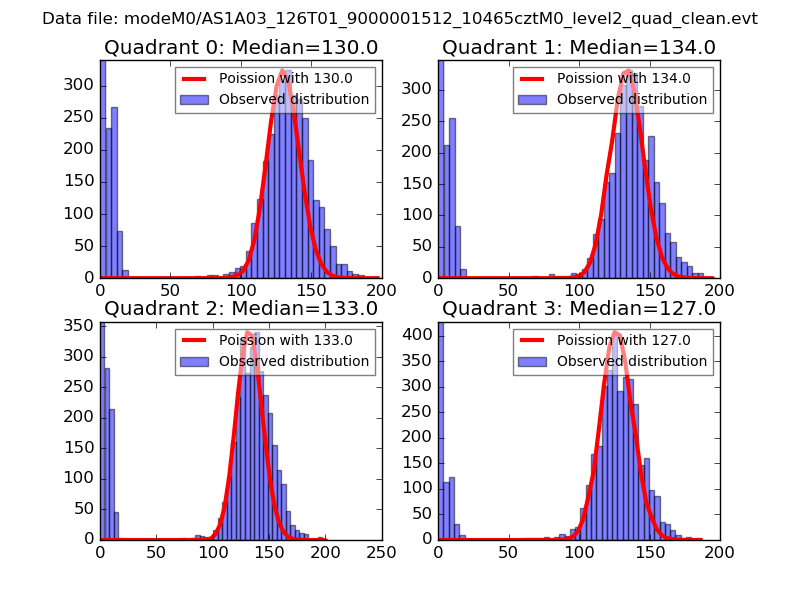 |
 |
| Quadrant-wise count rates Data is divided into 100 sec bins |
 |
|
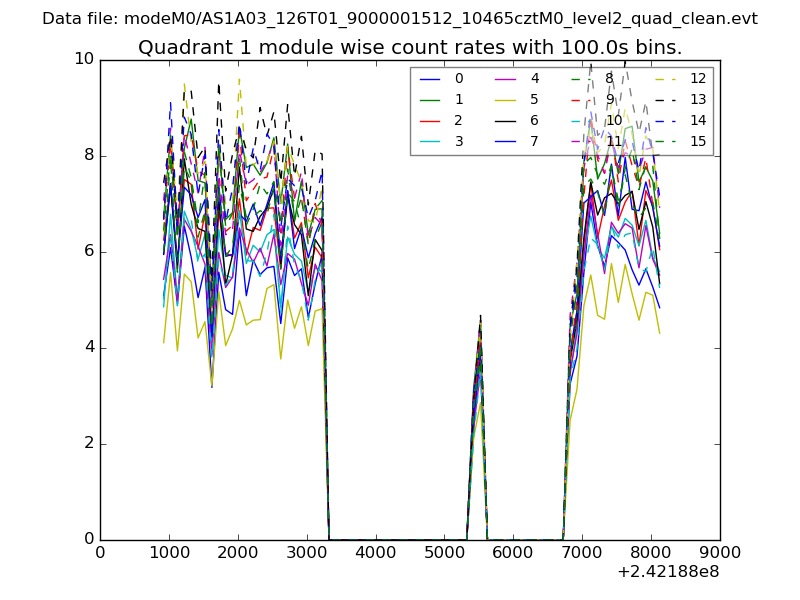
| Module-wise count rates for Quadrant A Data is divided into 100 sec bins |
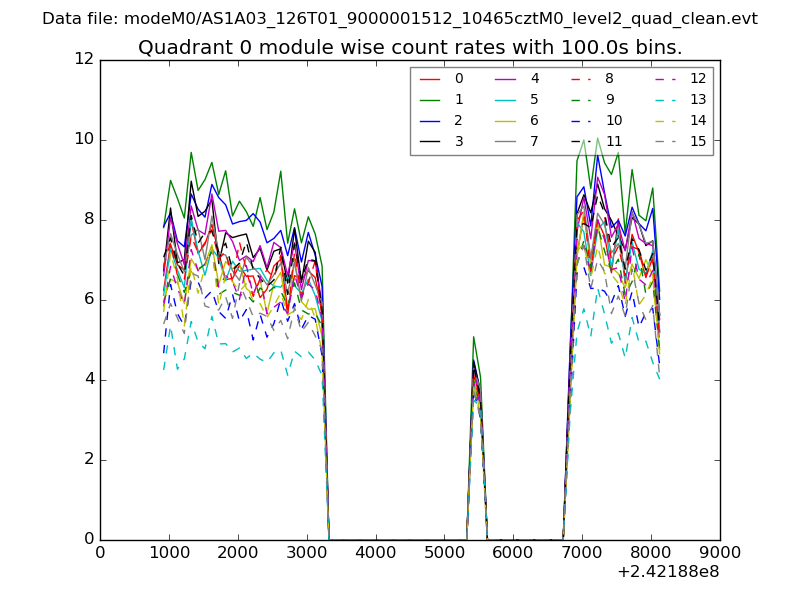 |
 |
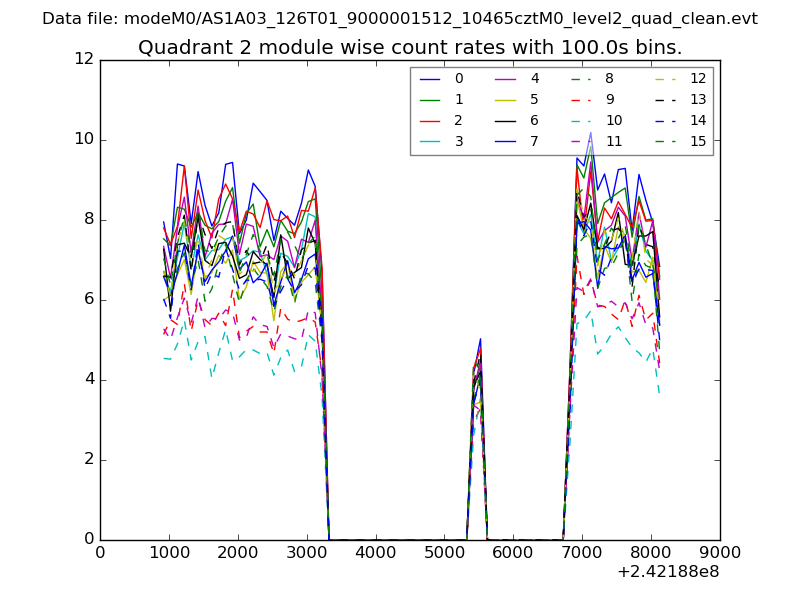
| Module-wise count rates for Quadrant B Data is divided into 100 sec bins |
 |
 |
| Module-wise count rates for Quadrant C Data is divided into 100 sec bins |
 |
 |
| Module-wise count rates for Quadrant D Data is divided into 100 sec bins |
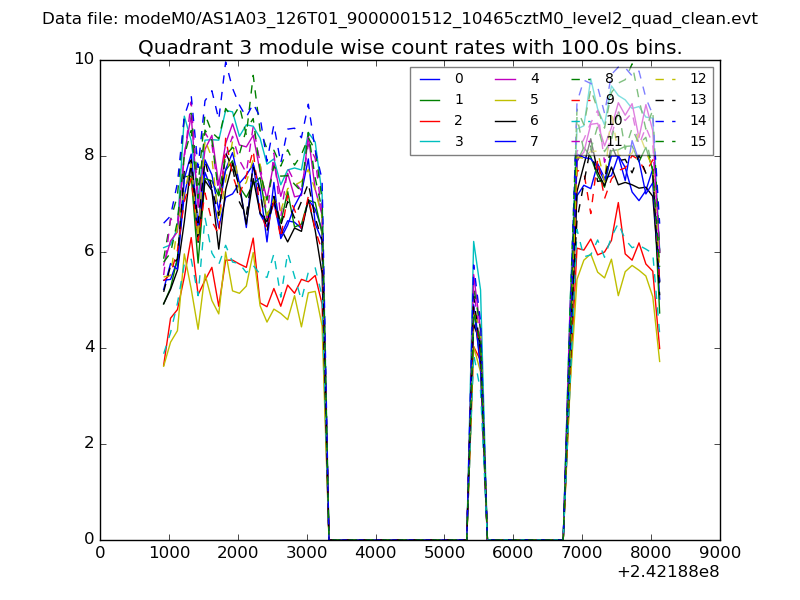 |
 |
| Parameter | Plot |
|---|---|
| CZT HV Monitor | 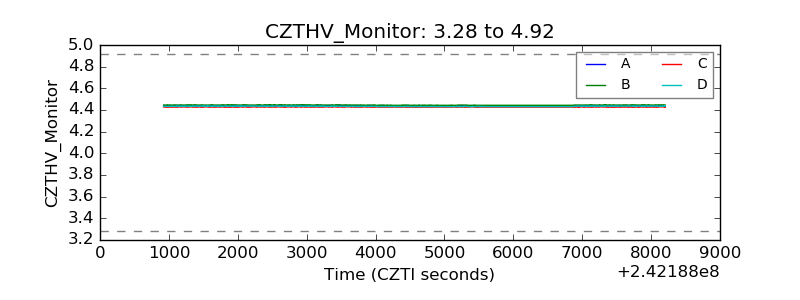 |
| D_VDD | 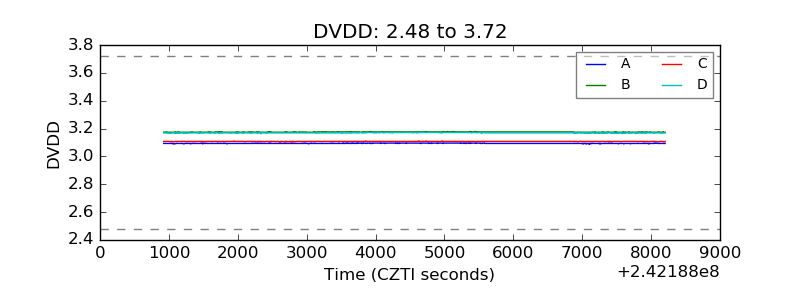 |
| Temperature 1 | 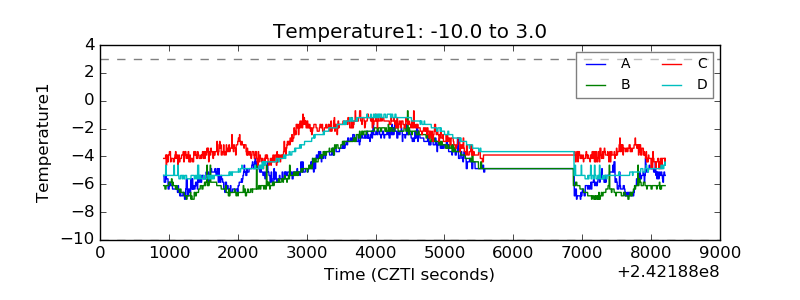 |
| Veto HV Monitor | 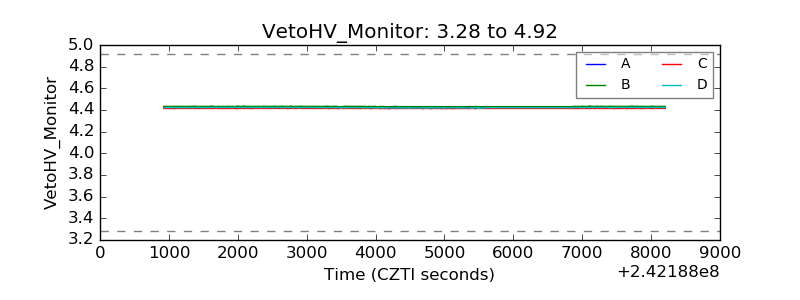 |
| Veto LLD | 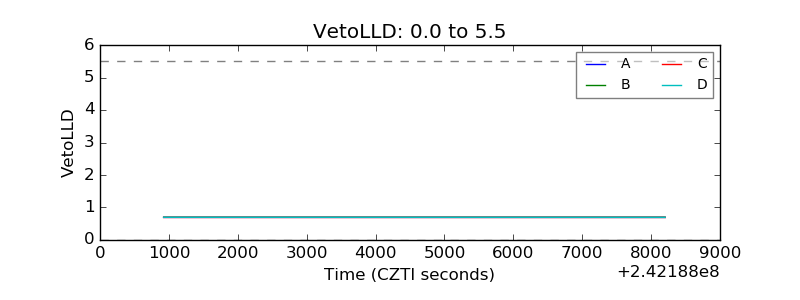 |
| Alpha Counter |  |
| _CPM_Rate |  |
| CZT Counter | 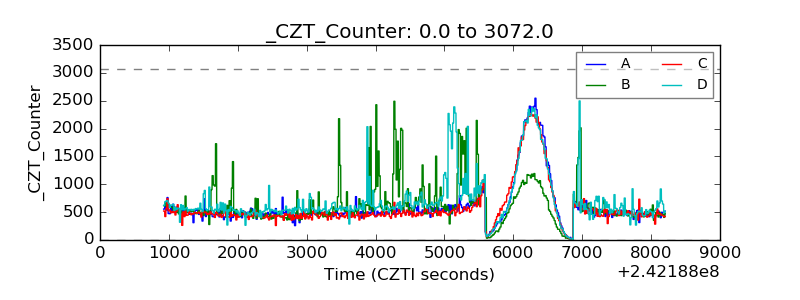 |
| +2.5 Volts monitor |  |
| +5 Volts monitor |  |
| _ROLL_ROT | 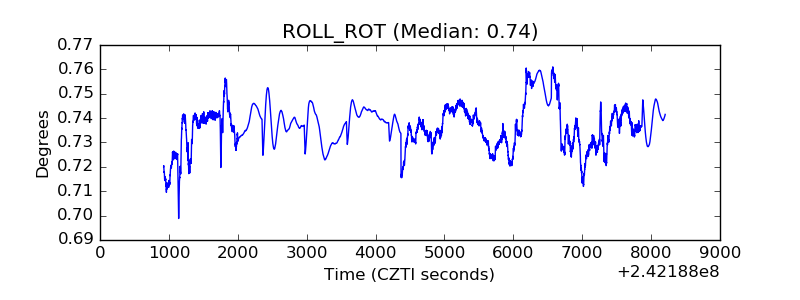 |
| _Roll_DEC | 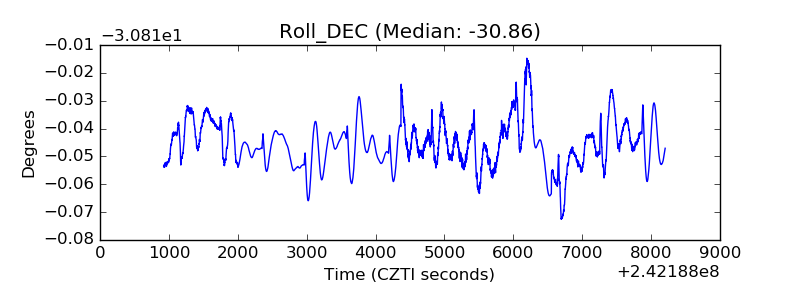 |
| _Roll_RA | 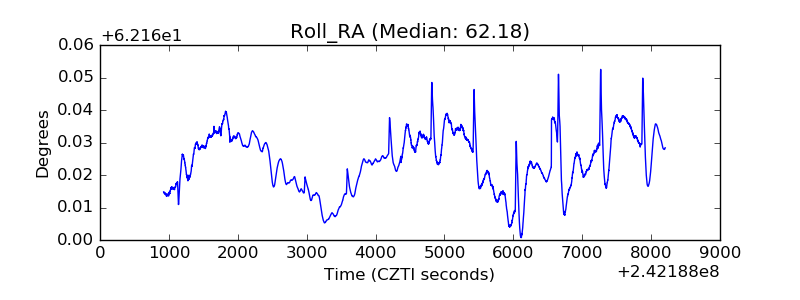 |
| Veto Counter | 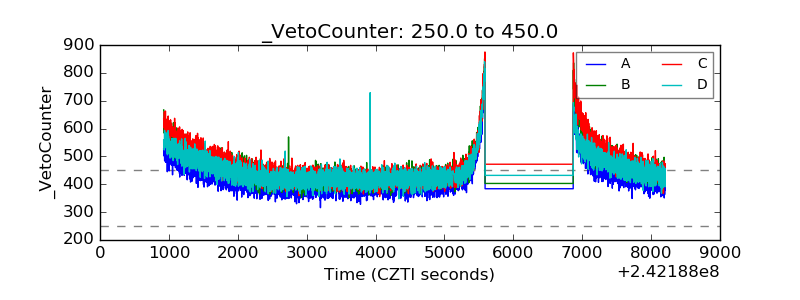 |