| Param | Original file | Final file |
|---|---|---|
| Filename | modeM0/AS1A03_126T01_9000001512_10466cztM0_level2.evt | modeM0/AS1A03_126T01_9000001512_10466cztM0_level2_quad_clean.evt |
| Size (bytes) | 387,388,800 | 73,514,880 |
| Size | 369.4 MB | 70.1 MB |
| Events in quadrant A | 2,847,130 | 437,224 |
| Events in quadrant B | 2,637,972 | 471,905 |
| Events in quadrant C | 2,508,079 | 473,685 |
| Events in quadrant D | 3,382,474 | 477,318 |
| Mode SS | |||
|---|---|---|---|
| Quadrant | BADHDUFLAG | Total packets | Discarded packets |
| A | 0 | 256 | 139 |
| B | 0 | 256 | 130 |
| C | 0 | 256 | 135 |
| D | 0 | 246 | 124 |
| Mode M0 | |||
|---|---|---|---|
| Quadrant | BADHDUFLAG | Total packets | Discarded packets |
| A | 0 | 29218 | 17701 |
| B | 0 | 28716 | 17685 |
| C | 0 | 26064 | 15201 |
| D | 0 | 32449 | 18750 |
| Mode M9 | |||
|---|---|---|---|
| Quadrant | BADHDUFLAG | Total packets | Discarded packets |
| A | 0 | 24 | 11 |
| B | 0 | 25 | 11 |
| C | 0 | 25 | 11 |
| D | 0 | 24 | 9 |
| Quadrant | Total seconds | Saturated seconds | Saturation percentage |
|---|---|---|---|
| A | 4939 | 56 | 1.133833% |
| B | 5045 | 100 | 1.982161% |
| C | 5277 | 33 | 0.625355% |
| D | 5498 | 65 | 1.182248% |
Noise dominated data is calculated using 1-second bins in cleaned event files. If a bin has >2000 counts, and if more than 50% of those come from <1% of pixels, then it is considered to be noise-dominated and hence unusable.
| Quadrant | # 1 sec bins | Bins with >0 counts | Bins with >2000 counts | High rate bins dominated by noise | Noise dominated (total time) | Noise dominated (detector-on time) | Marked lightcurve |
|---|---|---|---|---|---|---|---|
| A | 7525 | 5929 | 1 | 1 | 0.01% | 0.02% | 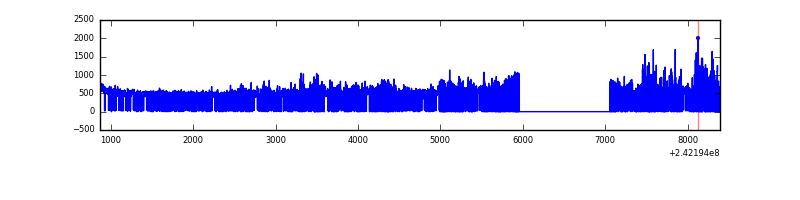 |
| B | 7523 | 5922 | 17 | 17 | 0.23% | 0.29% | 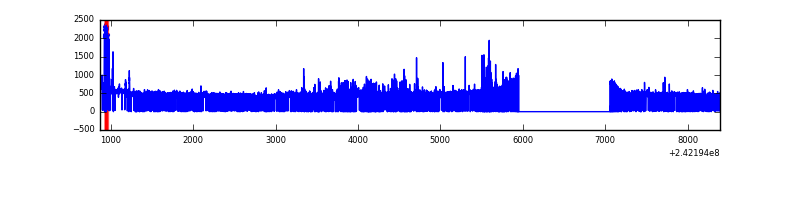 |
| C | 7525 | 6134 | 0 | 0 | 0.00% | 0.00% | 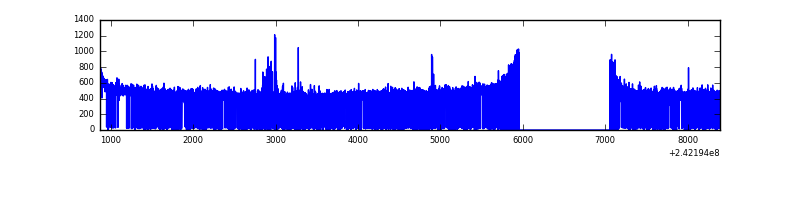 |
| D | 7525 | 6067 | 9 | 9 | 0.12% | 0.15% | 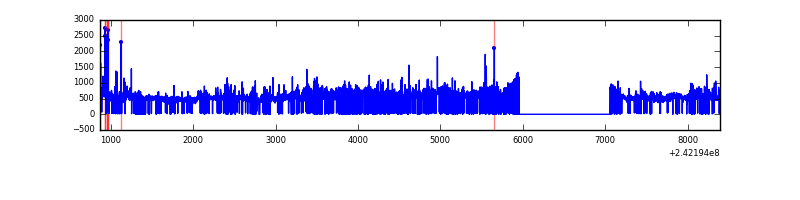 |
Top three noisy pixels from each quadrant. If the there are fewer than three noisy pixels in the level2.evt file, extra rows are filled as -1
| Pixel properties | Quadrant properties | ||||||
|---|---|---|---|---|---|---|---|
| Quadrant | DetID | PixID | Counts | Sigma | Mean | Median | Sigma |
| A | 13 | 251 | 428973 | 3515.44 | 601 | 588 | 121.9 |
| A | 3 | 80 | 61953 | 503.58 | 601 | 588 | 121.9 |
| A | 1 | 162 | 20012 | 159.4 | 601 | 588 | 121.9 |
| B | 4 | 239 | 171479 | 1443.61 | 615 | 599 | 118.4 |
| B | 0 | 214 | 56603 | 473.13 | 615 | 599 | 118.4 |
| B | 12 | 111 | 12730 | 102.48 | 615 | 599 | 118.4 |
| C | 14 | 234 | 23264 | 152.85 | 636 | 640 | 148.0 |
| C | 13 | 61 | 4768 | 27.89 | 636 | 640 | 148.0 |
| C | 3 | 202 | 1612 | 6.57 | 636 | 640 | 148.0 |
| D | 8 | 195 | 376119 | 2367.19 | 657 | 639 | 158.6 |
| D | 1 | 20 | 370713 | 2333.11 | 657 | 639 | 158.6 |
| D | 1 | 52 | 130803 | 820.61 | 657 | 639 | 158.6 |
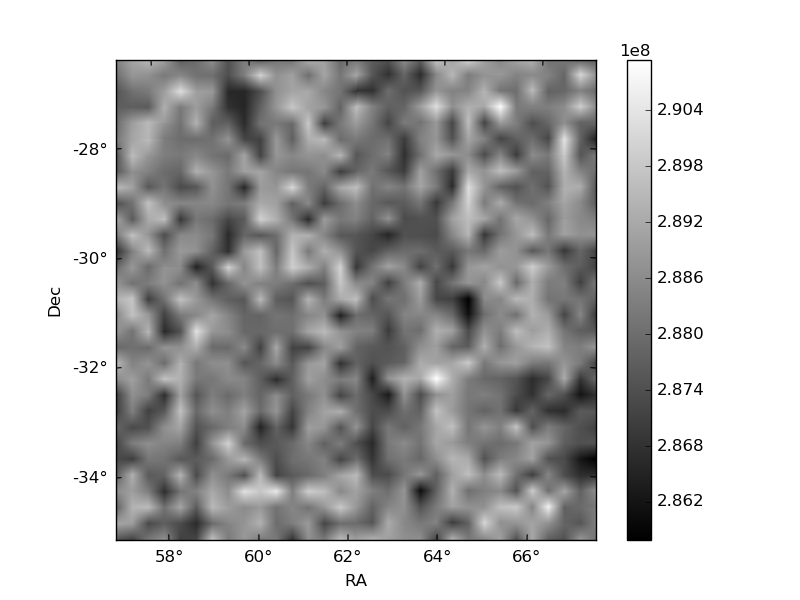
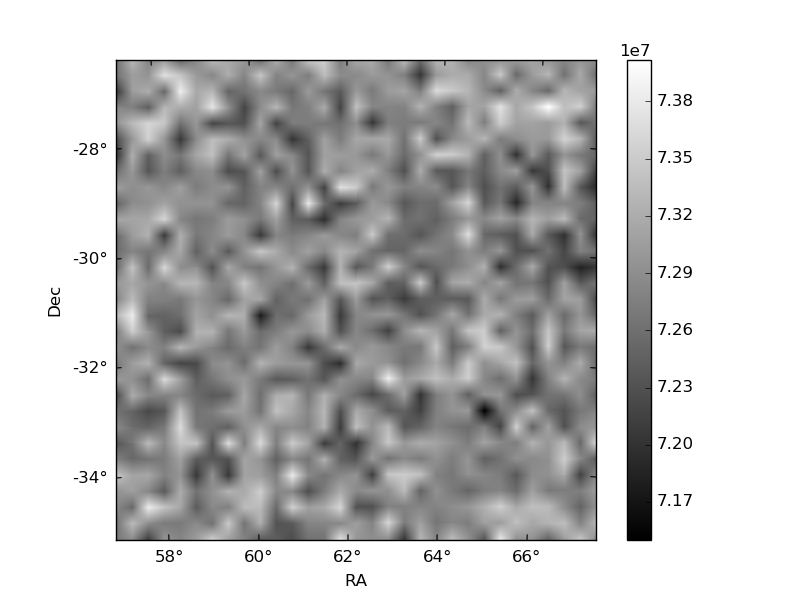
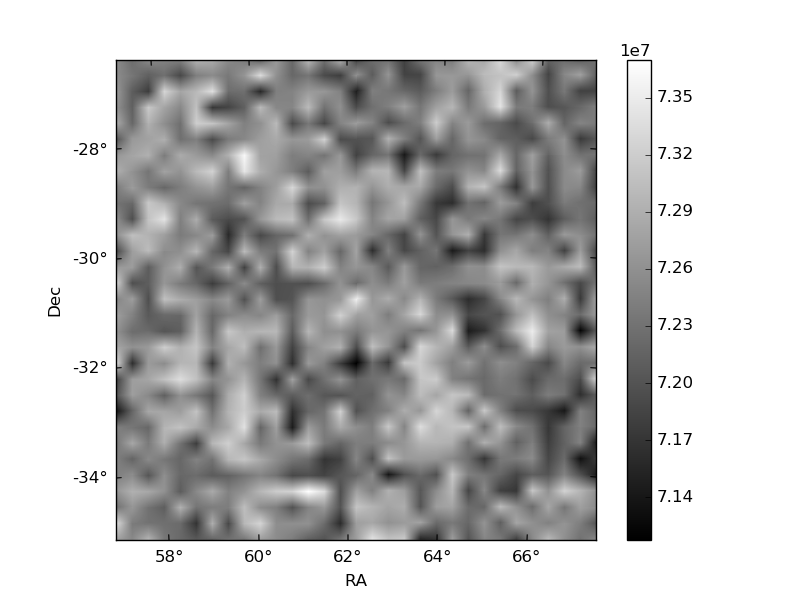
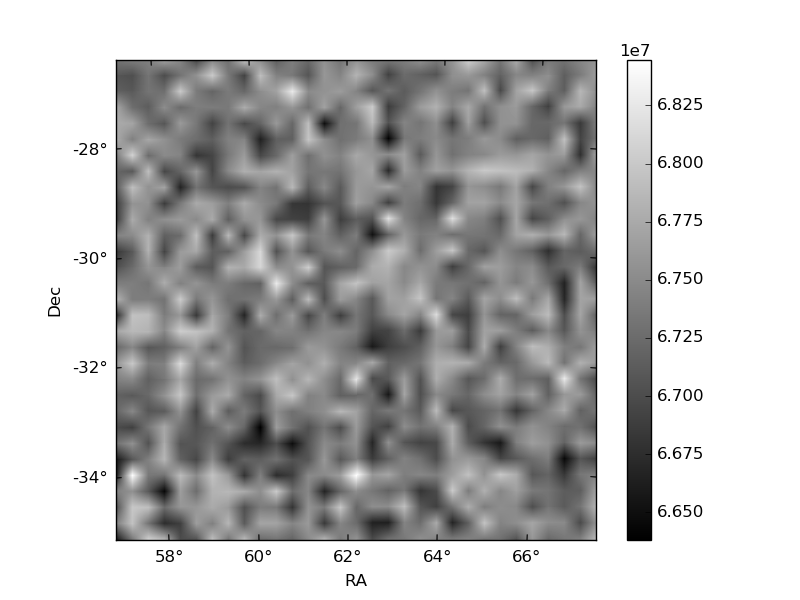
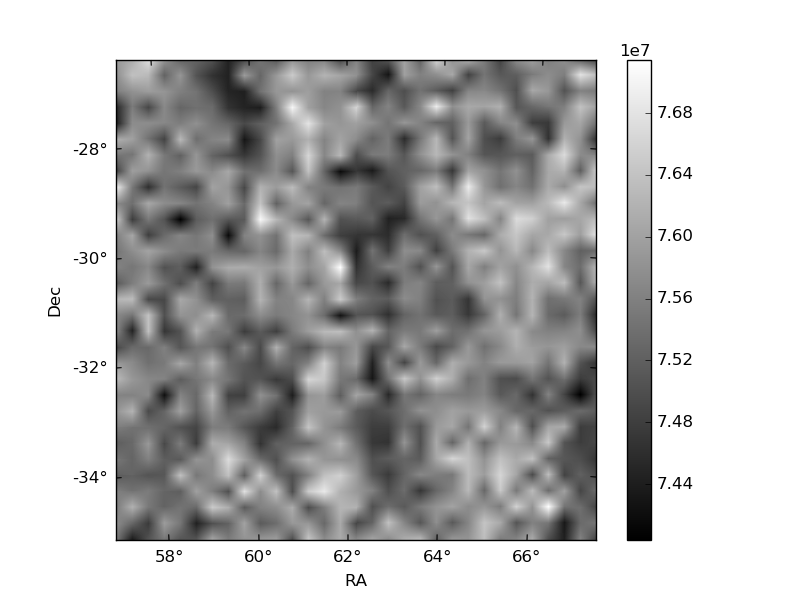
Histogram calculated using DETX and DETY for each event in the final _common_clean file
| Quadrant A | 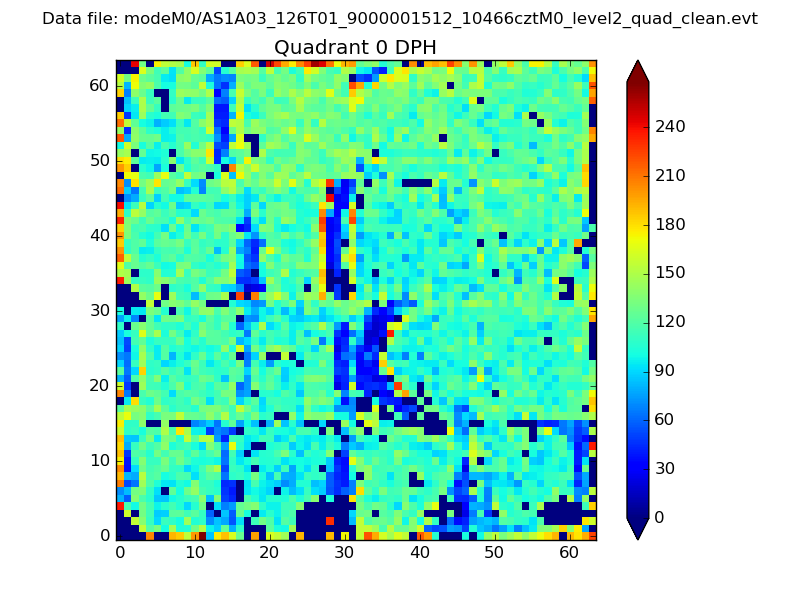 |
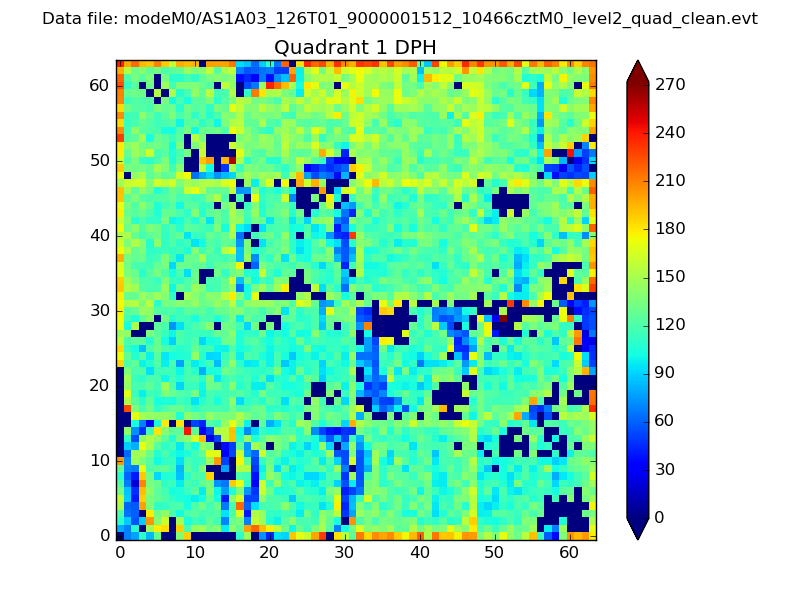 |
Quadrant B |
|---|---|---|---|
| Quadrant D | 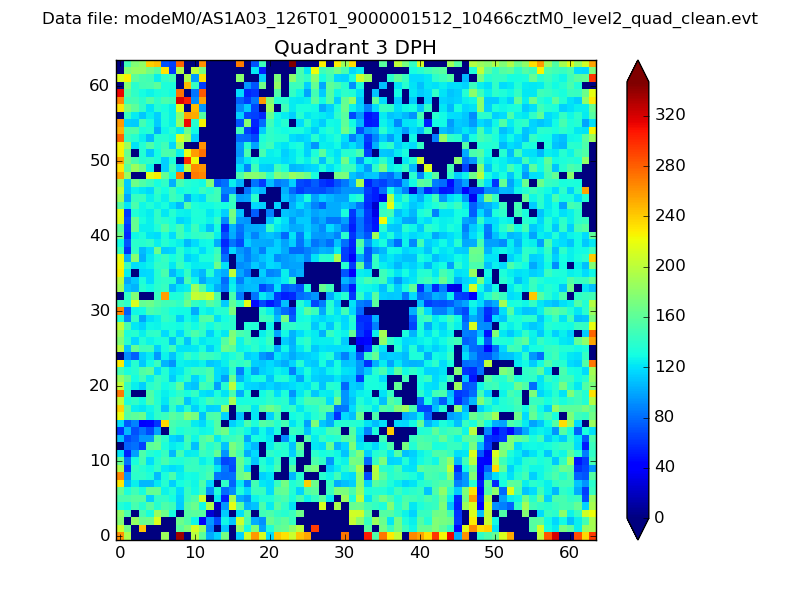 |
 |
Quadrant C |
| Plot type | Count rate plots | Images |
|---|---|---|
| Comparison with Poisson distribution Blue bars denote a histogram of data divided into 1 sec bins. Red curve is a Poisson curve with rate = median count rate of data. |
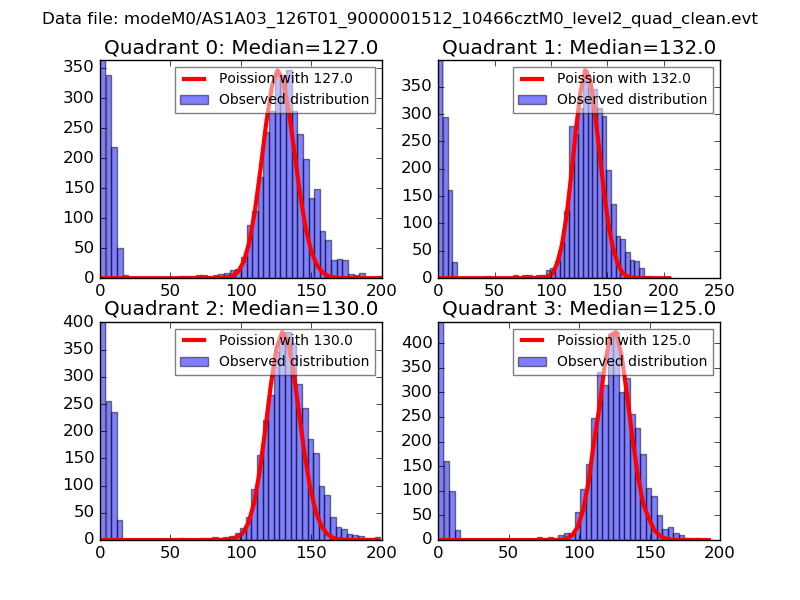 |
 |
| Quadrant-wise count rates Data is divided into 100 sec bins |
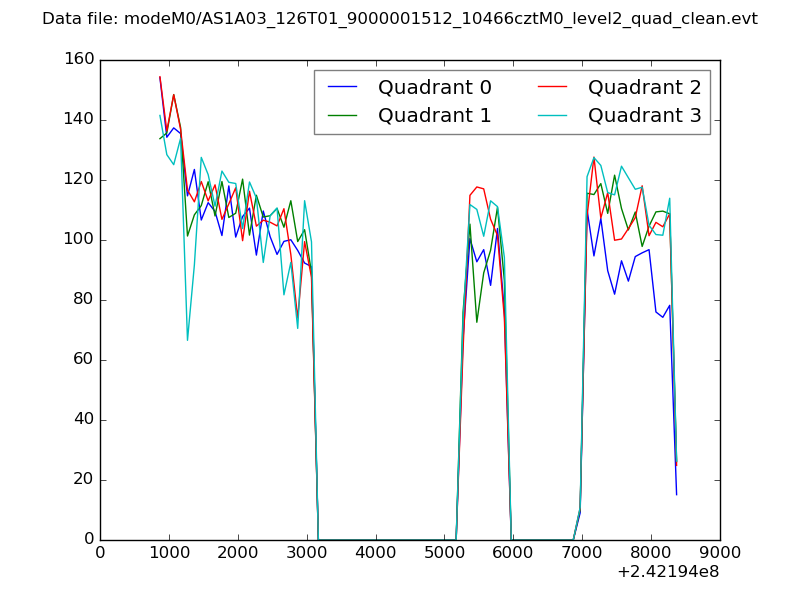 |
|
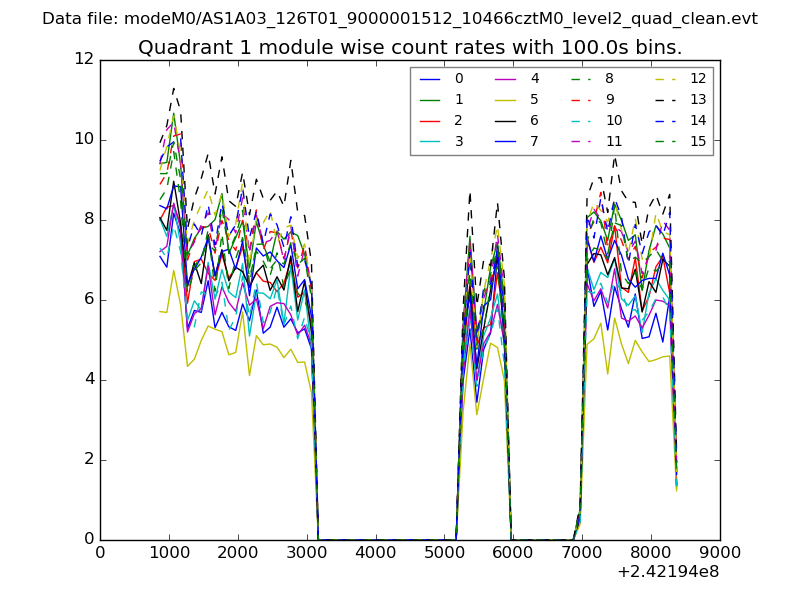
| Module-wise count rates for Quadrant A Data is divided into 100 sec bins |
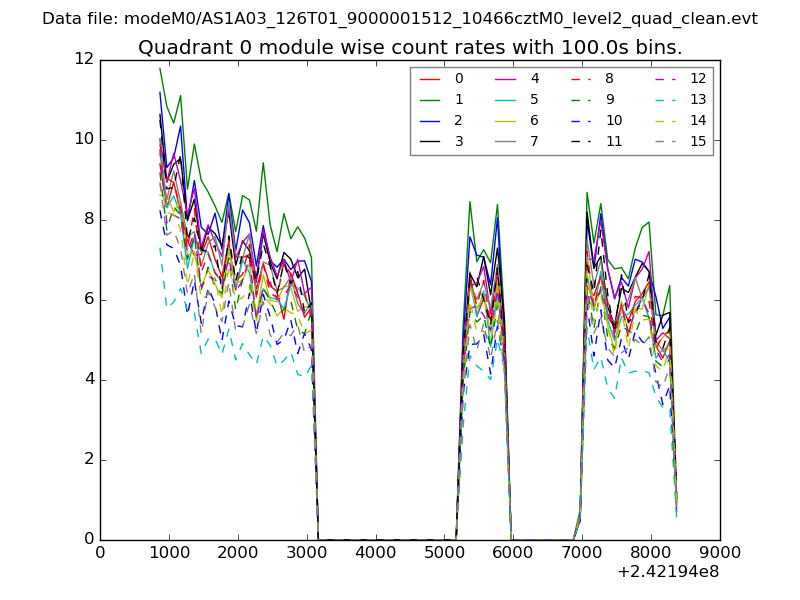 |
 |
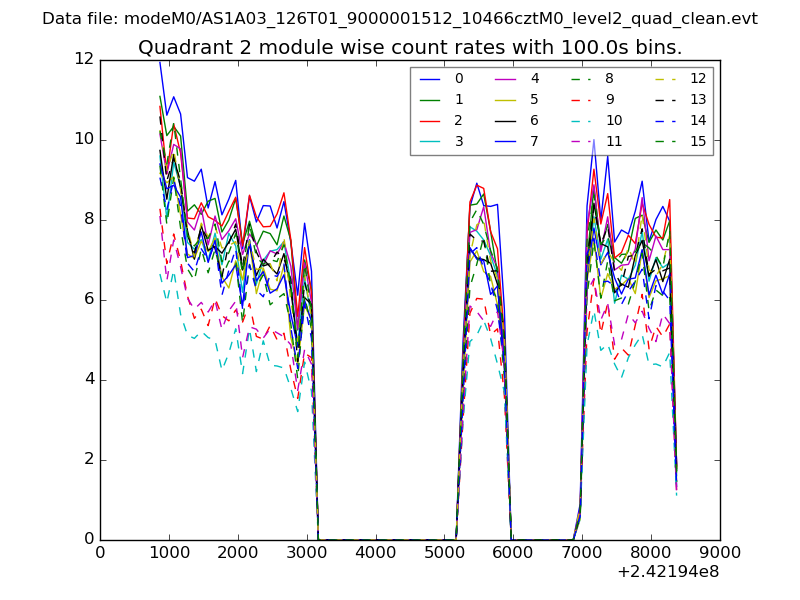
| Module-wise count rates for Quadrant B Data is divided into 100 sec bins |
 |
 |
| Module-wise count rates for Quadrant C Data is divided into 100 sec bins |
 |
 |
| Module-wise count rates for Quadrant D Data is divided into 100 sec bins |
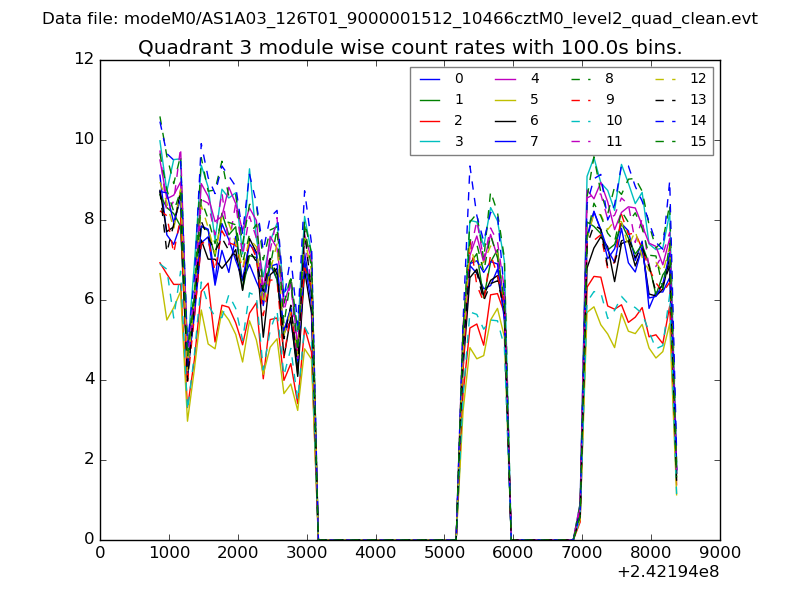 |
 |
| Parameter | Plot |
|---|---|
| CZT HV Monitor | 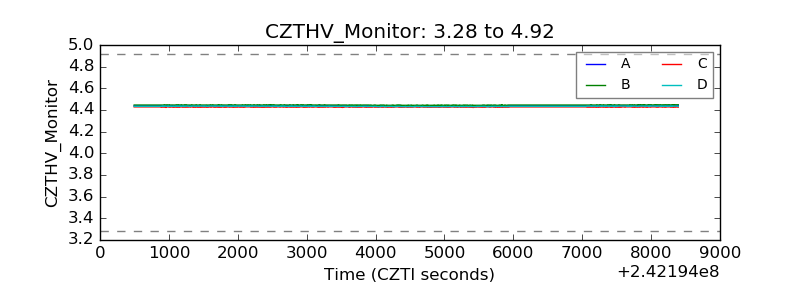 |
| D_VDD | 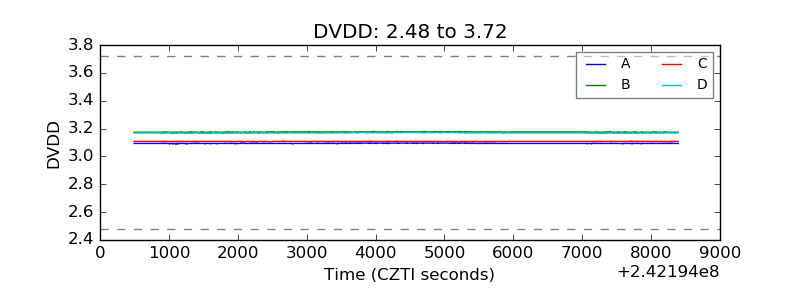 |
| Temperature 1 | 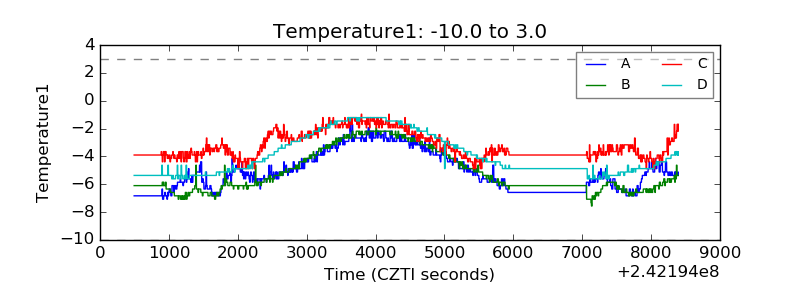 |
| Veto HV Monitor | 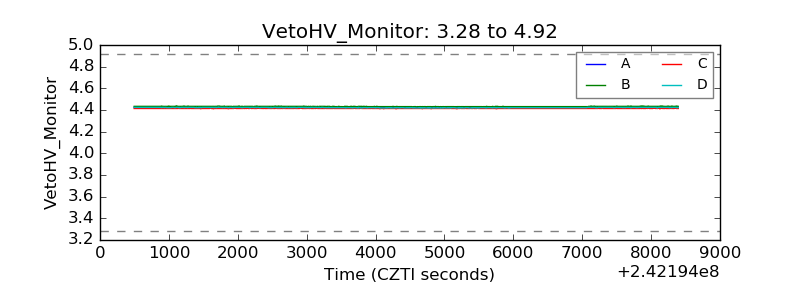 |
| Veto LLD | 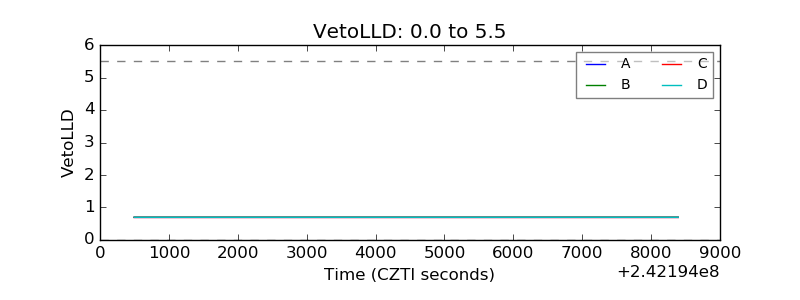 |
| Alpha Counter | 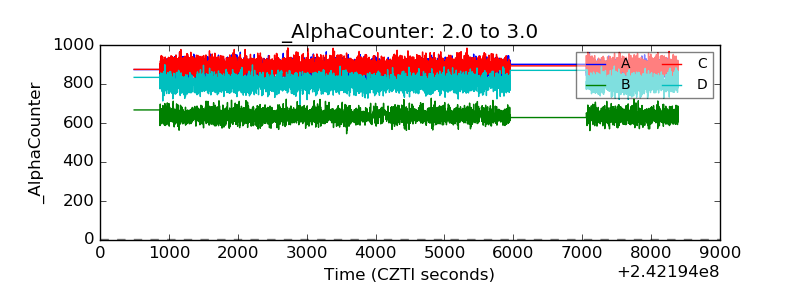 |
| _CPM_Rate | 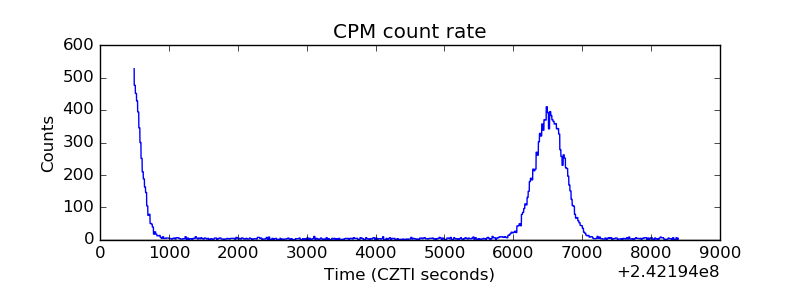 |
| CZT Counter |  |
| +2.5 Volts monitor |  |
| +5 Volts monitor | 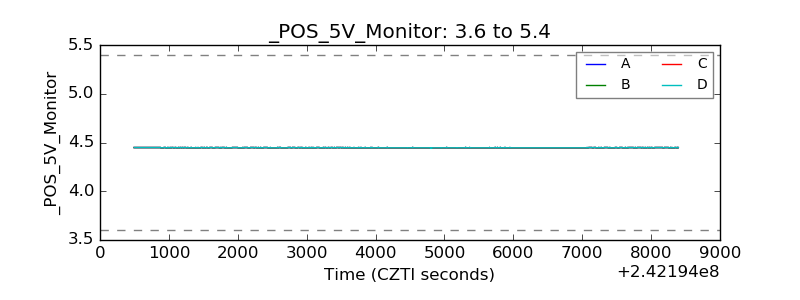 |
| _ROLL_ROT | 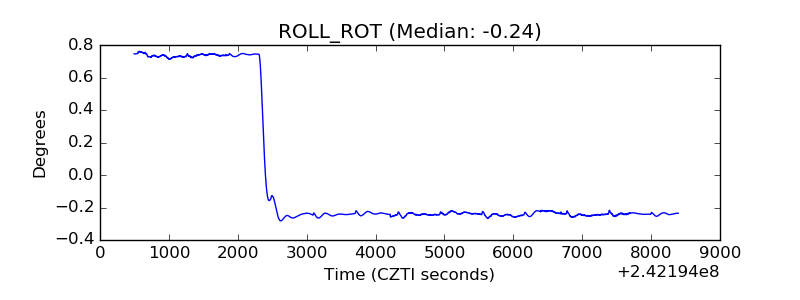 |
| _Roll_DEC | 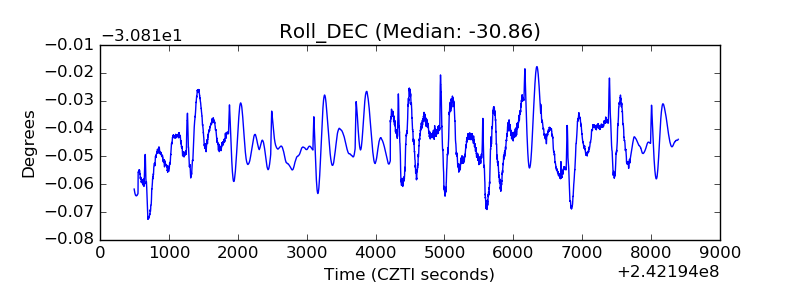 |
| _Roll_RA | 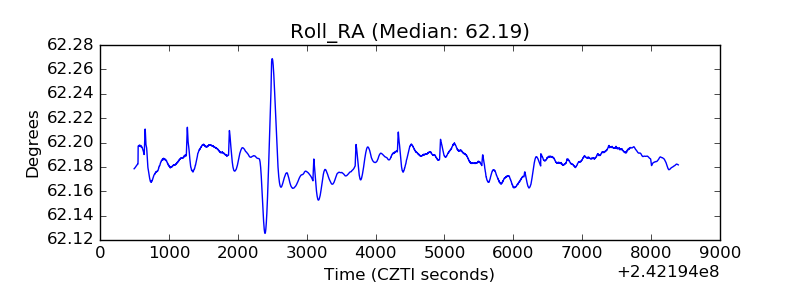 |
| Veto Counter | 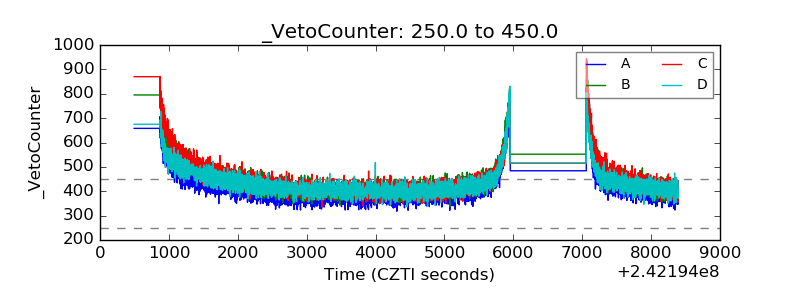 |