| Param | Original file | Final file |
|---|---|---|
| Filename | modeM0/AS1A03_126T01_9000001512_10467cztM0_level2.evt | modeM0/AS1A03_126T01_9000001512_10467cztM0_level2_quad_clean.evt |
| Size (bytes) | 527,555,520 | 96,880,320 |
| Size | 503.1 MB | 92.4 MB |
| Events in quadrant A | 4,172,166 | 613,940 |
| Events in quadrant B | 3,752,231 | 627,975 |
| Events in quadrant C | 3,238,735 | 620,002 |
| Events in quadrant D | 4,342,860 | 588,155 |
| Mode SS | |||
|---|---|---|---|
| Quadrant | BADHDUFLAG | Total packets | Discarded packets |
| A | 0 | 140 | 0 |
| B | 0 | 140 | 0 |
| C | 0 | 140 | 0 |
| D | 0 | 140 | 0 |
| Mode M0 | |||
|---|---|---|---|
| Quadrant | BADHDUFLAG | Total packets | Discarded packets |
| A | 0 | 16688 | 3 |
| B | 0 | 15643 | 2 |
| C | 0 | 14334 | 2 |
| D | 0 | 17276 | 2 |
| Mode M9 | |||
|---|---|---|---|
| Quadrant | BADHDUFLAG | Total packets | Discarded packets |
| A | 0 | 13 | 0 |
| B | 0 | 13 | 0 |
| C | 0 | 13 | 0 |
| D | 0 | 14 | 0 |
| Quadrant | Total seconds | Saturated seconds | Saturation percentage |
|---|---|---|---|
| A | 6945 | 194 | 2.793377% |
| B | 6945 | 267 | 3.844492% |
| C | 6945 | 135 | 1.943844% |
| D | 6945 | 240 | 3.455724% |
Noise dominated data is calculated using 1-second bins in cleaned event files. If a bin has >2000 counts, and if more than 50% of those come from <1% of pixels, then it is considered to be noise-dominated and hence unusable.
| Quadrant | # 1 sec bins | Bins with >0 counts | Bins with >2000 counts | High rate bins dominated by noise | Noise dominated (total time) | Noise dominated (detector-on time) | Marked lightcurve |
|---|---|---|---|---|---|---|---|
| A | 7720 | 6945 | 17 | 17 | 0.22% | 0.24% | 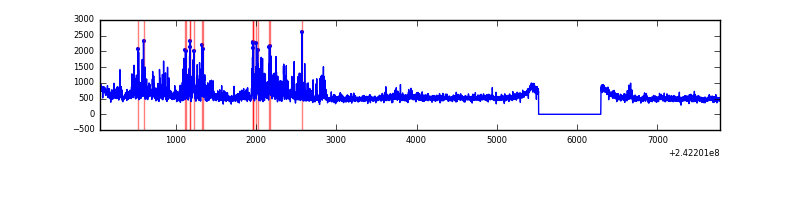 |
| B | 7720 | 6945 | 85 | 85 | 1.10% | 1.22% | 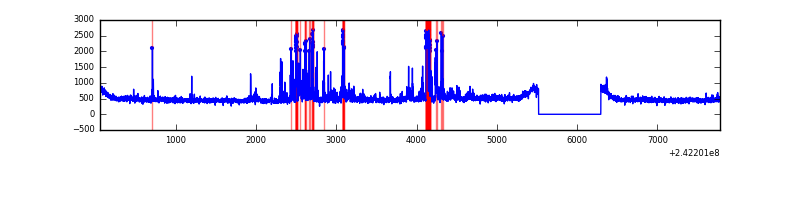 |
| C | 7720 | 6945 | 3 | 3 | 0.04% | 0.04% | 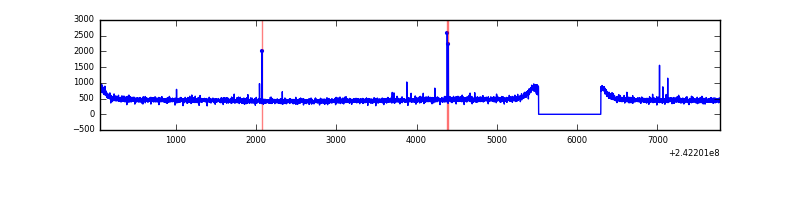 |
| D | 7720 | 6945 | 101 | 101 | 1.31% | 1.45% | 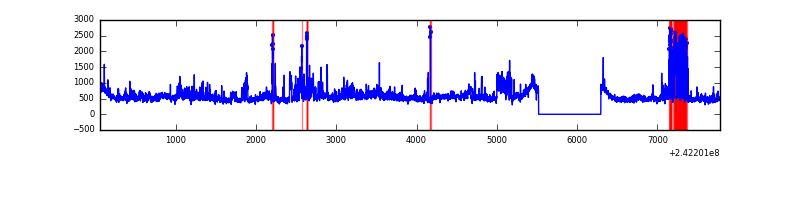 |
Top three noisy pixels from each quadrant. If the there are fewer than three noisy pixels in the level2.evt file, extra rows are filled as -1
| Pixel properties | Quadrant properties | ||||||
|---|---|---|---|---|---|---|---|
| Quadrant | DetID | PixID | Counts | Sigma | Mean | Median | Sigma |
| A | 13 | 251 | 756673 | 4462.95 | 833 | 813 | 169.4 |
| A | 3 | 80 | 114887 | 673.55 | 833 | 813 | 169.4 |
| A | 1 | 162 | 40980 | 237.16 | 833 | 813 | 169.4 |
| B | 4 | 239 | 384394 | 2419.11 | 830 | 807 | 158.6 |
| B | 11 | 51 | 69910 | 435.8 | 830 | 807 | 158.6 |
| B | 0 | 214 | 38167 | 235.61 | 830 | 807 | 158.6 |
| C | 14 | 234 | 16095 | 79.56 | 825 | 831 | 191.9 |
| C | 13 | 61 | 6162 | 27.79 | 825 | 831 | 191.9 |
| C | 11 | 7 | 4374 | 18.47 | 825 | 831 | 191.9 |
| D | 1 | 20 | 517206 | 2424.41 | 811 | 794 | 213.0 |
| D | 13 | 104 | 346814 | 1624.47 | 811 | 794 | 213.0 |
| D | 8 | 195 | 334873 | 1568.41 | 811 | 794 | 213.0 |
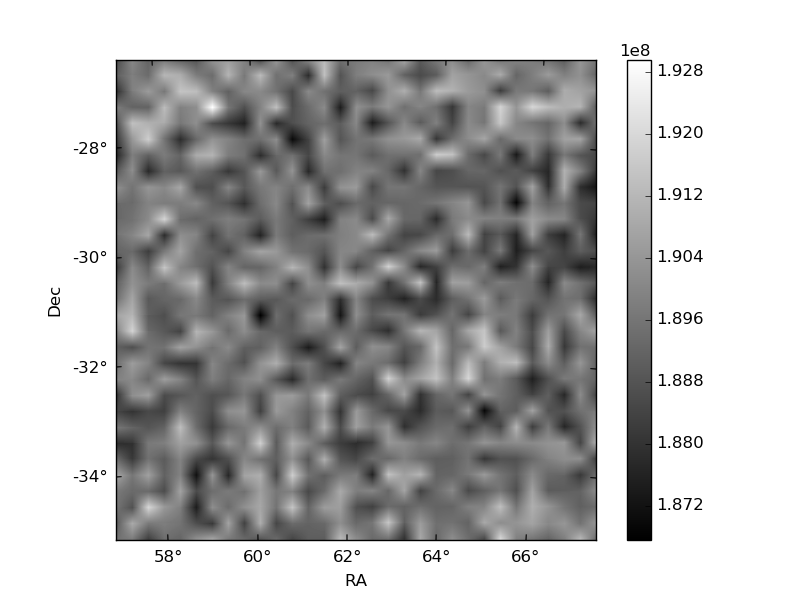
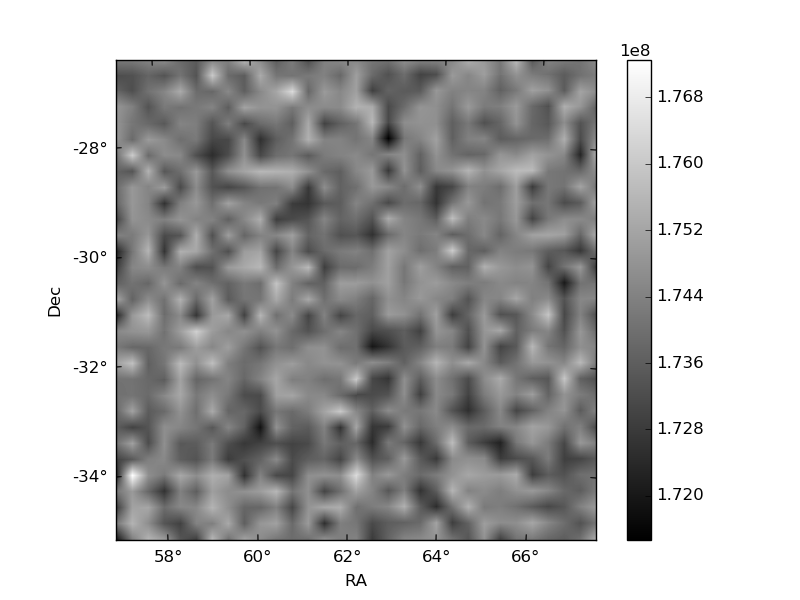
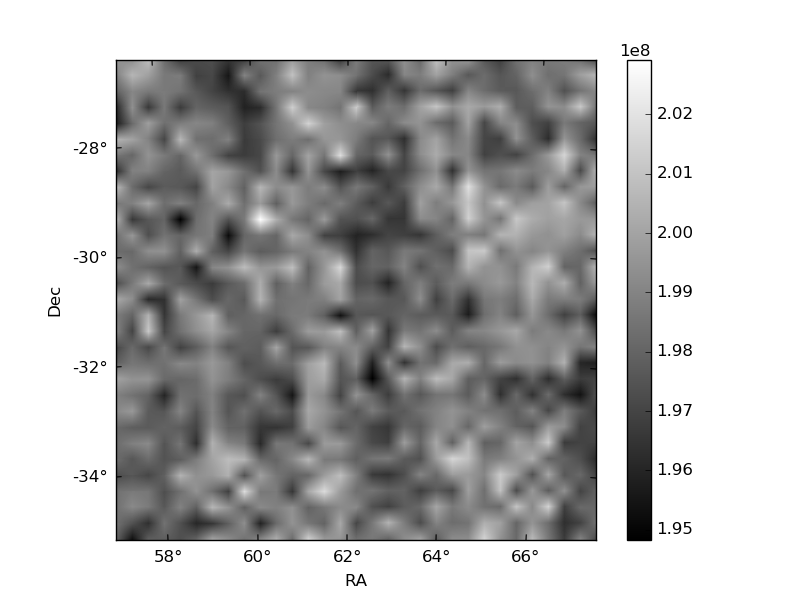
Histogram calculated using DETX and DETY for each event in the final _common_clean file
| Quadrant A | 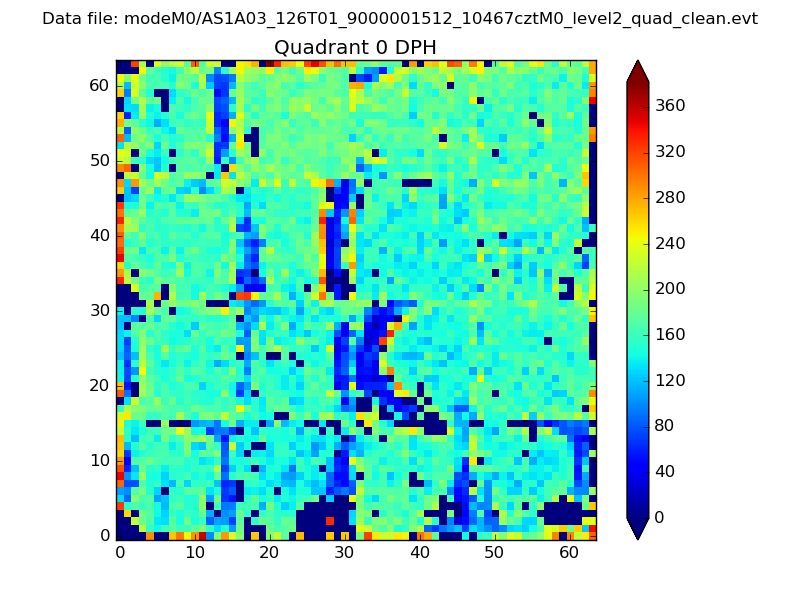 |
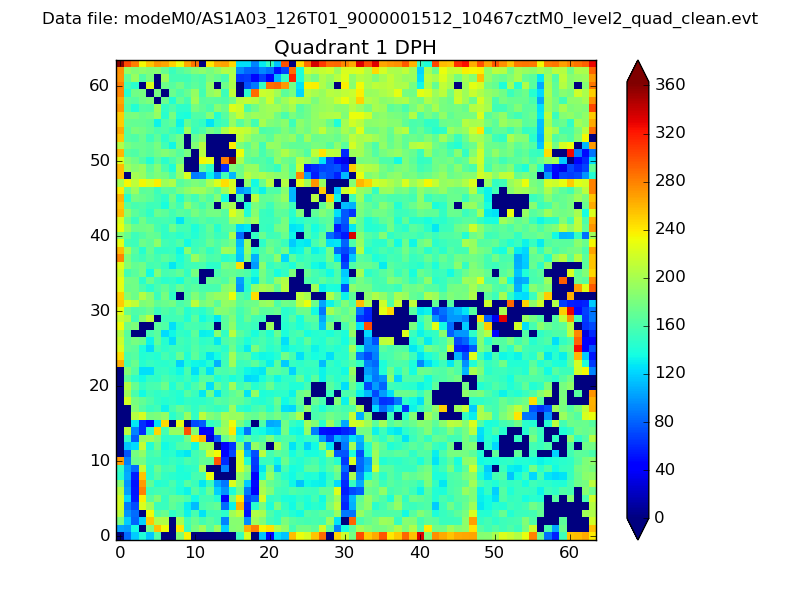 |
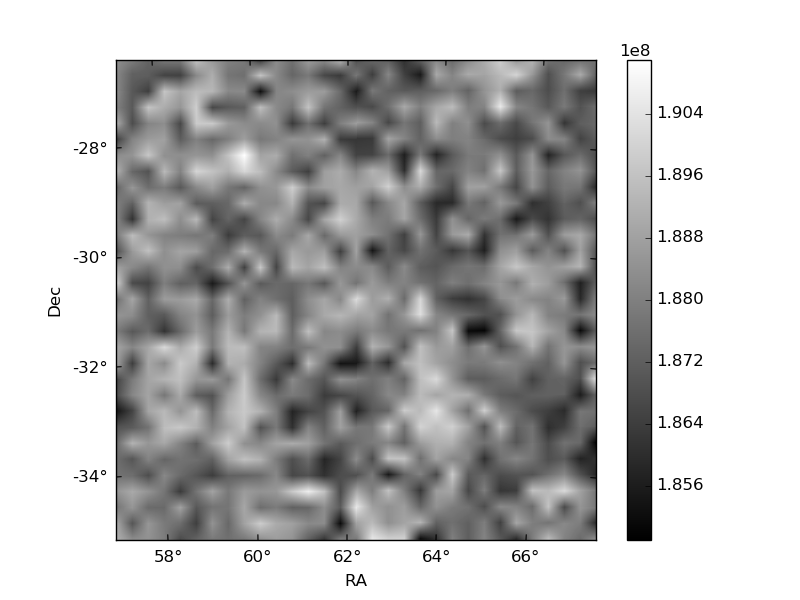
Quadrant B |
|---|---|---|---|
| Quadrant D | 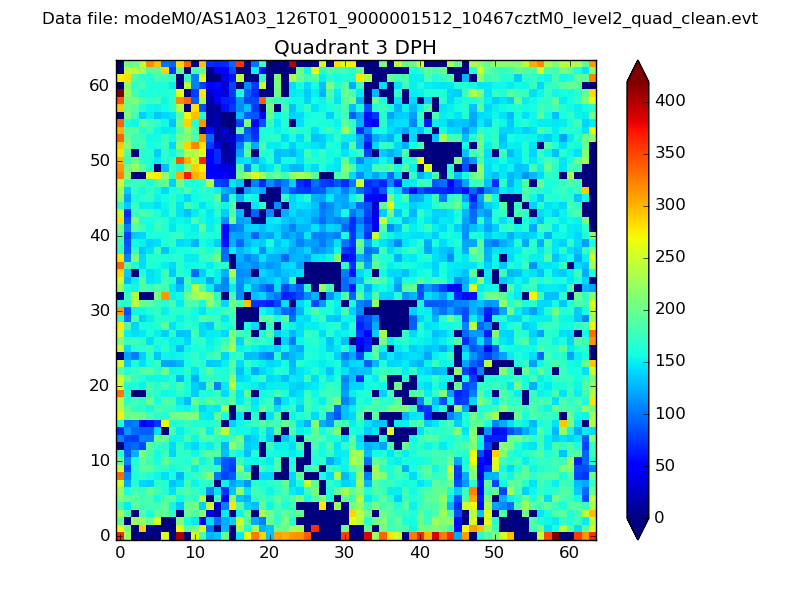 |
 |
Quadrant C |
| Plot type | Count rate plots | Images |
|---|---|---|
| Comparison with Poisson distribution Blue bars denote a histogram of data divided into 1 sec bins. Red curve is a Poisson curve with rate = median count rate of data. |
 |
 |
| Quadrant-wise count rates Data is divided into 100 sec bins |
 |
|
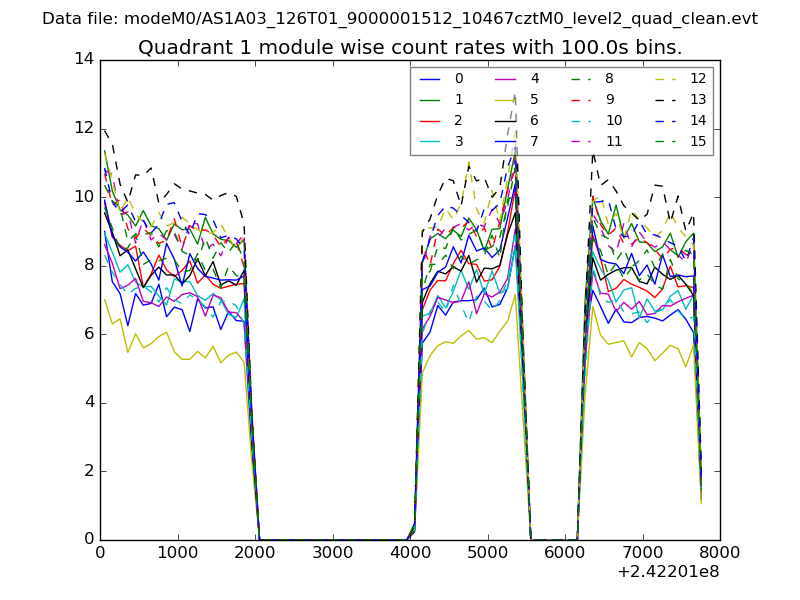
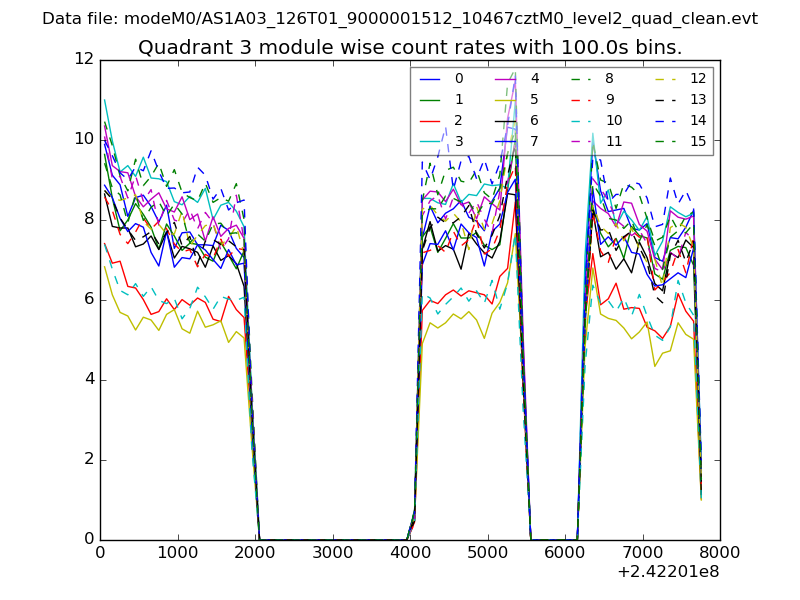
| Module-wise count rates for Quadrant A Data is divided into 100 sec bins |
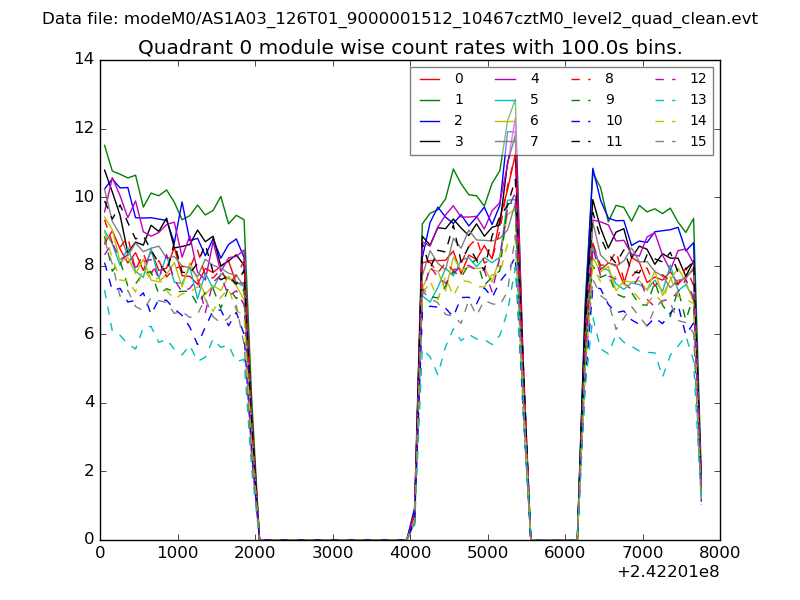 |
 |
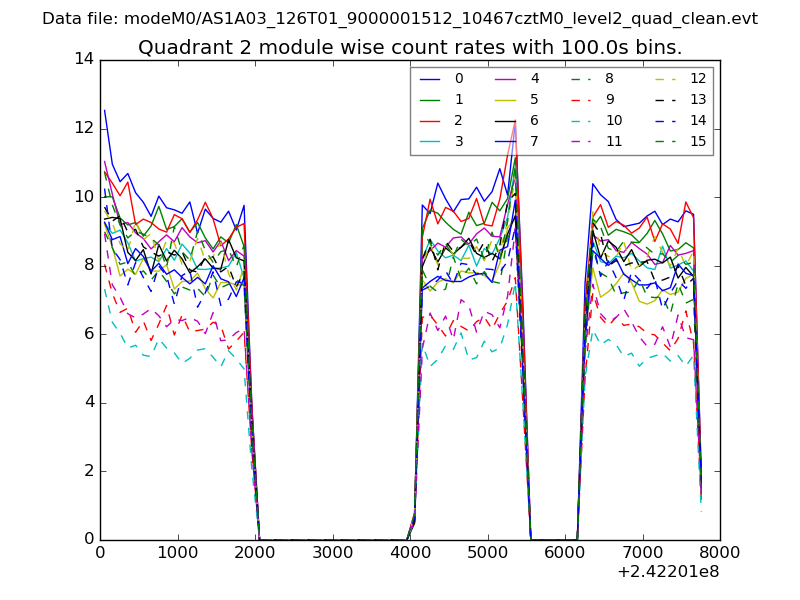
| Module-wise count rates for Quadrant B Data is divided into 100 sec bins |
 |
 |
| Module-wise count rates for Quadrant C Data is divided into 100 sec bins |
 |
 |
| Module-wise count rates for Quadrant D Data is divided into 100 sec bins |
 |
 |
| Parameter | Plot |
|---|---|
| CZT HV Monitor | 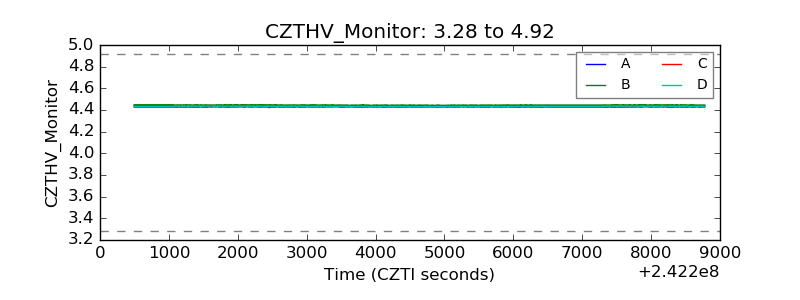 |
| D_VDD | 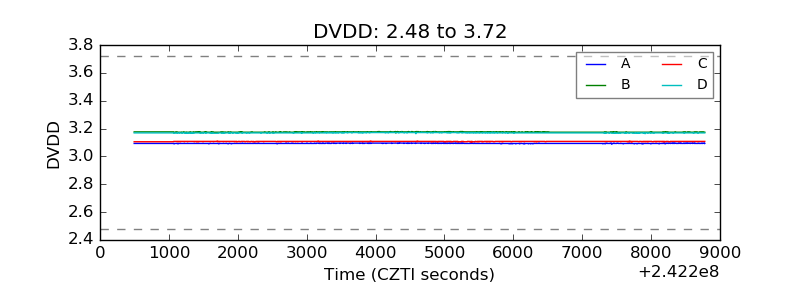 |
| Temperature 1 | 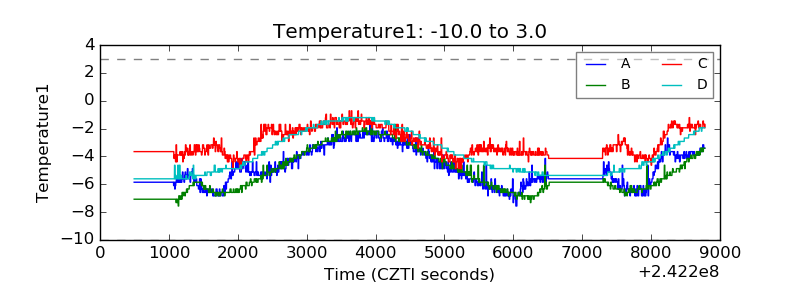 |
| Veto HV Monitor | 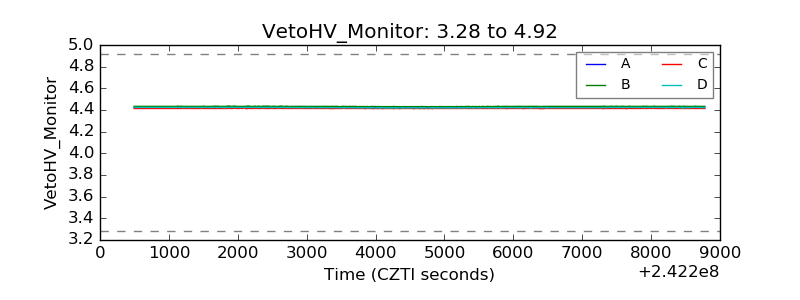 |
| Veto LLD | 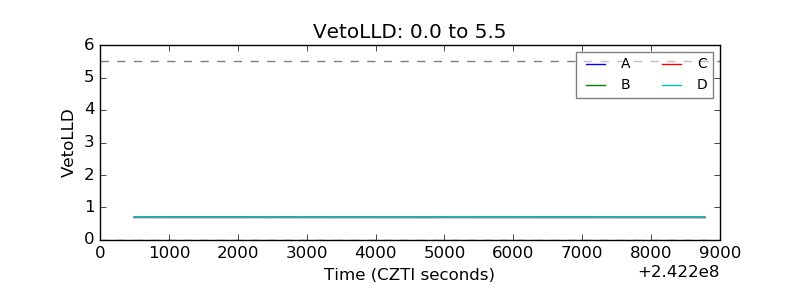 |
| Alpha Counter |  |
| _CPM_Rate | 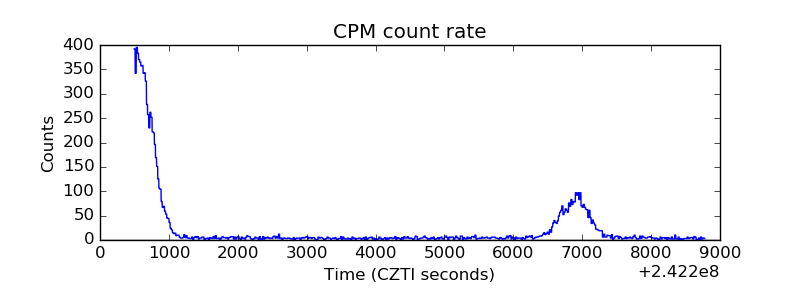 |
| CZT Counter |  |
| +2.5 Volts monitor |  |
| +5 Volts monitor |  |
| _ROLL_ROT | 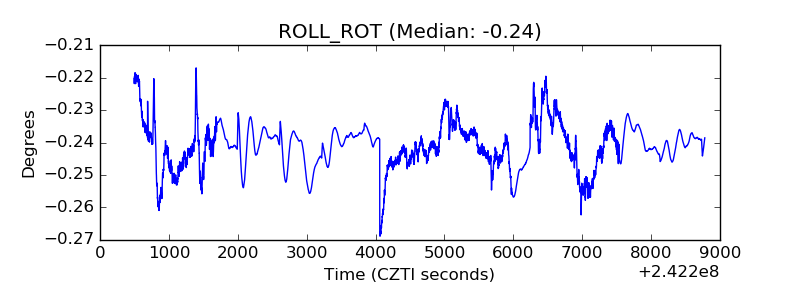 |
| _Roll_DEC | 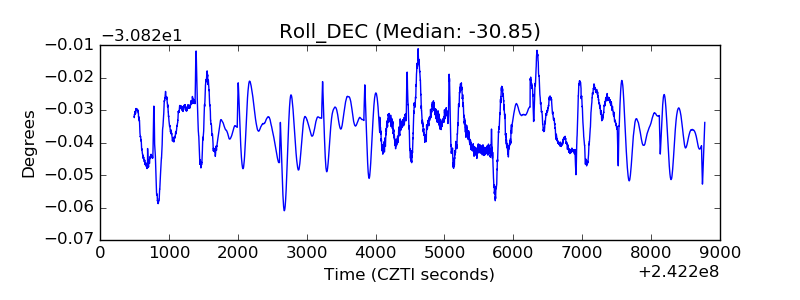 |
| _Roll_RA | 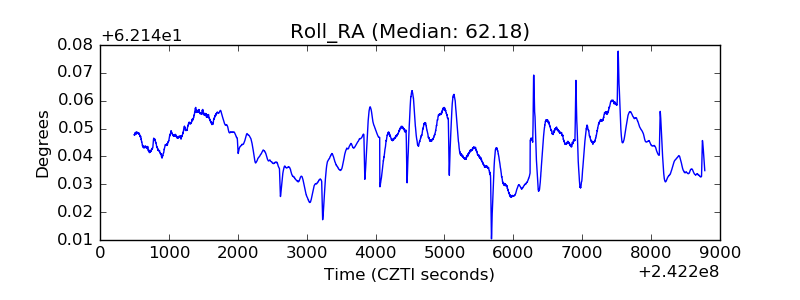 |
| Veto Counter | 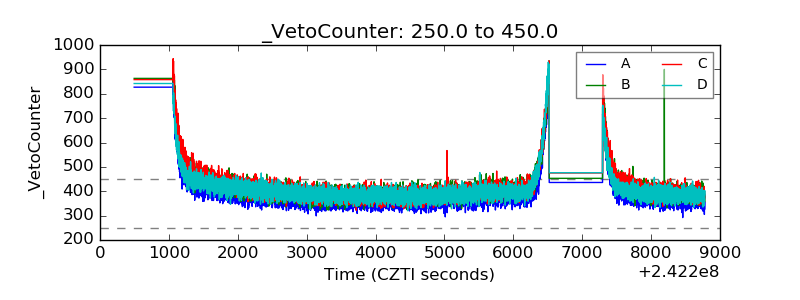 |