| Param | Original file | Final file |
|---|---|---|
| Filename | modeM0/AS1A03_126T01_9000001512_10468cztM0_level2.evt | modeM0/AS1A03_126T01_9000001512_10468cztM0_level2_quad_clean.evt |
| Size (bytes) | 460,820,160 | 72,316,800 |
| Size | 439.5 MB | 69.0 MB |
| Events in quadrant A | 3,163,139 | 435,888 |
| Events in quadrant B | 3,348,009 | 439,564 |
| Events in quadrant C | 2,812,612 | 445,751 |
| Events in quadrant D | 4,207,122 | 432,491 |
| Mode SS | |||
|---|---|---|---|
| Quadrant | BADHDUFLAG | Total packets | Discarded packets |
| A | 0 | 230 | 96 |
| B | 0 | 232 | 99 |
| C | 0 | 232 | 100 |
| D | 0 | 227 | 86 |
| Mode M0 | |||
|---|---|---|---|
| Quadrant | BADHDUFLAG | Total packets | Discarded packets |
| A | 0 | 23627 | 10487 |
| B | 0 | 26693 | 12831 |
| C | 0 | 23518 | 10732 |
| D | 0 | 30361 | 13472 |
| Mode M9 | |||
|---|---|---|---|
| Quadrant | BADHDUFLAG | Total packets | Discarded packets |
| A | 0 | 7 | 3 |
| B | 0 | 8 | 4 |
| C | 0 | 8 | 4 |
| D | 0 | 7 | 4 |
| Quadrant | Total seconds | Saturated seconds | Saturation percentage |
|---|---|---|---|
| A | 6207 | 150 | 2.416626% |
| B | 6077 | 186 | 3.060721% |
| C | 6271 | 107 | 1.706267% |
| D | 6366 | 242 | 3.801445% |
Noise dominated data is calculated using 1-second bins in cleaned event files. If a bin has >2000 counts, and if more than 50% of those come from <1% of pixels, then it is considered to be noise-dominated and hence unusable.
| Quadrant | # 1 sec bins | Bins with >0 counts | Bins with >2000 counts | High rate bins dominated by noise | Noise dominated (total time) | Noise dominated (detector-on time) | Marked lightcurve |
|---|---|---|---|---|---|---|---|
| A | 7549 | 6875 | 13 | 13 | 0.17% | 0.19% | 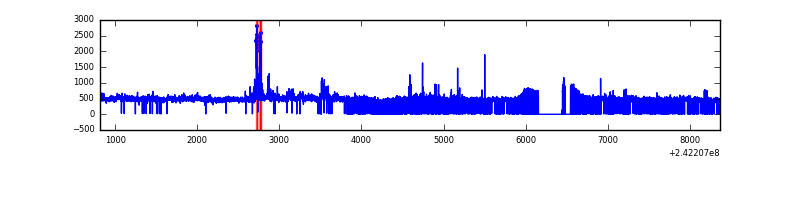 |
| B | 7550 | 6757 | 35 | 35 | 0.46% | 0.52% | 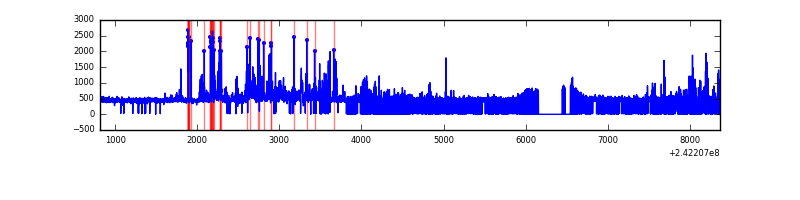 |
| C | 7550 | 6893 | 0 | 0 | 0.00% | 0.00% | 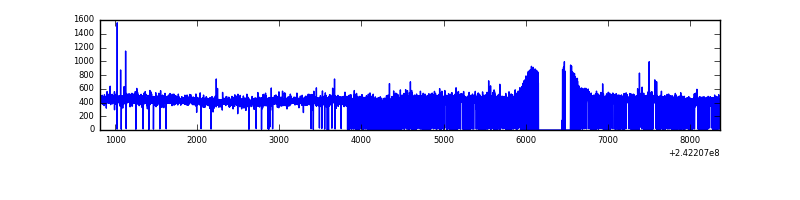 |
| D | 7547 | 6863 | 91 | 91 | 1.21% | 1.33% | 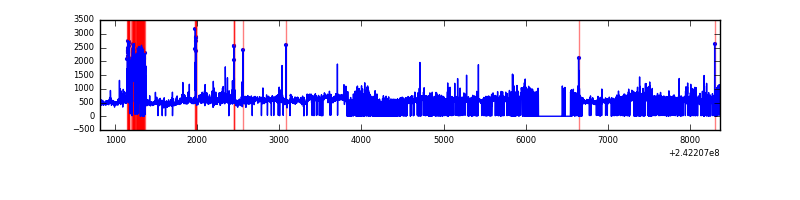 |
Top three noisy pixels from each quadrant. If the there are fewer than three noisy pixels in the level2.evt file, extra rows are filled as -1
| Pixel properties | Quadrant properties | ||||||
|---|---|---|---|---|---|---|---|
| Quadrant | DetID | PixID | Counts | Sigma | Mean | Median | Sigma |
| A | 13 | 251 | 135484 | 912.35 | 723 | 706 | 147.7 |
| A | 5 | 16 | 101931 | 685.22 | 723 | 706 | 147.7 |
| A | 3 | 80 | 86893 | 583.42 | 723 | 706 | 147.7 |
| B | 4 | 239 | 448013 | 3271.61 | 706 | 688 | 136.7 |
| B | 0 | 214 | 77161 | 559.3 | 706 | 688 | 136.7 |
| B | 11 | 51 | 44344 | 319.29 | 706 | 688 | 136.7 |
| C | 14 | 234 | 7399 | 39.92 | 718 | 722 | 167.3 |
| C | 13 | 61 | 5435 | 28.18 | 718 | 722 | 167.3 |
| C | 11 | 7 | 3391 | 15.96 | 718 | 722 | 167.3 |
| D | 1 | 20 | 580876 | 3057.9 | 722 | 706 | 189.7 |
| D | 8 | 195 | 452263 | 2380.02 | 722 | 706 | 189.7 |
| D | 13 | 104 | 298547 | 1569.83 | 722 | 706 | 189.7 |
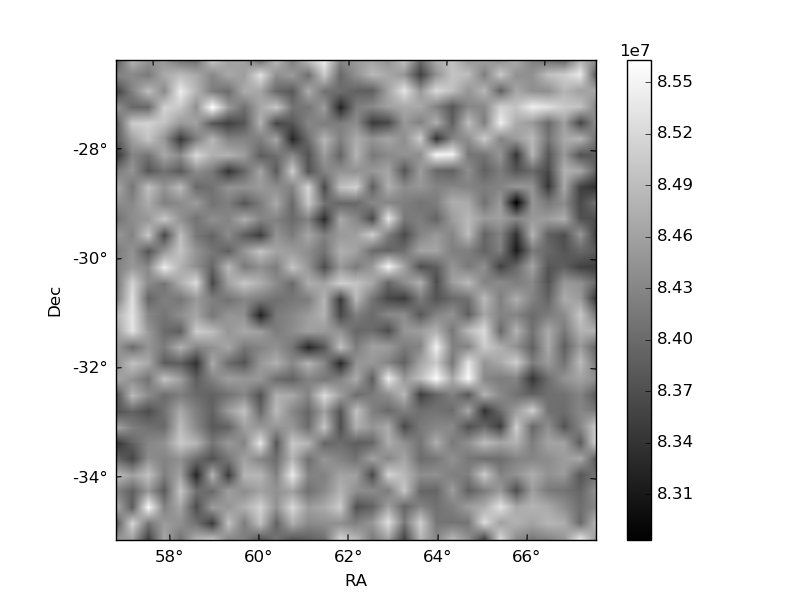
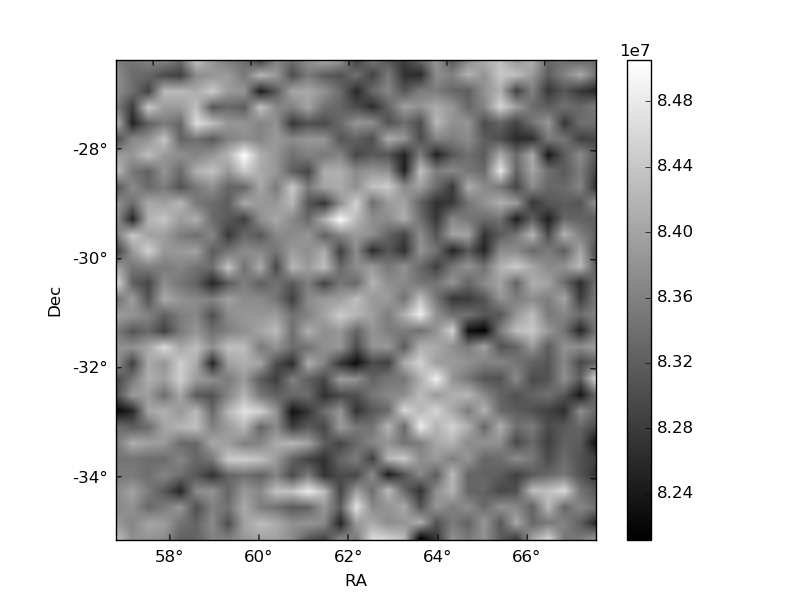
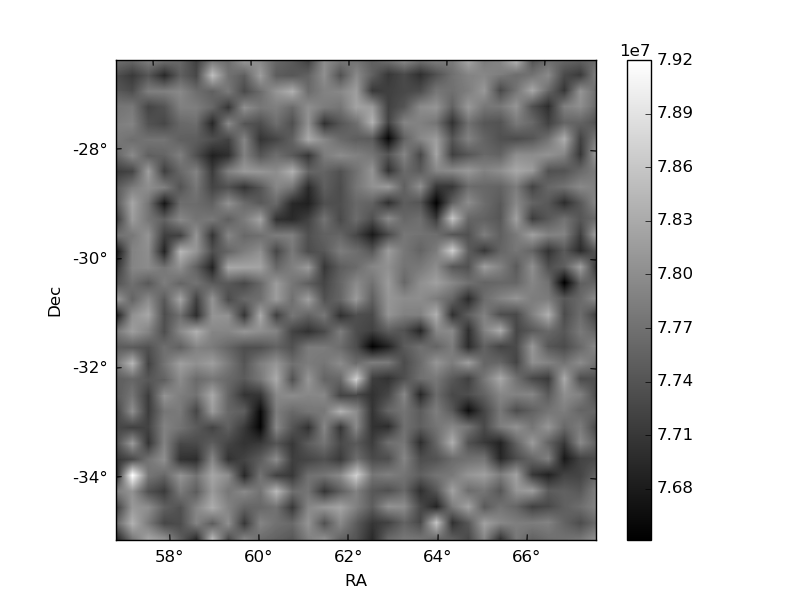
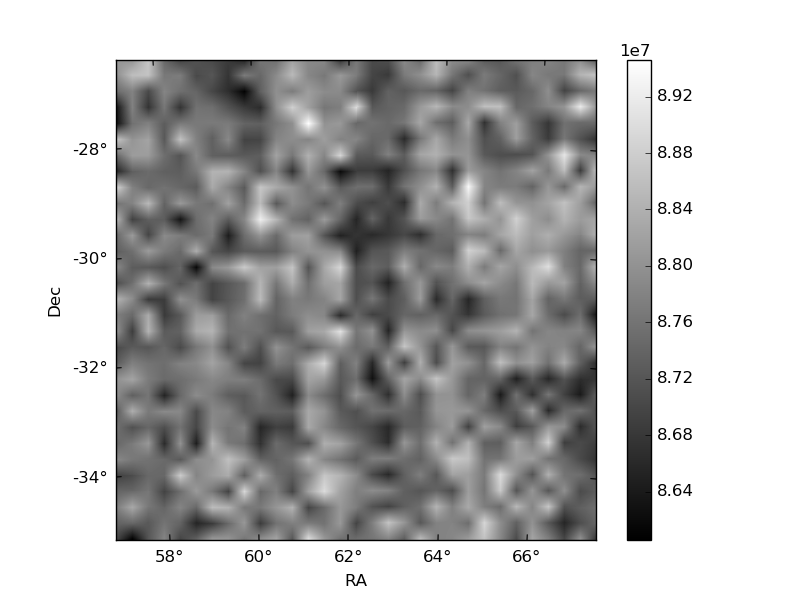
Histogram calculated using DETX and DETY for each event in the final _common_clean file
| Quadrant A |  |
 |
Quadrant B |
|---|---|---|---|
| Quadrant D |  |
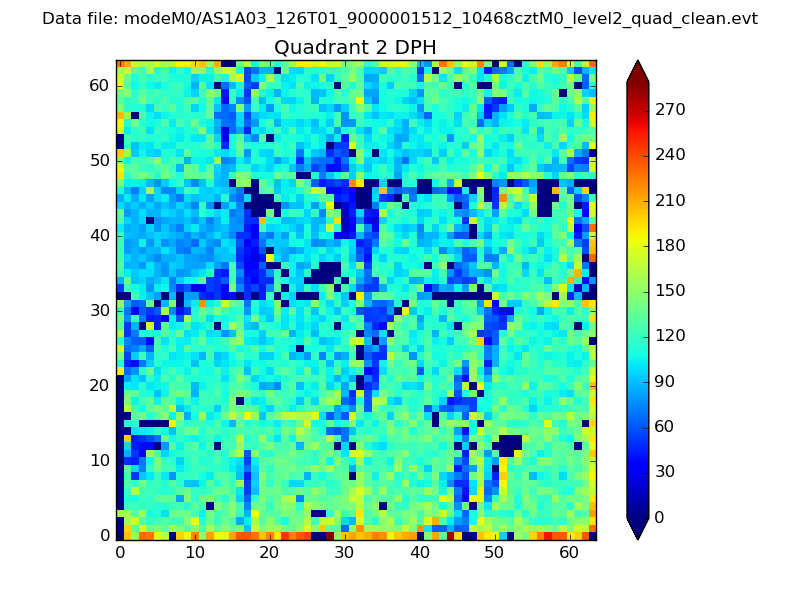 |
Quadrant C |
| Plot type | Count rate plots | Images |
|---|---|---|
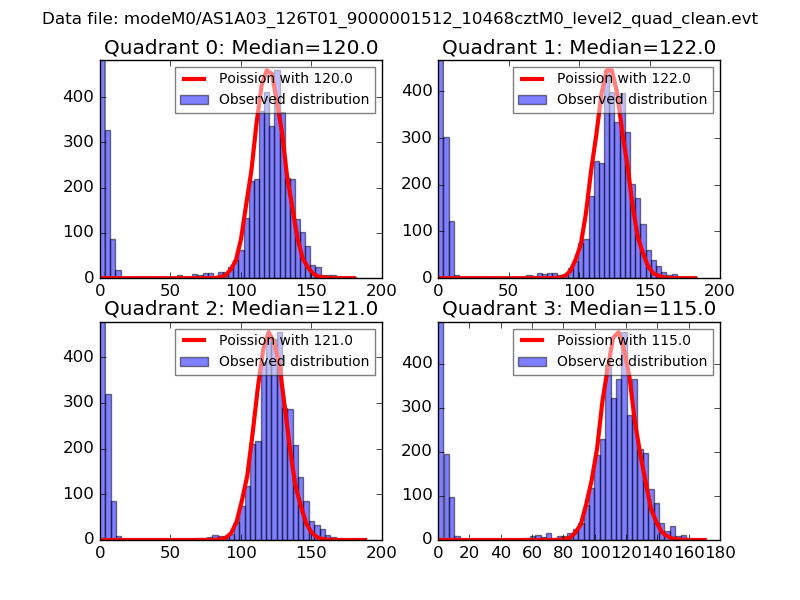
| Comparison with Poisson distribution Blue bars denote a histogram of data divided into 1 sec bins. Red curve is a Poisson curve with rate = median count rate of data. |
 |
 |
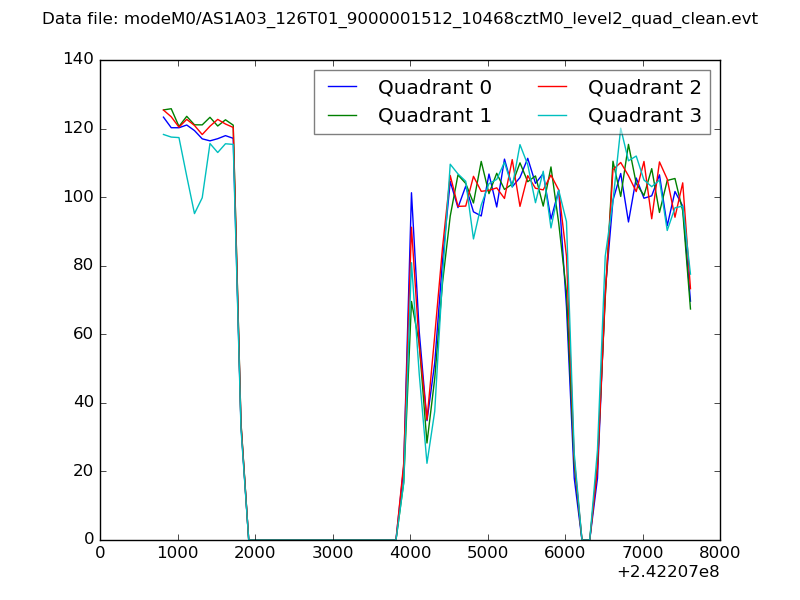
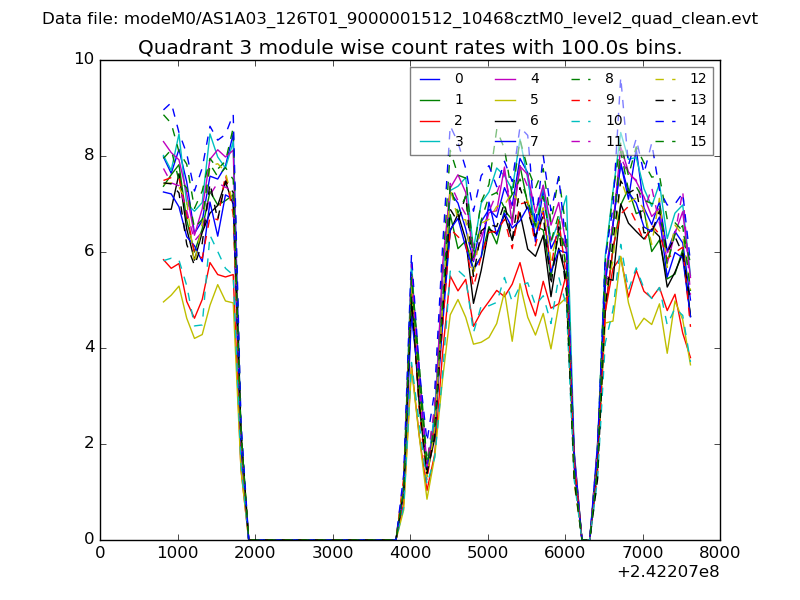
| Quadrant-wise count rates Data is divided into 100 sec bins |
 |
|
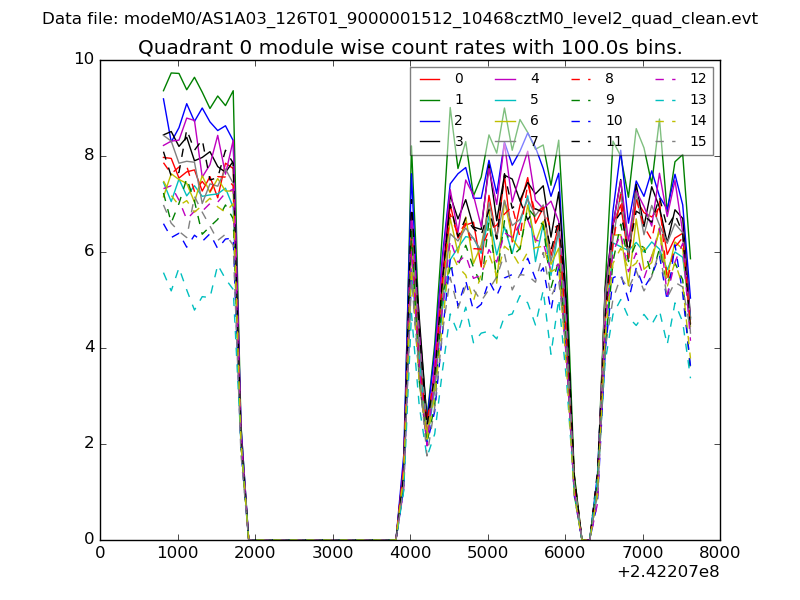
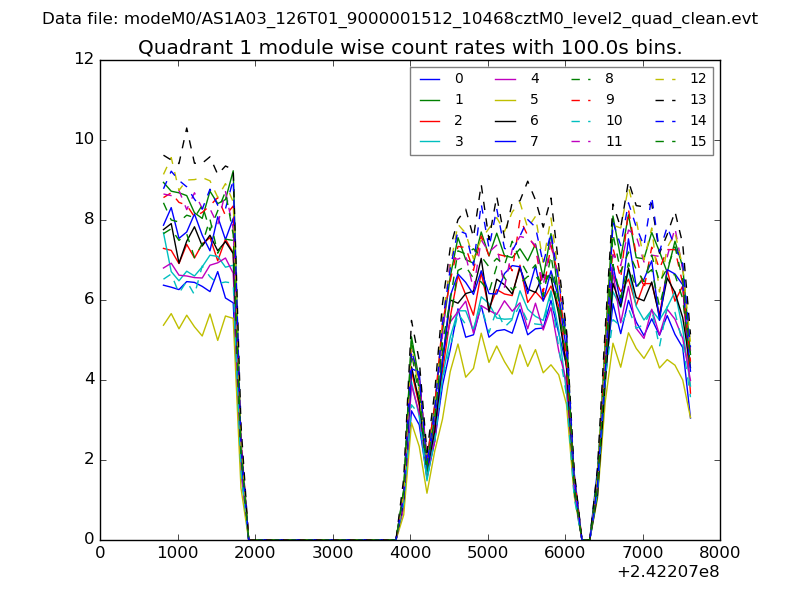
| Module-wise count rates for Quadrant A Data is divided into 100 sec bins |
 |
 |
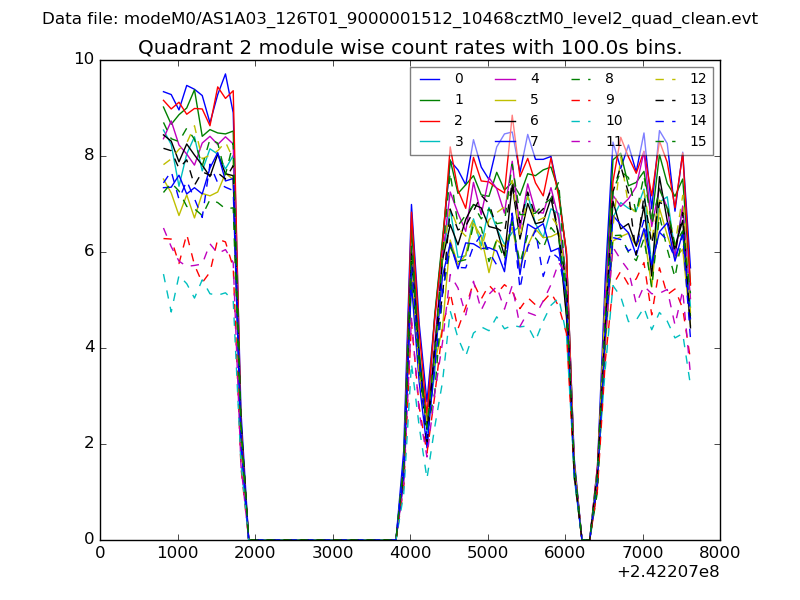
| Module-wise count rates for Quadrant B Data is divided into 100 sec bins |
 |
 |
| Module-wise count rates for Quadrant C Data is divided into 100 sec bins |
 |
 |
| Module-wise count rates for Quadrant D Data is divided into 100 sec bins |
 |
 |
| Parameter | Plot |
|---|---|
| CZT HV Monitor | 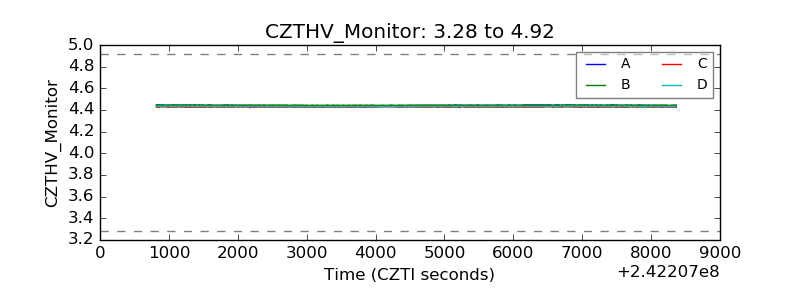 |
| D_VDD | 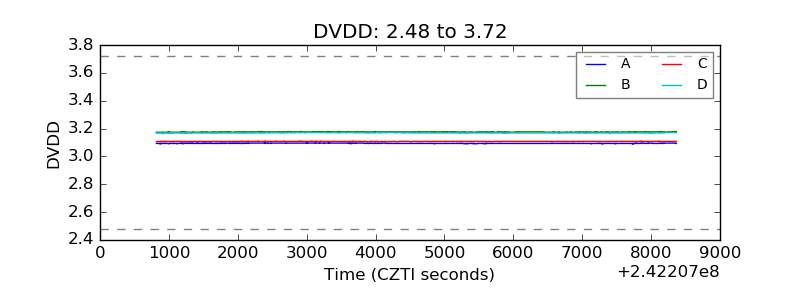 |
| Temperature 1 | 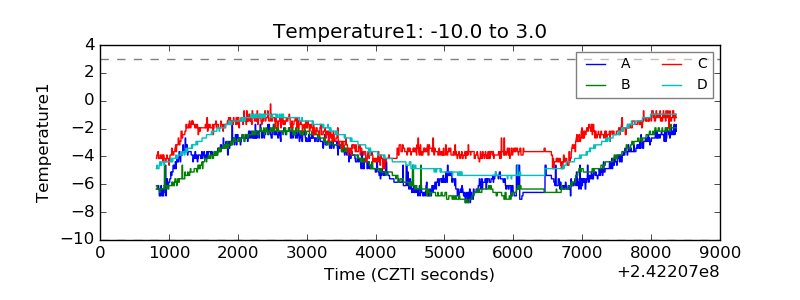 |
| Veto HV Monitor | 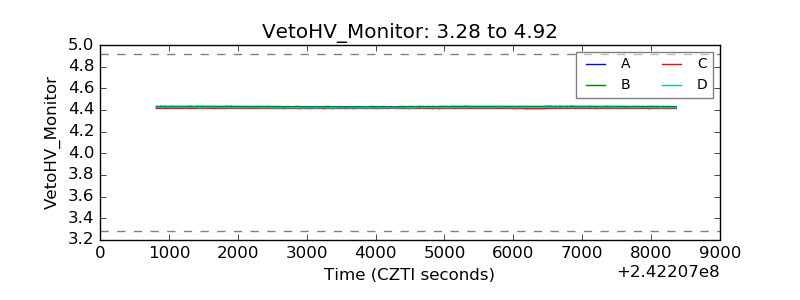 |
| Veto LLD |  |
| Alpha Counter | 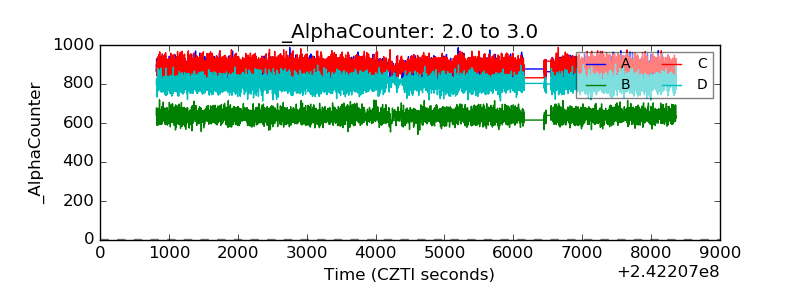 |
| _CPM_Rate | 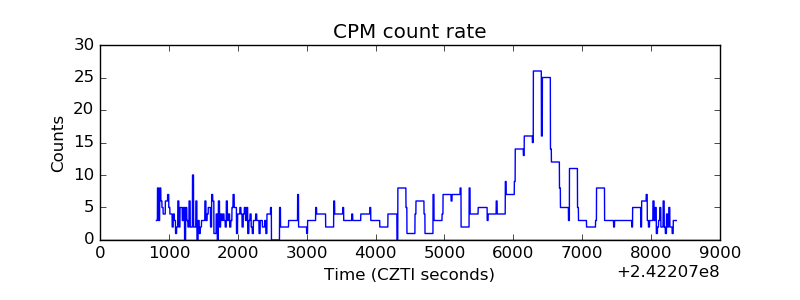 |
| CZT Counter |  |
| +2.5 Volts monitor |  |
| +5 Volts monitor | 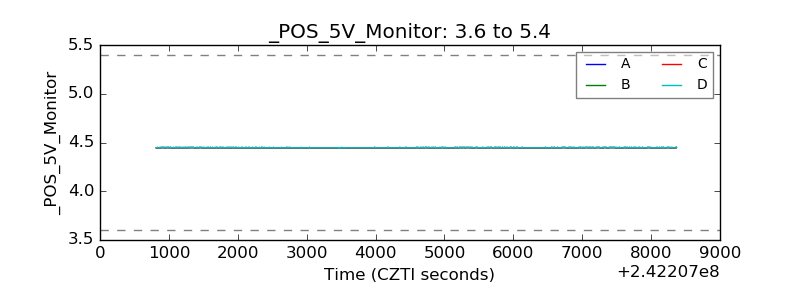 |
| _ROLL_ROT | 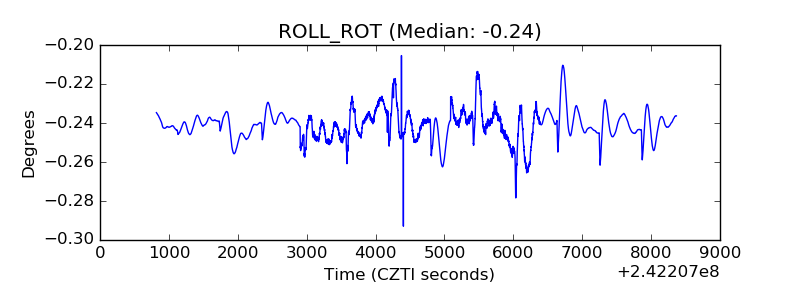 |
| _Roll_DEC | 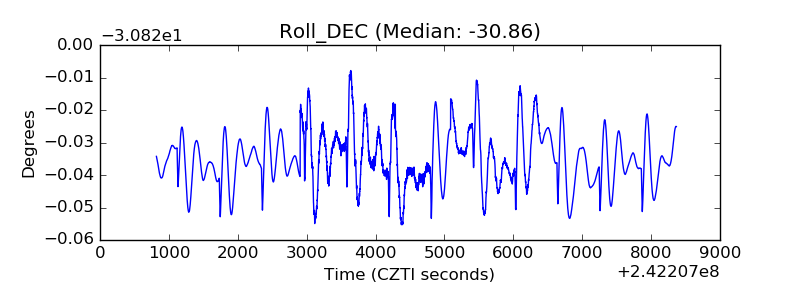 |
| _Roll_RA |  |
| Veto Counter | 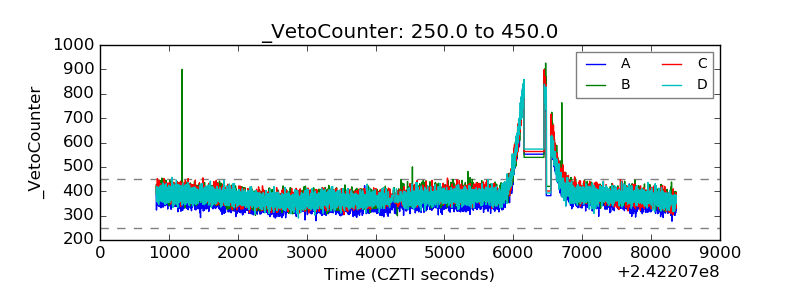 |