| Param | Original file | Final file |
|---|---|---|
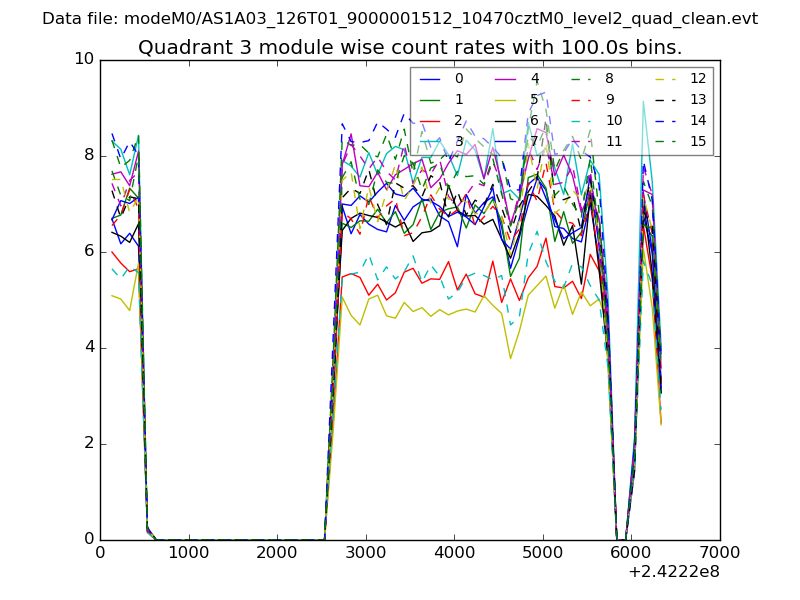
| Filename | modeM0/AS1A03_126T01_9000001512_10470cztM0_level2.evt | modeM0/AS1A03_126T01_9000001512_10470cztM0_level2_quad_clean.evt |
| Size (bytes) | 501,520,320 | 70,401,600 |
| Size | 478.3 MB | 67.1 MB |
| Events in quadrant A | 4,103,660 | 413,943 |
| Events in quadrant B | 3,638,774 | 416,811 |
| Events in quadrant C | 2,999,779 | 415,063 |
| Events in quadrant D | 3,990,785 | 418,876 |
| Mode SS | |||
|---|---|---|---|
| Quadrant | BADHDUFLAG | Total packets | Discarded packets |
| A | 0 | 216 | 70 |
| B | 0 | 216 | 75 |
| C | 0 | 216 | 72 |
| D | 0 | 208 | 66 |
| Mode M0 | |||
|---|---|---|---|
| Quadrant | BADHDUFLAG | Total packets | Discarded packets |
| A | 0 | 24605 | 8367 |
| B | 0 | 24668 | 9605 |
| C | 0 | 22008 | 8322 |
| D | 0 | 28716 | 12401 |
| Mode M9 | |||
|---|---|---|---|
| Quadrant | BADHDUFLAG | Total packets | Discarded packets |
| A | 0 | 6 | 3 |
| B | 0 | 6 | 3 |
| C | 0 | 6 | 3 |
| D | 0 | 6 | 3 |
| Quadrant | Total seconds | Saturated seconds | Saturation percentage |
|---|---|---|---|
| A | 6680 | 333 | 4.985030% |
| B | 6610 | 179 | 2.708018% |
| C | 6725 | 48 | 0.713755% |
| D | 6690 | 96 | 1.434978% |
Noise dominated data is calculated using 1-second bins in cleaned event files. If a bin has >2000 counts, and if more than 50% of those come from <1% of pixels, then it is considered to be noise-dominated and hence unusable.
| Quadrant | # 1 sec bins | Bins with >0 counts | Bins with >2000 counts | High rate bins dominated by noise | Noise dominated (total time) | Noise dominated (detector-on time) | Marked lightcurve |
|---|---|---|---|---|---|---|---|
| A | 7680 | 7182 | 225 | 225 | 2.93% | 3.13% | 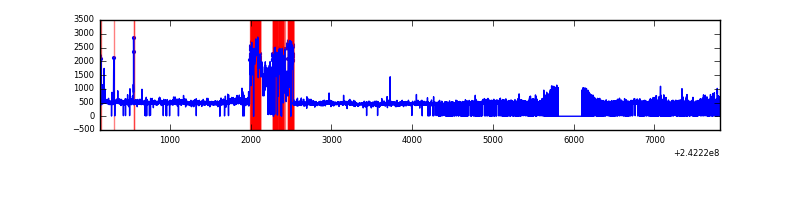 |
| B | 7681 | 7127 | 60 | 60 | 0.78% | 0.84% | 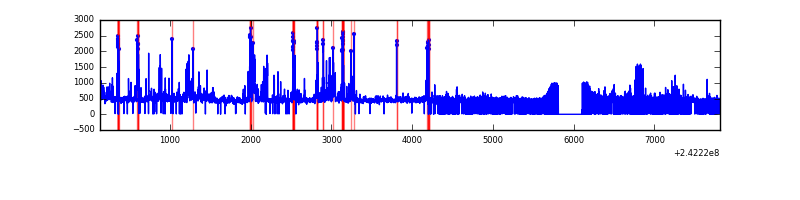 |
| C | 7681 | 7225 | 1 | 1 | 0.01% | 0.01% | 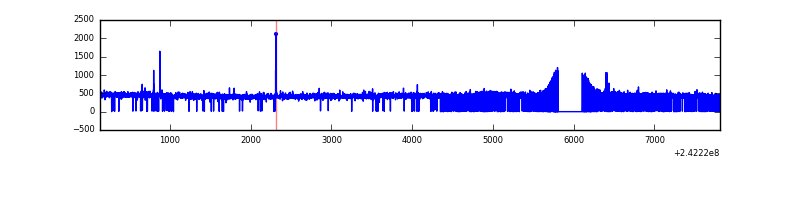 |
| D | 7677 | 7064 | 17 | 17 | 0.22% | 0.24% | 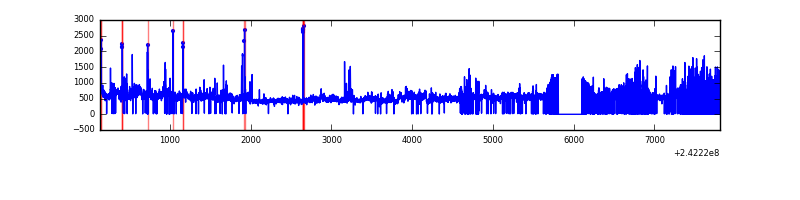 |
Top three noisy pixels from each quadrant. If the there are fewer than three noisy pixels in the level2.evt file, extra rows are filled as -1
| Pixel properties | Quadrant properties | ||||||
|---|---|---|---|---|---|---|---|
| Quadrant | DetID | PixID | Counts | Sigma | Mean | Median | Sigma |
| A | 15 | 174 | 734939 | 4626.98 | 770 | 751 | 158.7 |
| A | 13 | 251 | 223760 | 1405.44 | 770 | 751 | 158.7 |
| A | 3 | 80 | 109878 | 687.74 | 770 | 751 | 158.7 |
| B | 4 | 239 | 480217 | 3213.62 | 765 | 745 | 149.2 |
| B | 0 | 214 | 61381 | 406.41 | 765 | 745 | 149.2 |
| B | 11 | 51 | 46492 | 306.61 | 765 | 745 | 149.2 |
| C | 14 | 234 | 13786 | 72.91 | 764 | 767 | 178.6 |
| C | 13 | 61 | 5551 | 26.79 | 764 | 767 | 178.6 |
| C | 14 | 67 | 4994 | 23.67 | 764 | 767 | 178.6 |
| D | 1 | 20 | 704815 | 3783.93 | 762 | 741 | 186.1 |
| D | 8 | 195 | 222337 | 1190.93 | 762 | 741 | 186.1 |
| D | 1 | 52 | 57079 | 302.78 | 762 | 741 | 186.1 |
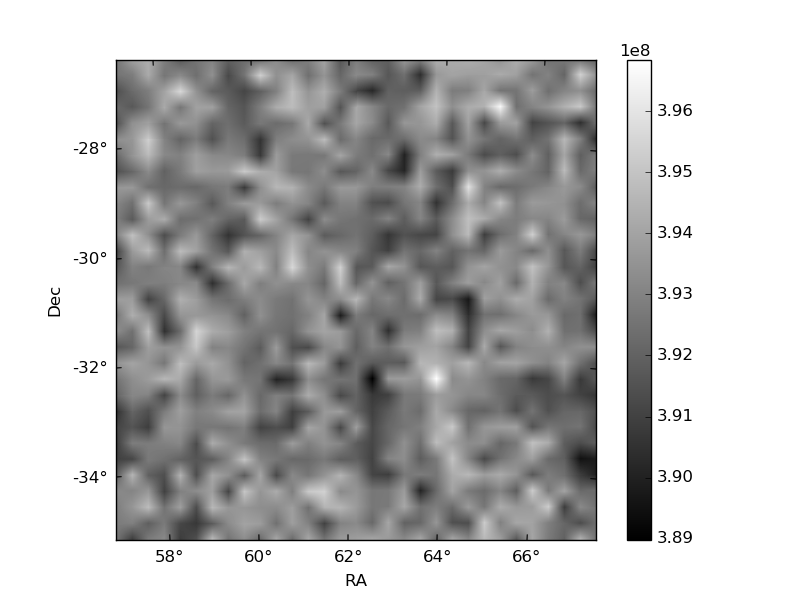
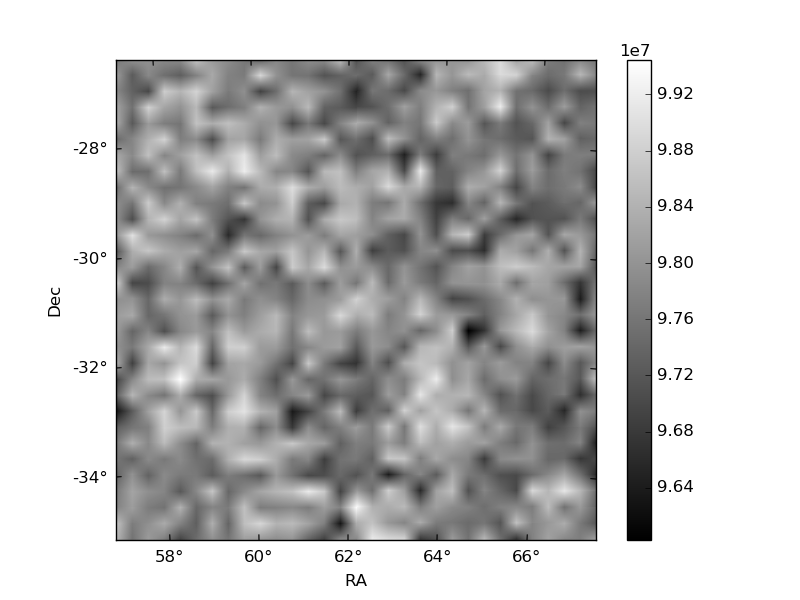
Histogram calculated using DETX and DETY for each event in the final _common_clean file
| Quadrant A | 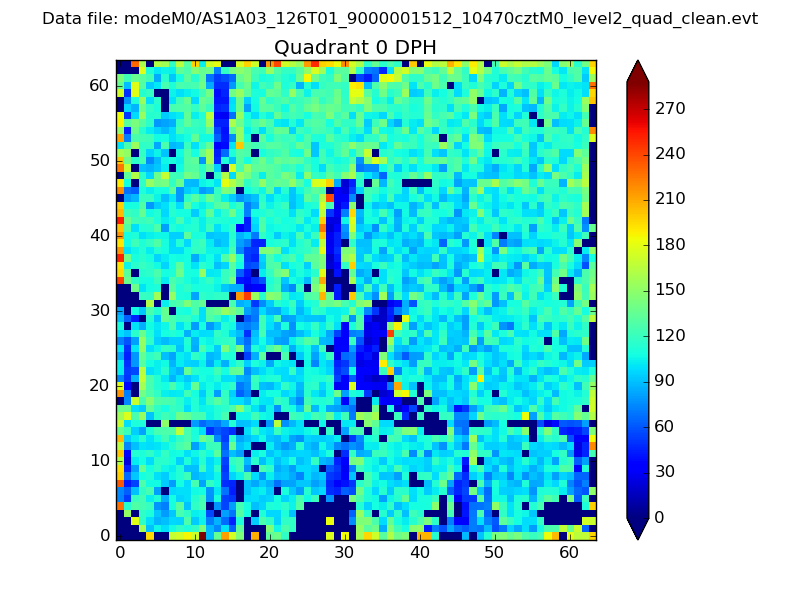 |
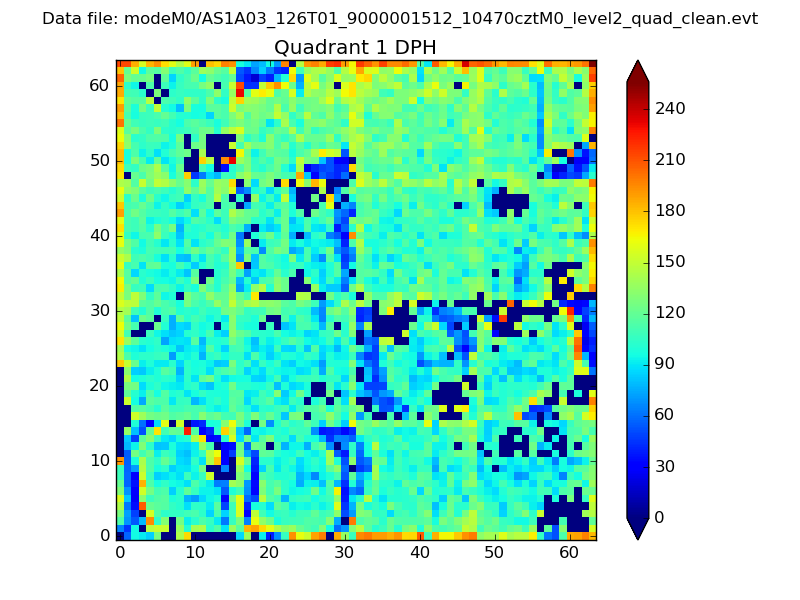 |
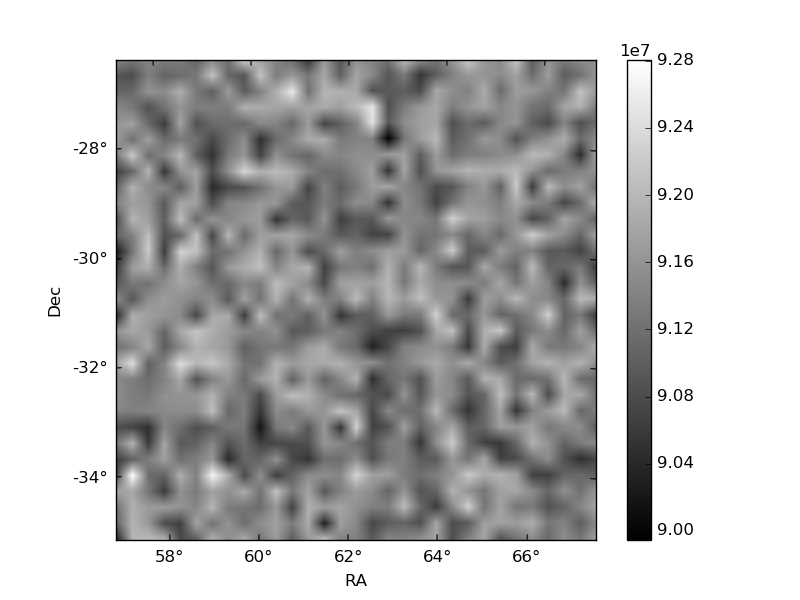
Quadrant B |
|---|---|---|---|
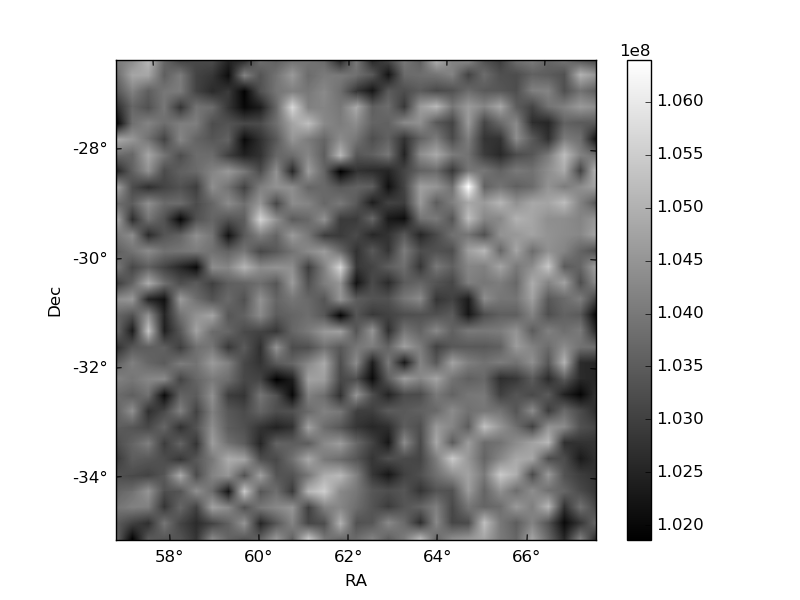
| Quadrant D | 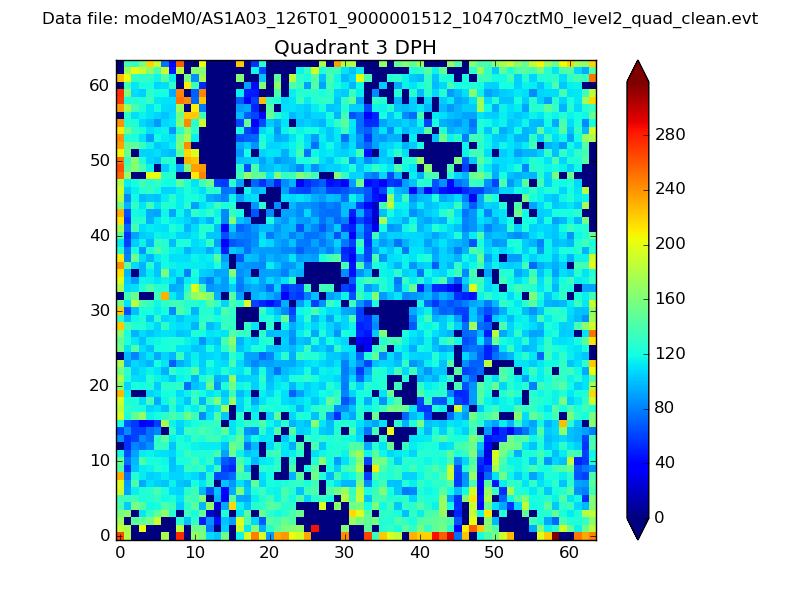 |
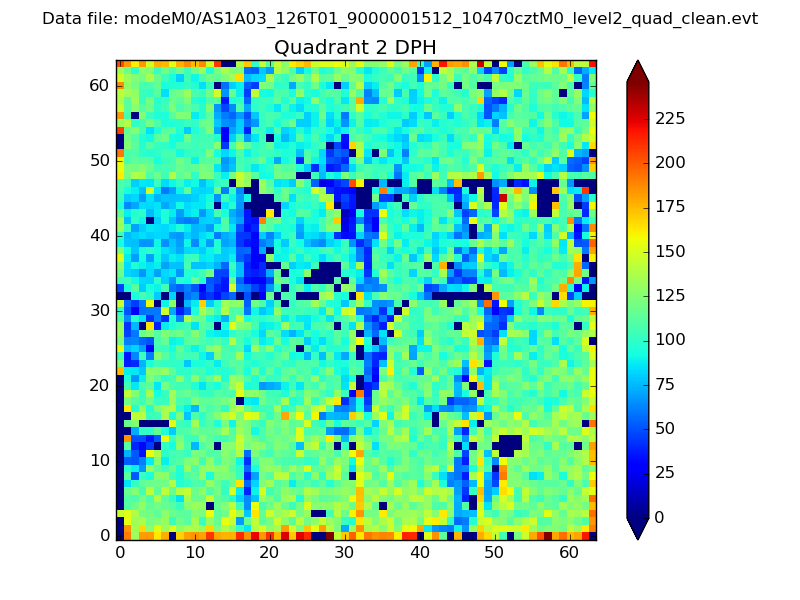 |
Quadrant C |
| Plot type | Count rate plots | Images |
|---|---|---|
| Comparison with Poisson distribution Blue bars denote a histogram of data divided into 1 sec bins. Red curve is a Poisson curve with rate = median count rate of data. |
 |
 |
| Quadrant-wise count rates Data is divided into 100 sec bins |
 |
|
| Module-wise count rates for Quadrant A Data is divided into 100 sec bins |
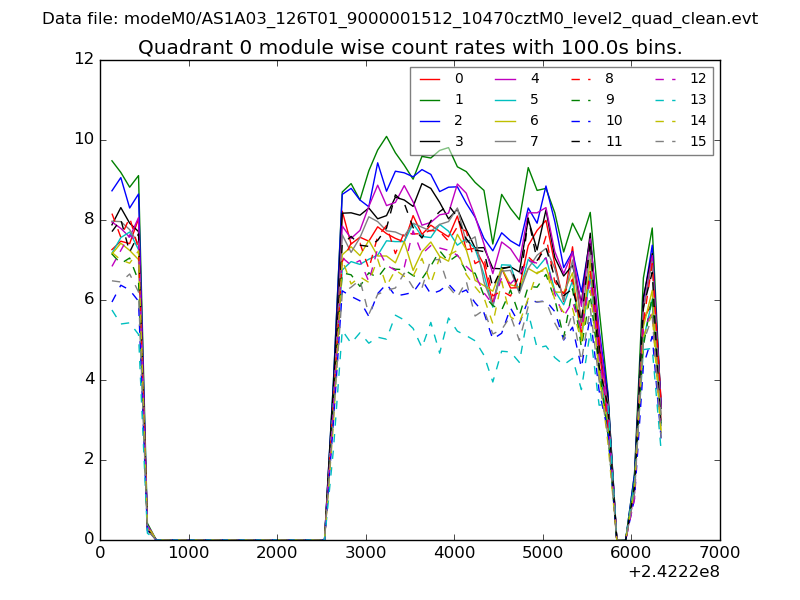 |
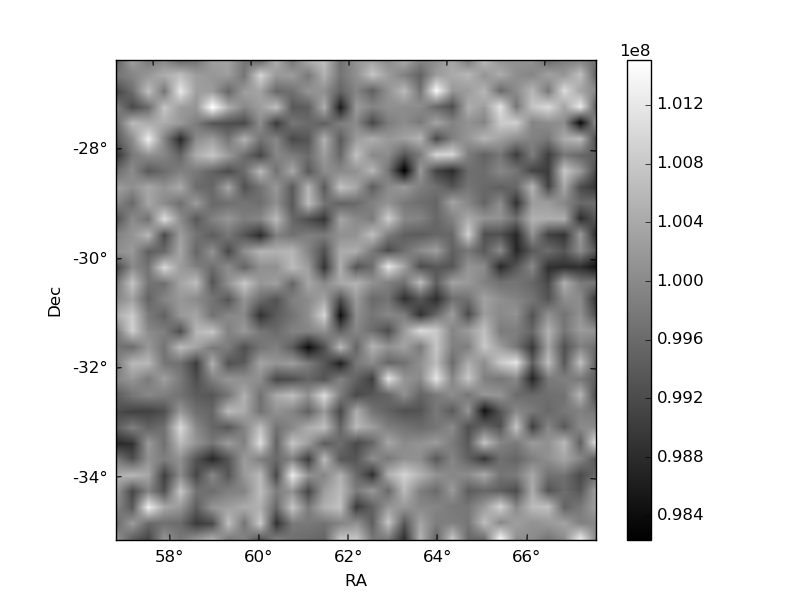 |
| Module-wise count rates for Quadrant B Data is divided into 100 sec bins |
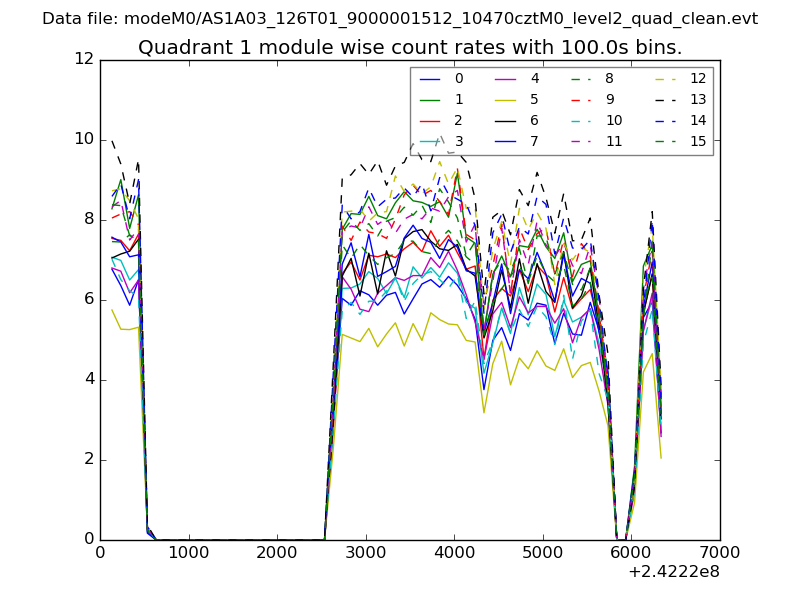 |
 |
| Module-wise count rates for Quadrant C Data is divided into 100 sec bins |
 |
 |
| Module-wise count rates for Quadrant D Data is divided into 100 sec bins |
 |
 |
| Parameter | Plot |
|---|---|
| CZT HV Monitor | 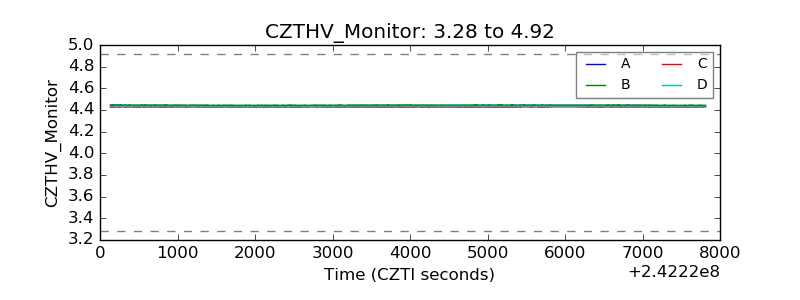 |
| D_VDD | 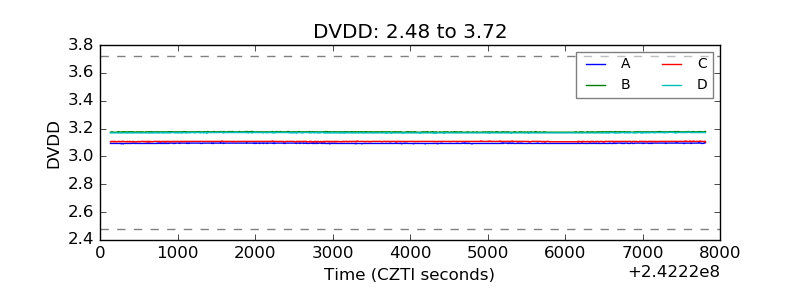 |
| Temperature 1 | 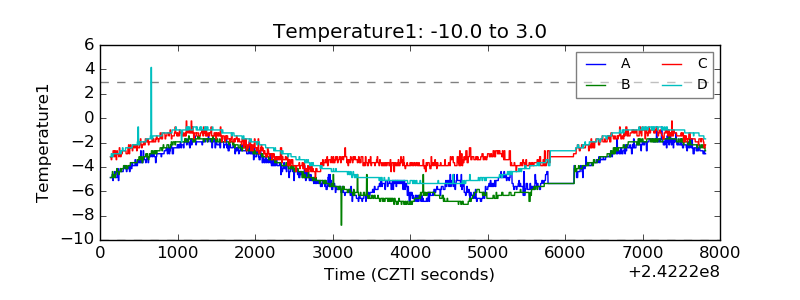 |
| Veto HV Monitor | 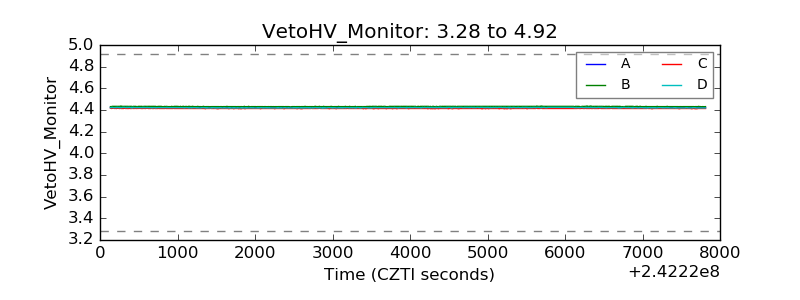 |
| Veto LLD | 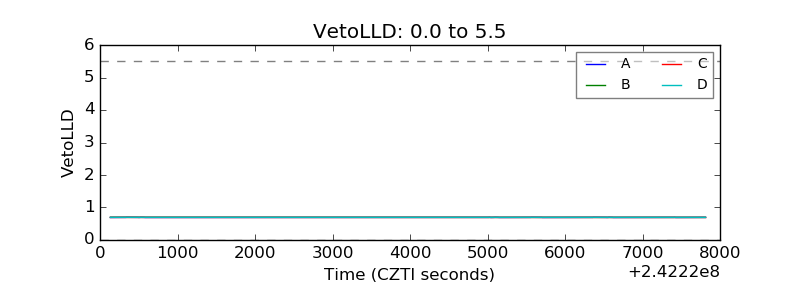 |
| Alpha Counter |  |
| _CPM_Rate | 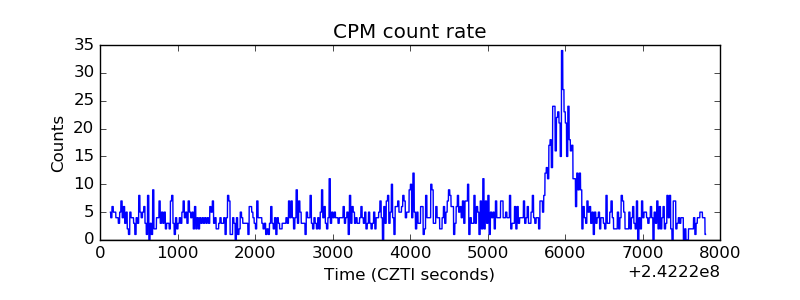 |
| CZT Counter |  |
| +2.5 Volts monitor |  |
| +5 Volts monitor |  |
| _ROLL_ROT | 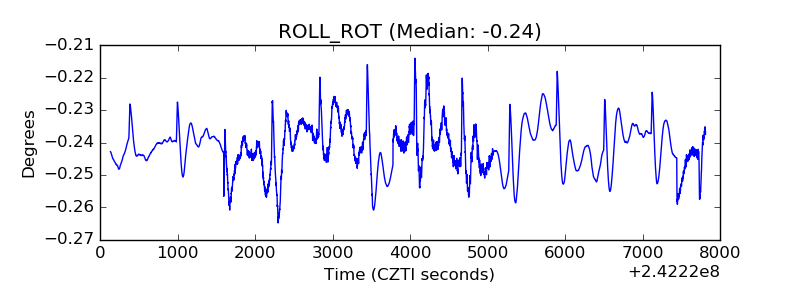 |
| _Roll_DEC | 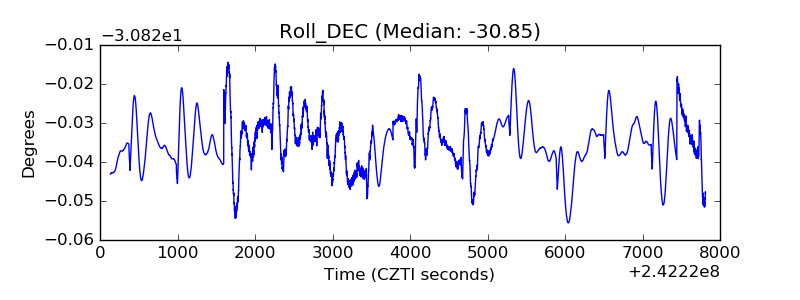 |
| _Roll_RA | 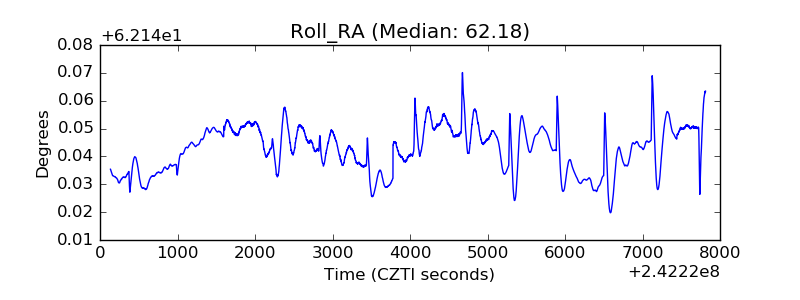 |
| Veto Counter | 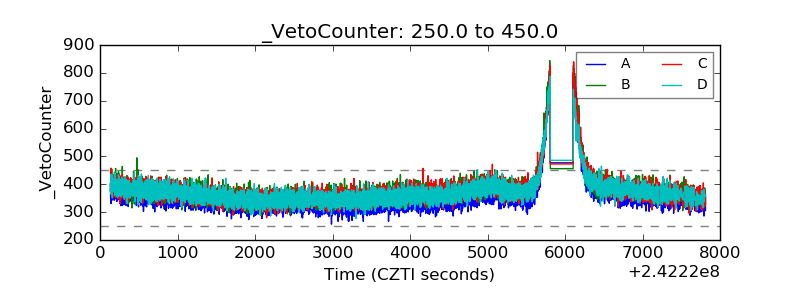 |