| Param | Original file | Final file |
|---|---|---|
| Filename | modeM0/AS1A03_126T01_9000001512_10473cztM0_level2.evt | modeM0/AS1A03_126T01_9000001512_10473cztM0_level2_quad_clean.evt |
| Size (bytes) | 1,368,322,560 | 220,104,000 |
| Size | 1.3 GB | 209.9 MB |
| Events in quadrant A | 10,104,714 | 1,369,275 |
| Events in quadrant B | 10,218,536 | 1,377,530 |
| Events in quadrant C | 8,214,772 | 1,366,494 |
| Events in quadrant D | 11,672,171 | 1,297,841 |
| Mode SS | |||
|---|---|---|---|
| Quadrant | BADHDUFLAG | Total packets | Discarded packets |
| A | 0 | 370 | 0 |
| B | 0 | 370 | 0 |
| C | 0 | 370 | 2 |
| D | 0 | 370 | 0 |
| Mode M0 | |||
|---|---|---|---|
| Quadrant | BADHDUFLAG | Total packets | Discarded packets |
| A | 0 | 41686 | 33 |
| B | 0 | 42431 | 64 |
| C | 0 | 37301 | 28 |
| D | 0 | 46731 | 79 |
| Mode M9 | |||
|---|---|---|---|
| Quadrant | BADHDUFLAG | Total packets | Discarded packets |
| A | 0 | 21 | 0 |
| B | 0 | 21 | 0 |
| C | 0 | 21 | 0 |
| D | 0 | 22 | 0 |
| Quadrant | Total seconds | Saturated seconds | Saturation percentage |
|---|---|---|---|
| A | 18217 | 238 | 1.306472% |
| B | 18205 | 563 | 3.092557% |
| C | 18218 | 109 | 0.598309% |
| D | 18206 | 329 | 1.807097% |
Noise dominated data is calculated using 1-second bins in cleaned event files. If a bin has >2000 counts, and if more than 50% of those come from <1% of pixels, then it is considered to be noise-dominated and hence unusable.
| Quadrant | # 1 sec bins | Bins with >0 counts | Bins with >2000 counts | High rate bins dominated by noise | Noise dominated (total time) | Noise dominated (detector-on time) | Marked lightcurve |
|---|---|---|---|---|---|---|---|
| A | 20330 | 18230 | 36 | 36 | 0.18% | 0.20% | 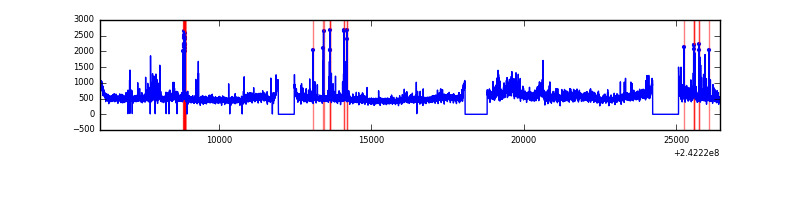 |
| B | 20330 | 18229 | 227 | 227 | 1.12% | 1.25% | 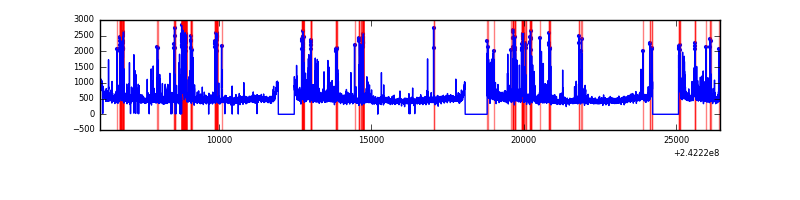 |
| C | 20330 | 18231 | 11 | 11 | 0.05% | 0.06% | 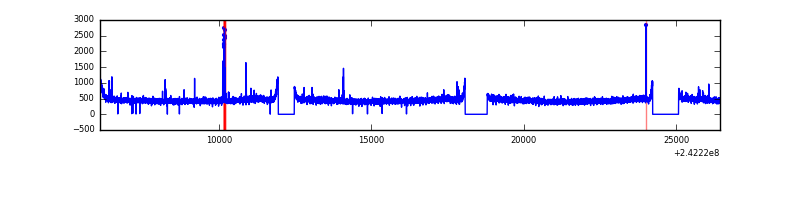 |
| D | 20330 | 18226 | 238 | 238 | 1.17% | 1.31% |  |
Top three noisy pixels from each quadrant. If the there are fewer than three noisy pixels in the level2.evt file, extra rows are filled as -1
| Pixel properties | Quadrant properties | ||||||
|---|---|---|---|---|---|---|---|
| Quadrant | DetID | PixID | Counts | Sigma | Mean | Median | Sigma |
| A | 13 | 251 | 1037793 | 2375.92 | 2129 | 2075 | 435.9 |
| A | 3 | 80 | 312417 | 711.92 | 2129 | 2075 | 435.9 |
| A | 15 | 239 | 292874 | 667.09 | 2129 | 2075 | 435.9 |
| B | 4 | 239 | 1608170 | 3971.08 | 2118 | 2065 | 404.5 |
| B | 11 | 51 | 136406 | 332.16 | 2118 | 2065 | 404.5 |
| B | 0 | 214 | 108901 | 264.15 | 2118 | 2065 | 404.5 |
| C | 14 | 234 | 90185 | 182.57 | 2080 | 2091 | 482.5 |
| C | 13 | 61 | 15458 | 27.7 | 2080 | 2091 | 482.5 |
| C | 14 | 67 | 7728 | 11.68 | 2080 | 2091 | 482.5 |
| D | 1 | 52 | 1980651 | 4011.9 | 2056 | 2001 | 493.2 |
| D | 1 | 20 | 911488 | 1844.07 | 2056 | 2001 | 493.2 |
| D | 8 | 195 | 736568 | 1489.4 | 2056 | 2001 | 493.2 |
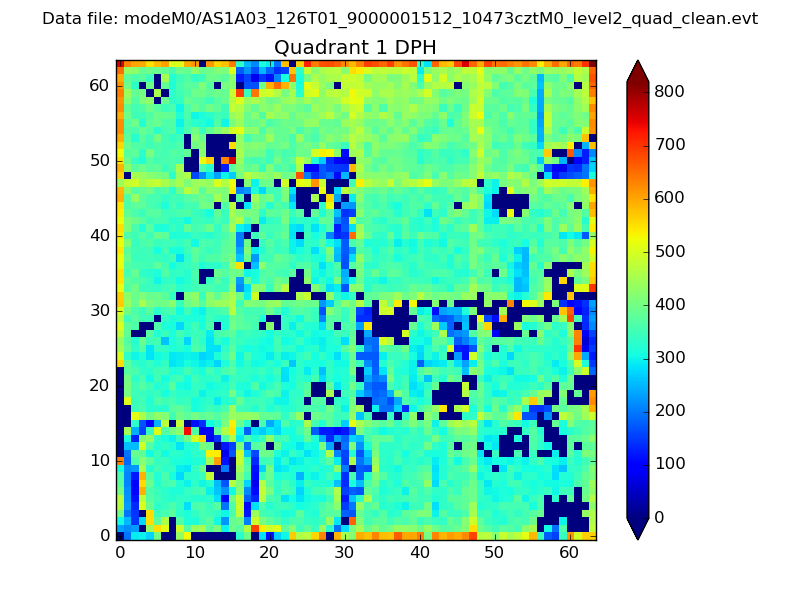
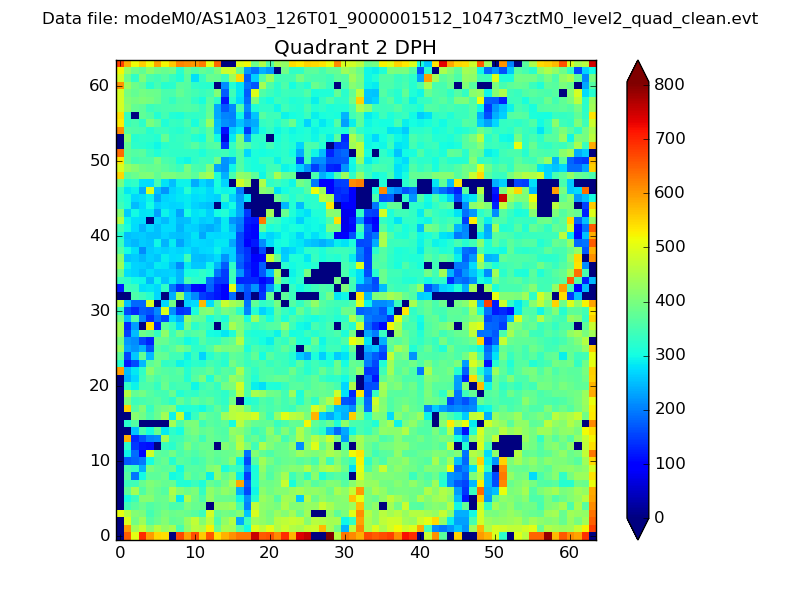
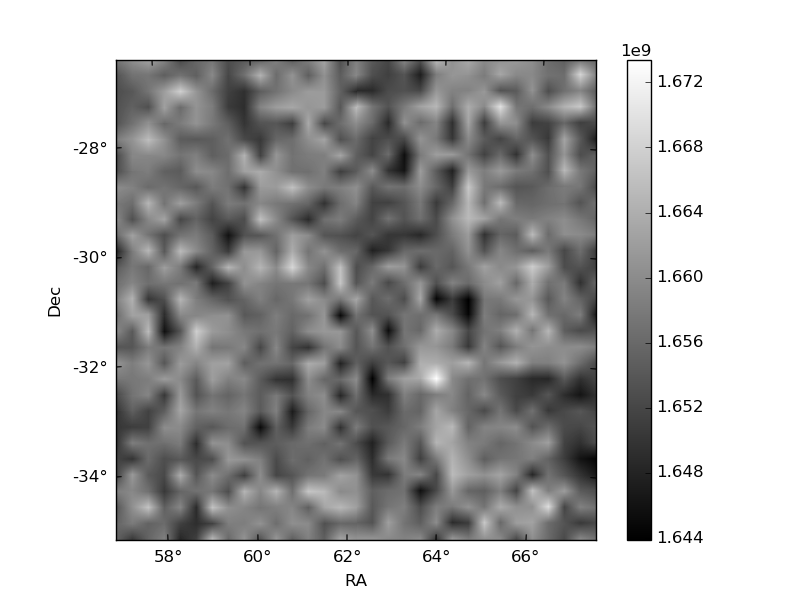
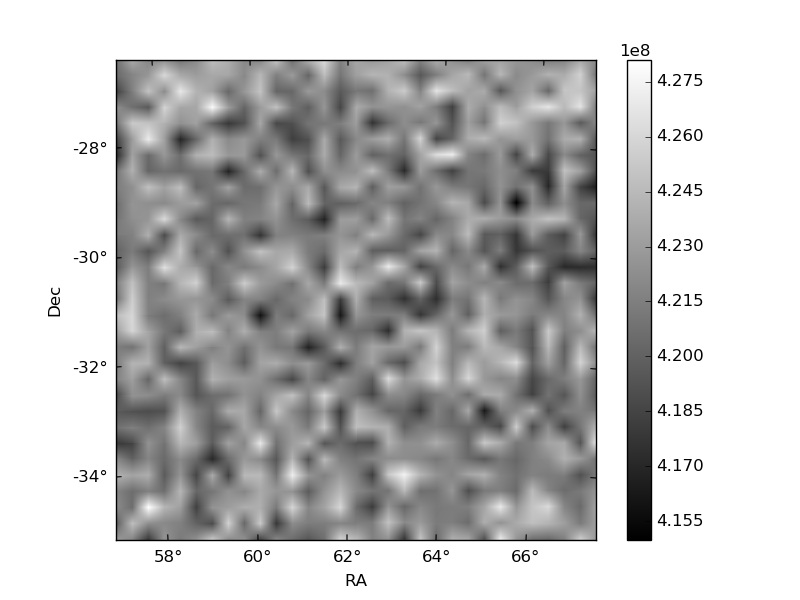
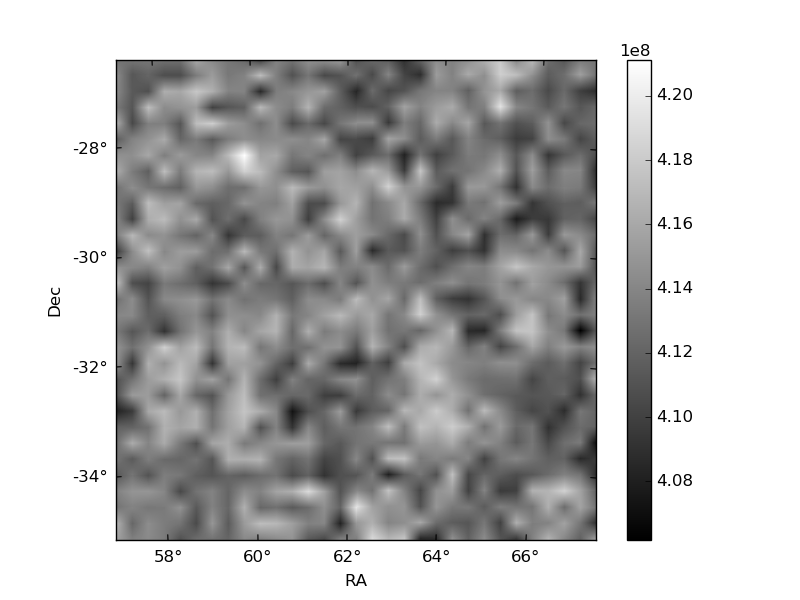
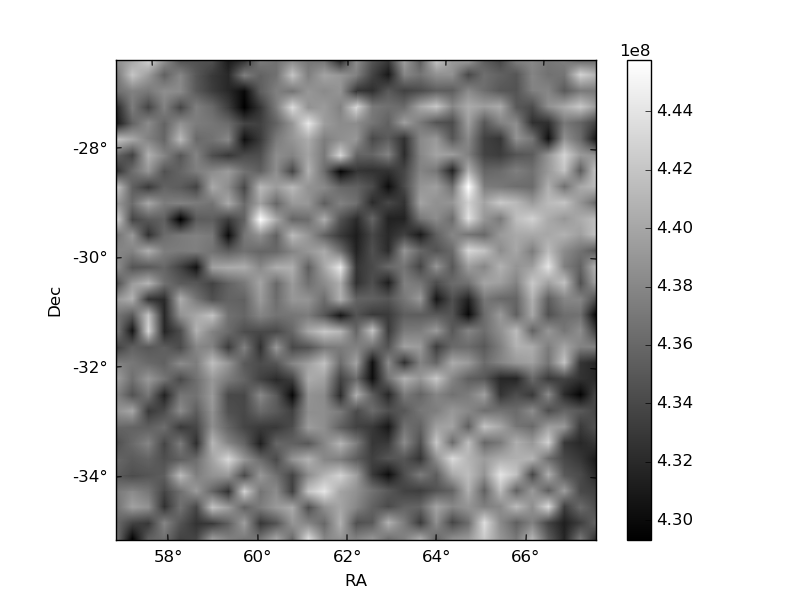
Histogram calculated using DETX and DETY for each event in the final _common_clean file
| Quadrant A | 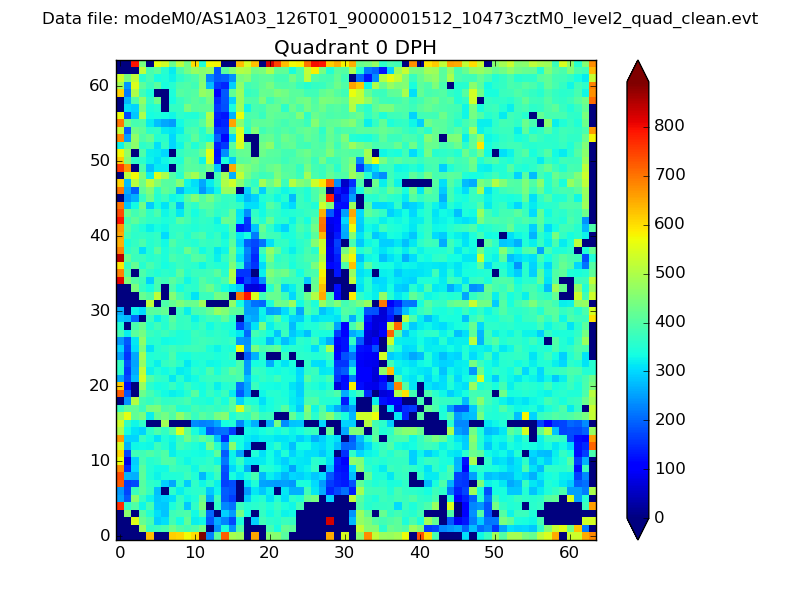 |
 |
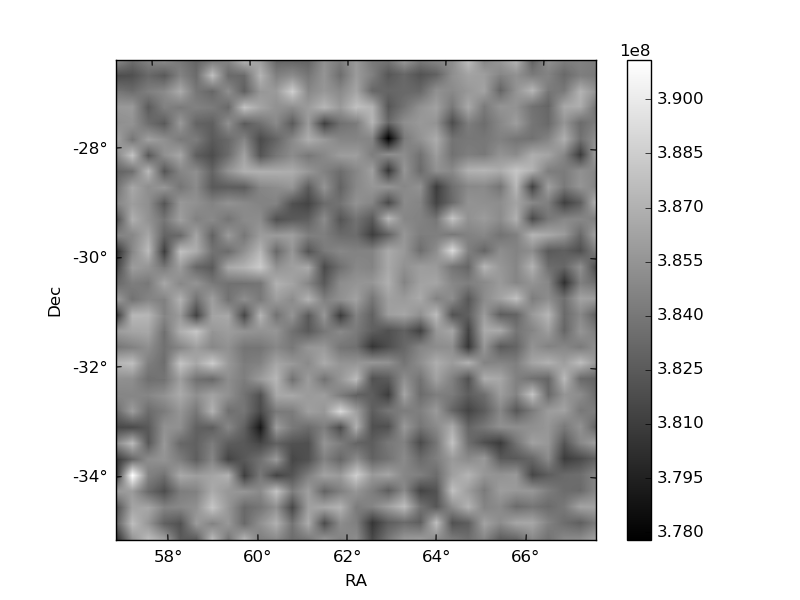
Quadrant B |
|---|---|---|---|
| Quadrant D | 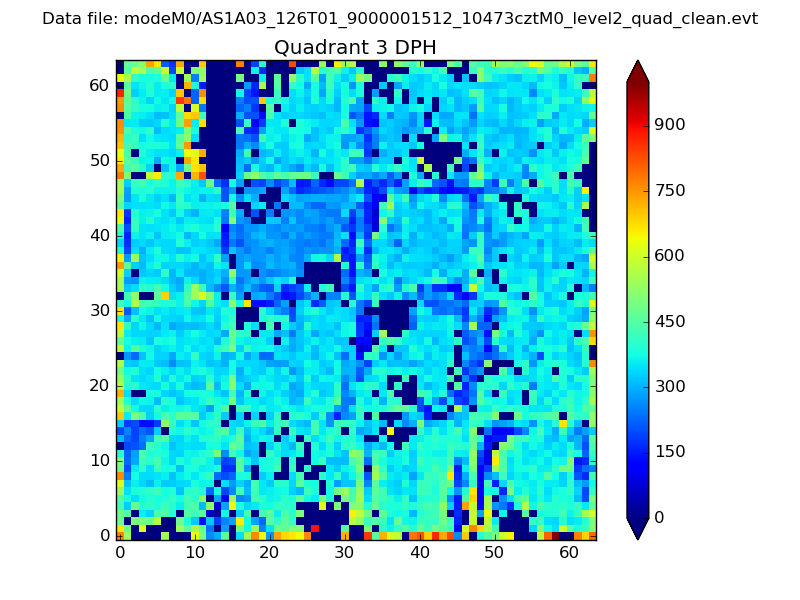 |
 |
Quadrant C |
| Plot type | Count rate plots | Images |
|---|---|---|
| Comparison with Poisson distribution Blue bars denote a histogram of data divided into 1 sec bins. Red curve is a Poisson curve with rate = median count rate of data. |
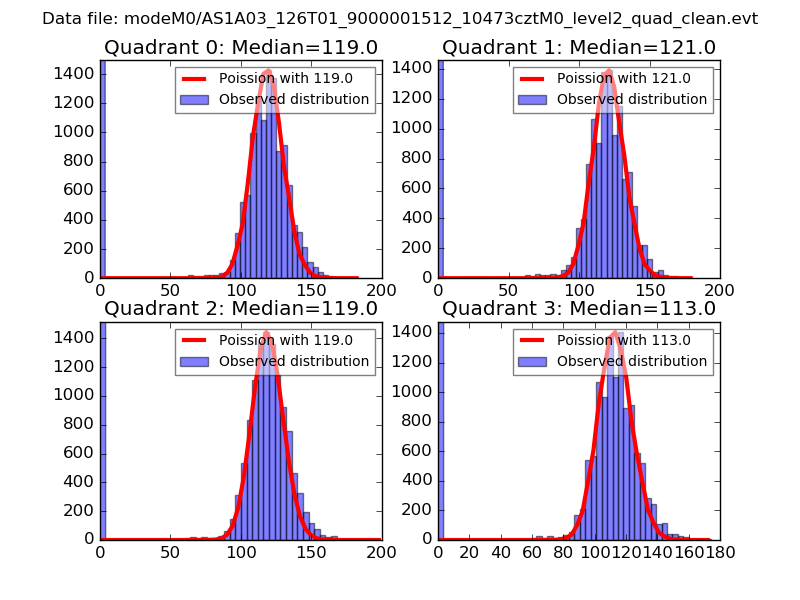 |
 |
| Quadrant-wise count rates Data is divided into 100 sec bins |
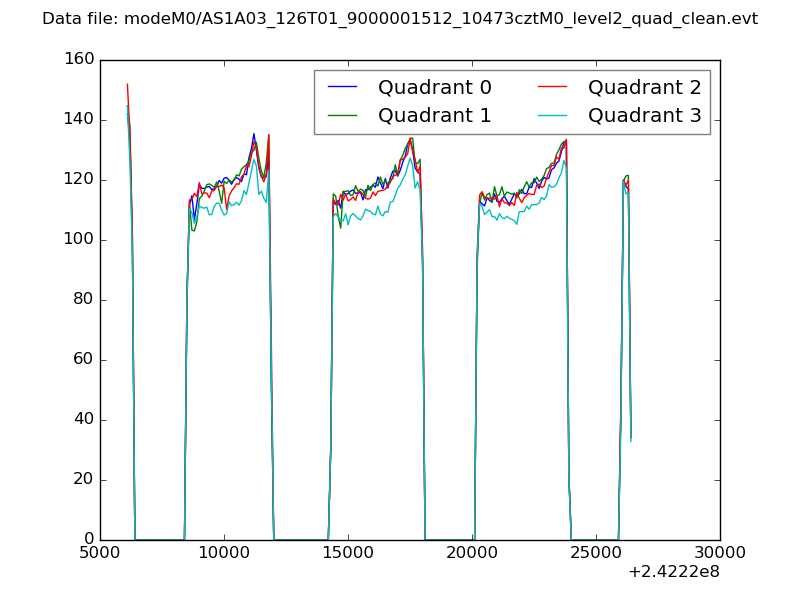 |
|
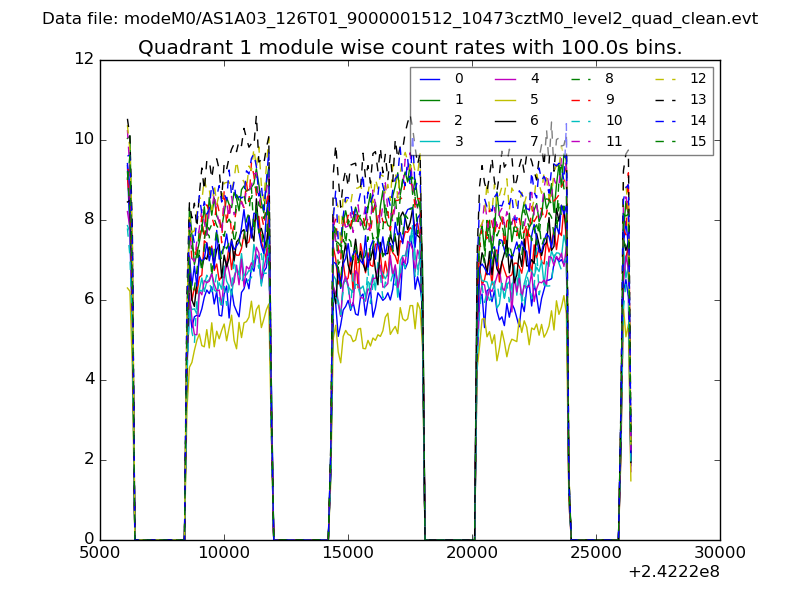
| Module-wise count rates for Quadrant A Data is divided into 100 sec bins |
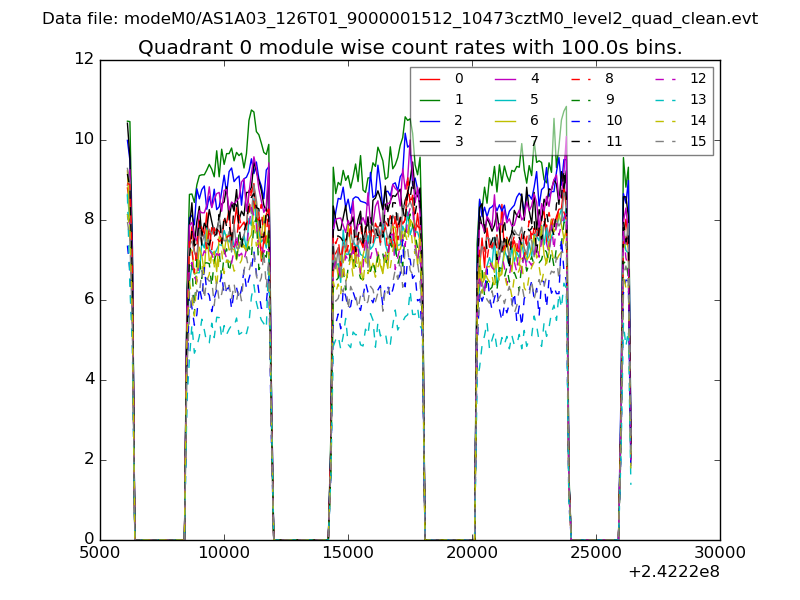 |
 |
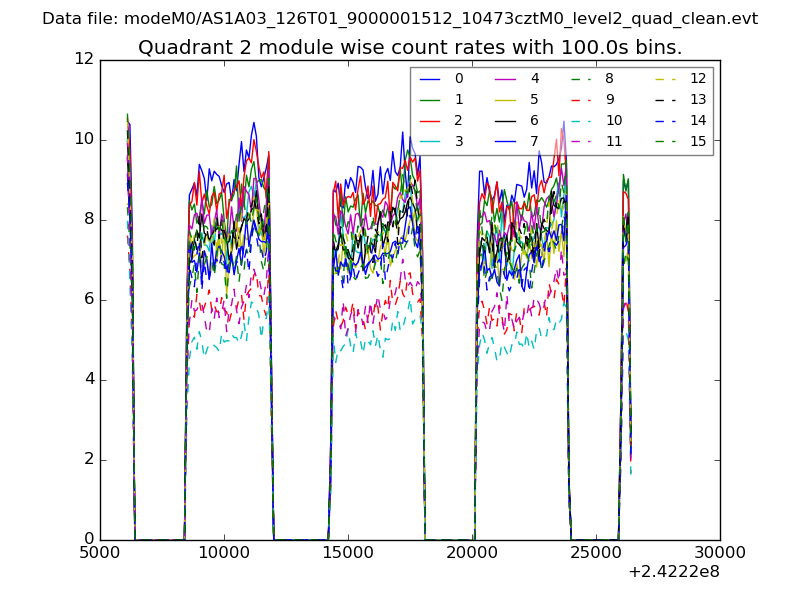
| Module-wise count rates for Quadrant B Data is divided into 100 sec bins |
 |
 |
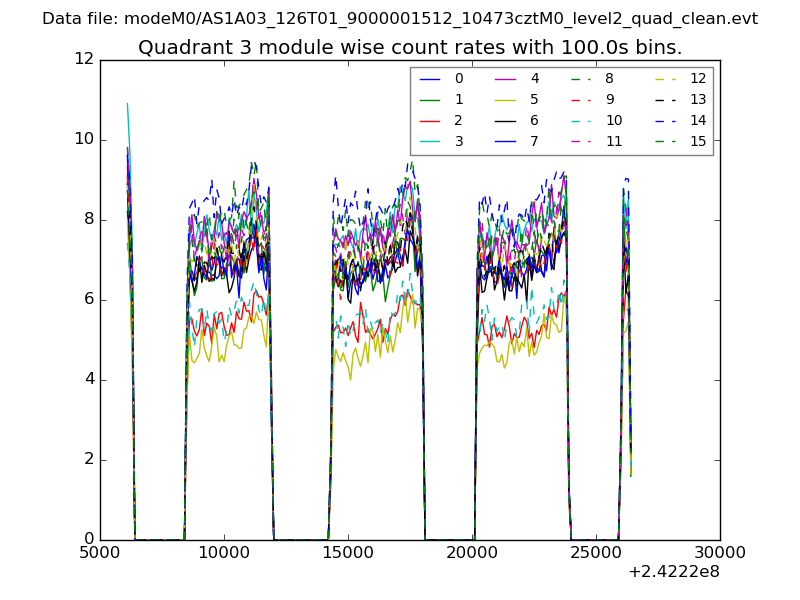
| Module-wise count rates for Quadrant C Data is divided into 100 sec bins |
 |
 |
| Module-wise count rates for Quadrant D Data is divided into 100 sec bins |
 |
 |
| Parameter | Plot |
|---|---|
| CZT HV Monitor | 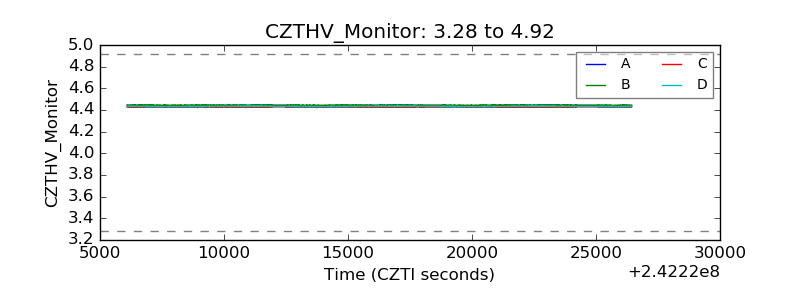 |
| D_VDD | 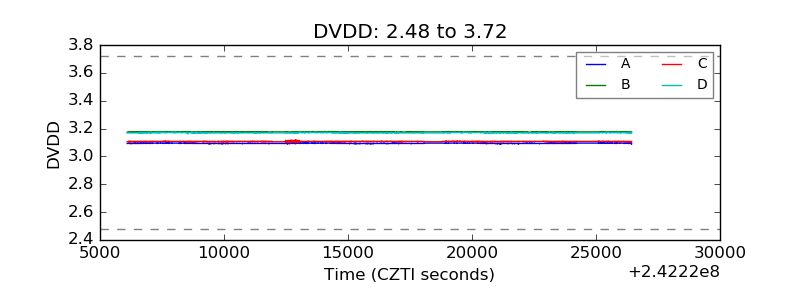 |
| Temperature 1 | 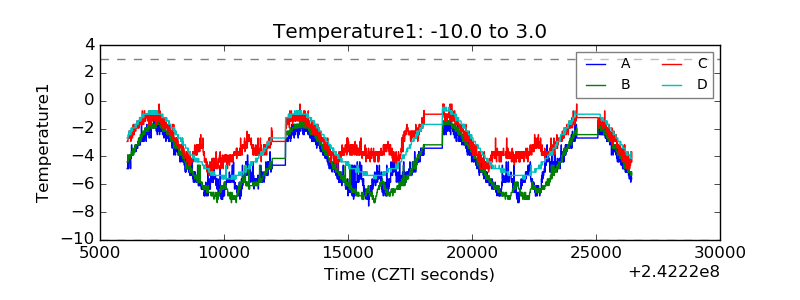 |
| Veto HV Monitor | 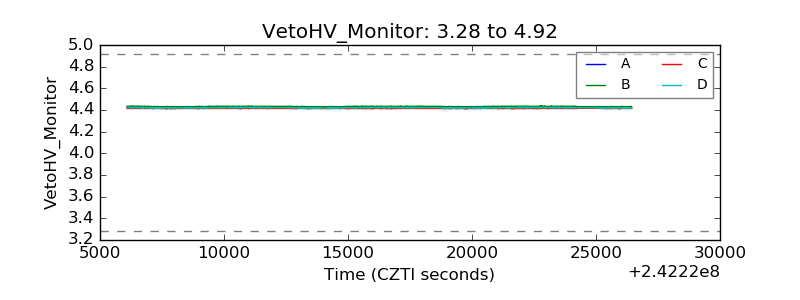 |
| Veto LLD | 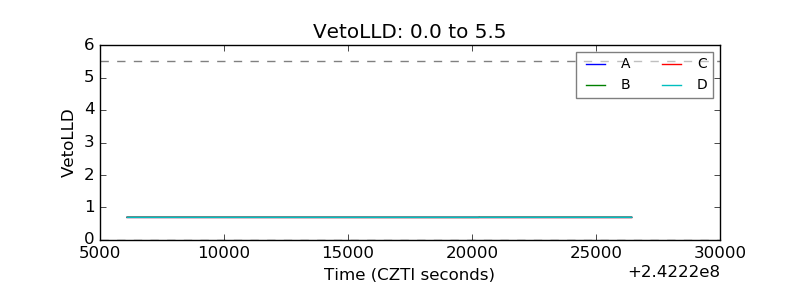 |
| Alpha Counter | 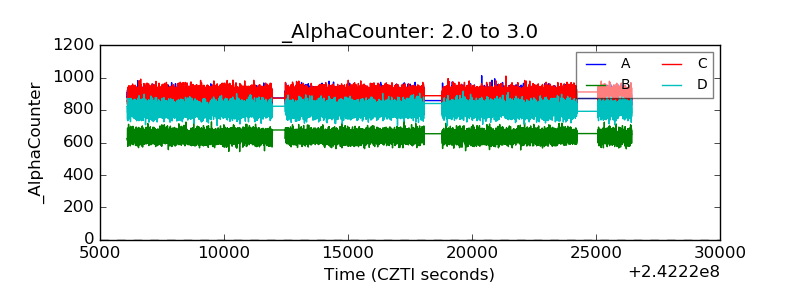 |
| _CPM_Rate | 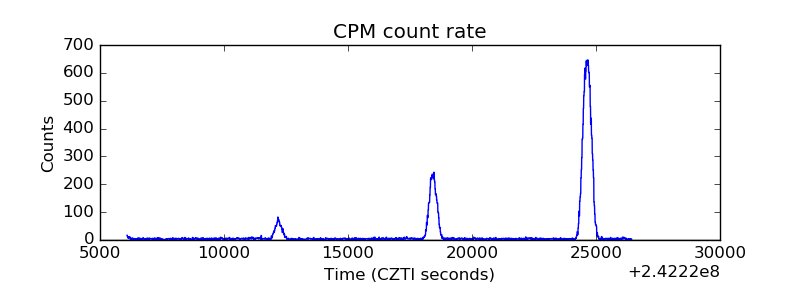 |
| CZT Counter | 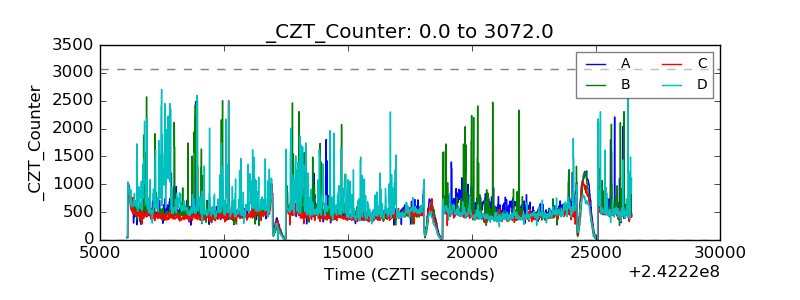 |
| +2.5 Volts monitor | 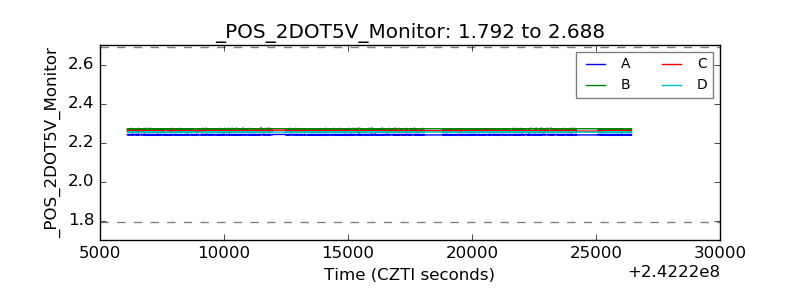 |
| +5 Volts monitor | 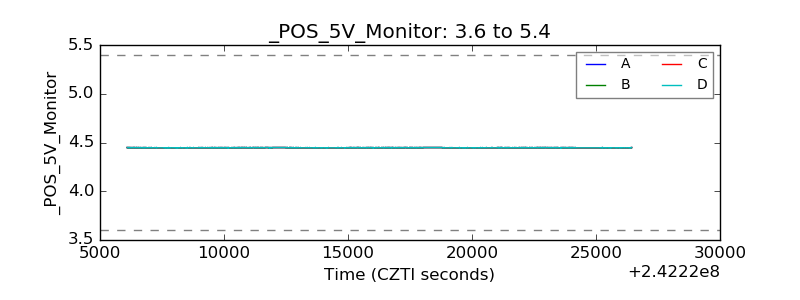 |
| _ROLL_ROT |  |
| _Roll_DEC | 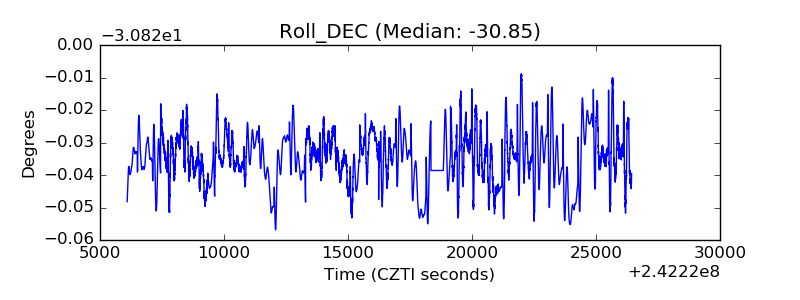 |
| _Roll_RA | 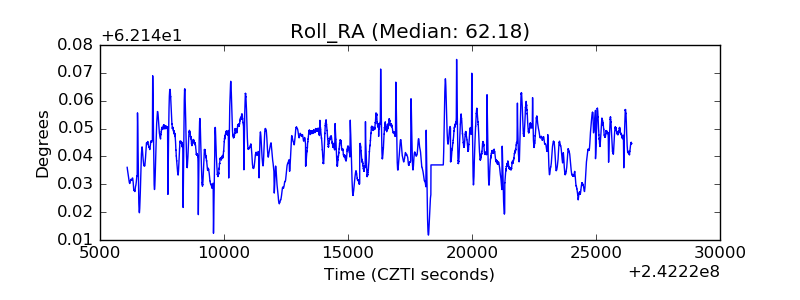 |
| Veto Counter | 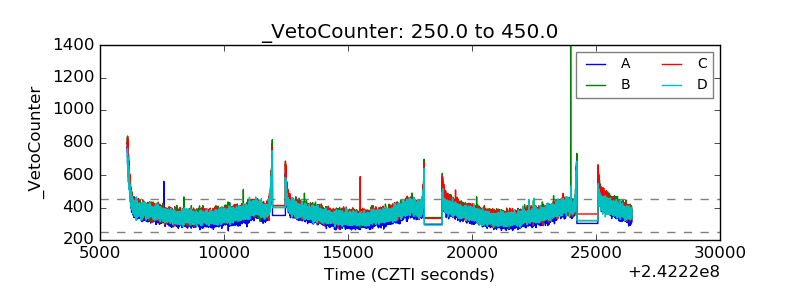 |