| Param | Original file | Final file |
|---|---|---|
| Filename | modeM0/AS1A03_126T01_9000001512_10477cztM0_level2.evt | modeM0/AS1A03_126T01_9000001512_10477cztM0_level2_quad_clean.evt |
| Size (bytes) | 408,456,000 | 86,967,360 |
| Size | 389.5 MB | 82.9 MB |
| Events in quadrant A | 2,776,900 | 554,563 |
| Events in quadrant B | 3,076,217 | 551,289 |
| Events in quadrant C | 2,633,675 | 565,344 |
| Events in quadrant D | 3,504,506 | 573,678 |
| Mode SS | |||
|---|---|---|---|
| Quadrant | BADHDUFLAG | Total packets | Discarded packets |
| A | 0 | 244 | 118 |
| B | 0 | 244 | 120 |
| C | 0 | 244 | 118 |
| D | 0 | 234 | 110 |
| Mode M0 | |||
|---|---|---|---|
| Quadrant | BADHDUFLAG | Total packets | Discarded packets |
| A | 0 | 24832 | 13101 |
| B | 0 | 27525 | 14945 |
| C | 0 | 24353 | 12983 |
| D | 0 | 28304 | 13907 |
| Mode M9 | |||
|---|---|---|---|
| Quadrant | BADHDUFLAG | Total packets | Discarded packets |
| A | 0 | 33 | 10 |
| B | 0 | 35 | 12 |
| C | 0 | 33 | 12 |
| D | 0 | 32 | 9 |
| Quadrant | Total seconds | Saturated seconds | Saturation percentage |
|---|---|---|---|
| A | 5420 | 29 | 0.535055% |
| B | 5310 | 155 | 2.919021% |
| C | 5524 | 12 | 0.217234% |
| D | 5908 | 68 | 1.150982% |
Noise dominated data is calculated using 1-second bins in cleaned event files. If a bin has >2000 counts, and if more than 50% of those come from <1% of pixels, then it is considered to be noise-dominated and hence unusable.
| Quadrant | # 1 sec bins | Bins with >0 counts | Bins with >2000 counts | High rate bins dominated by noise | Noise dominated (total time) | Noise dominated (detector-on time) | Marked lightcurve |
|---|---|---|---|---|---|---|---|
| A | 8804 | 6229 | 0 | 0 | 0.00% | 0.00% | 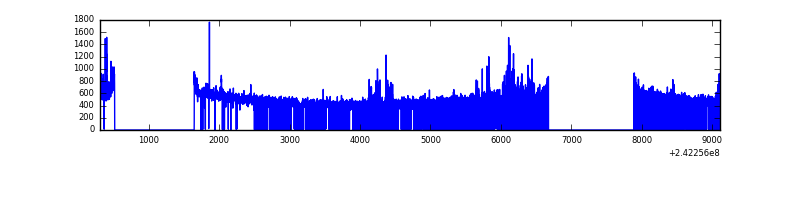 |
| B | 8802 | 6120 | 48 | 48 | 0.55% | 0.78% | 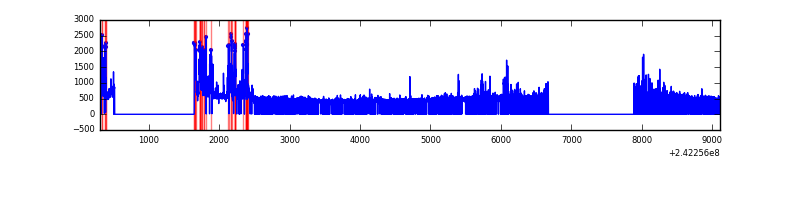 |
| C | 8804 | 6271 | 0 | 0 | 0.00% | 0.00% | 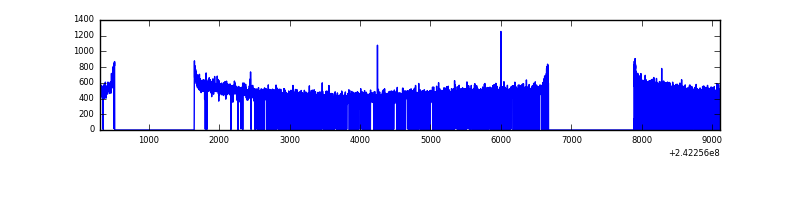 |
| D | 8804 | 6274 | 23 | 23 | 0.26% | 0.37% | 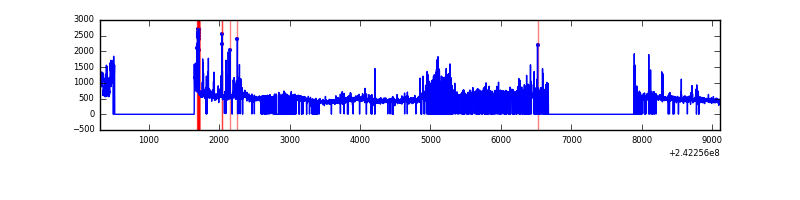 |
Top three noisy pixels from each quadrant. If the there are fewer than three noisy pixels in the level2.evt file, extra rows are filled as -1
| Pixel properties | Quadrant properties | ||||||
|---|---|---|---|---|---|---|---|
| Quadrant | DetID | PixID | Counts | Sigma | Mean | Median | Sigma |
| A | 5 | 16 | 101994 | 740.6 | 669 | 654 | 136.8 |
| A | 3 | 80 | 53015 | 382.66 | 669 | 654 | 136.8 |
| A | 8 | 5 | 32832 | 235.16 | 669 | 654 | 136.8 |
| B | 4 | 239 | 382065 | 3055.1 | 658 | 641 | 124.8 |
| B | 0 | 187 | 37350 | 294.03 | 658 | 641 | 124.8 |
| B | 11 | 51 | 37265 | 293.35 | 658 | 641 | 124.8 |
| C | 13 | 61 | 4980 | 27.5 | 673 | 678 | 156.5 |
| C | 14 | 67 | 3308 | 16.81 | 673 | 678 | 156.5 |
| C | 8 | 222 | 2820 | 13.69 | 673 | 678 | 156.5 |
| D | 1 | 20 | 427285 | 2524.08 | 704 | 684 | 169.0 |
| D | 8 | 195 | 158377 | 933.03 | 704 | 684 | 169.0 |
| D | 12 | 233 | 89386 | 524.82 | 704 | 684 | 169.0 |
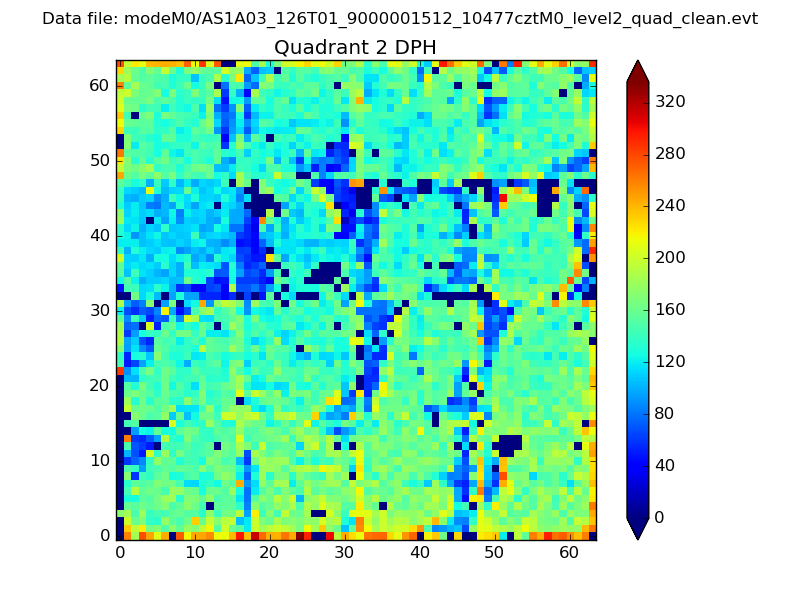
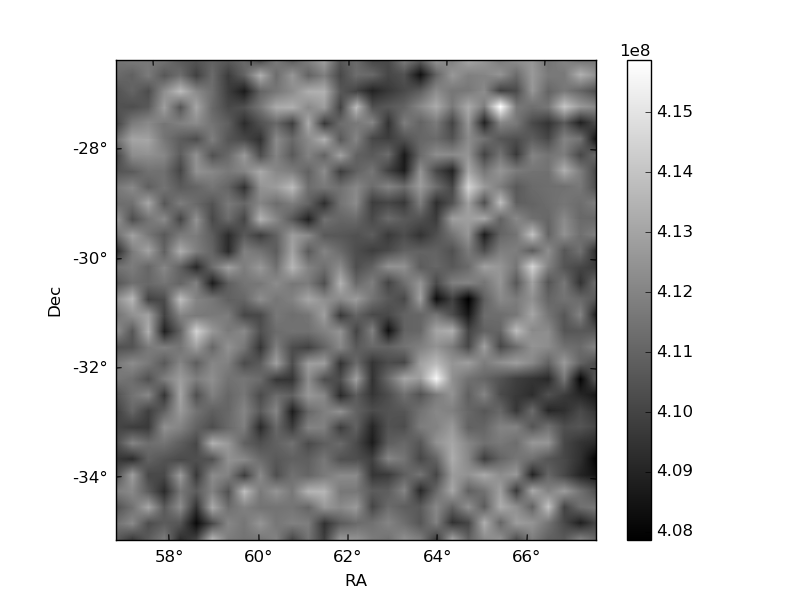
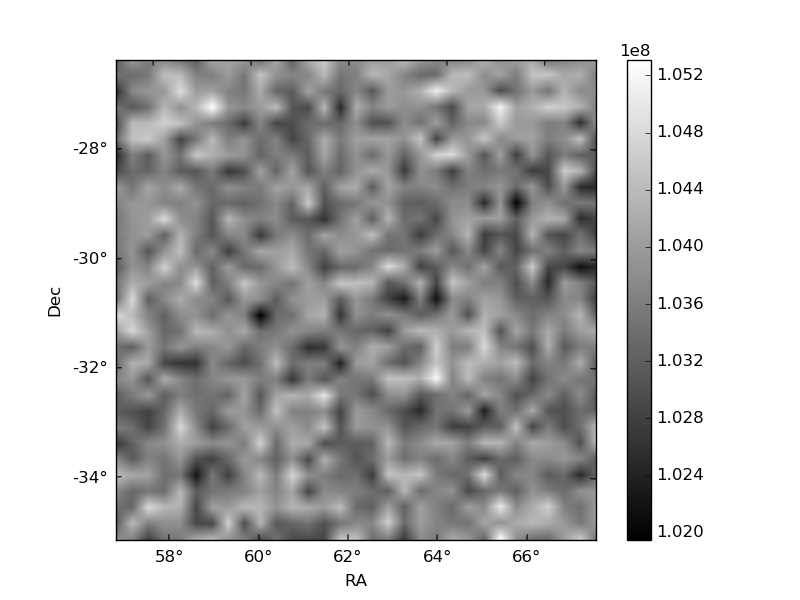
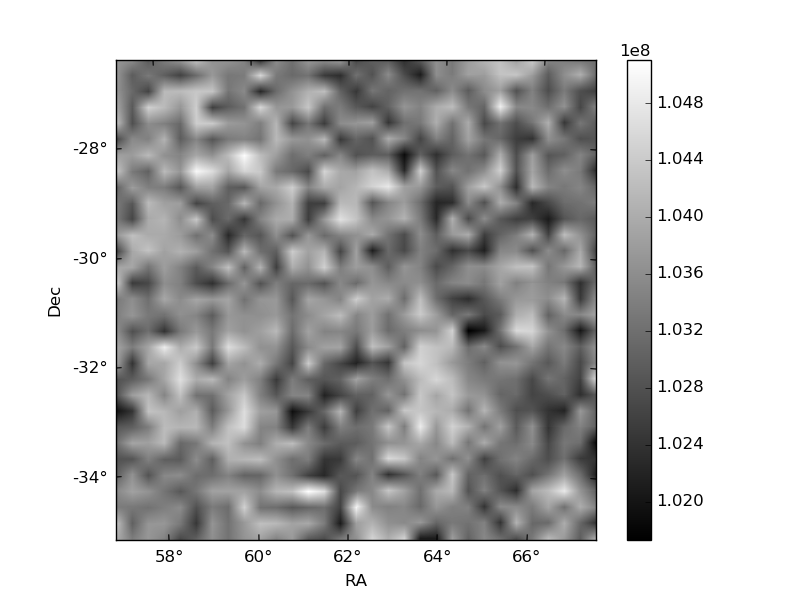
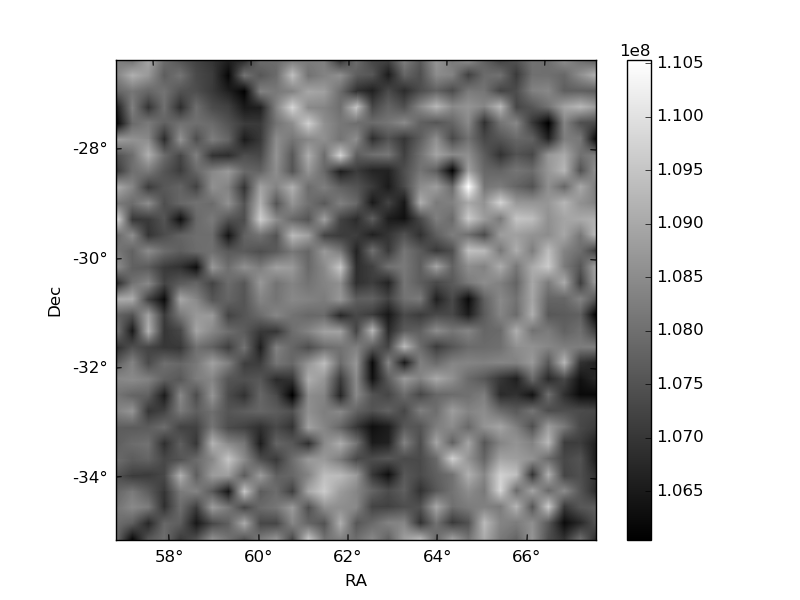
Histogram calculated using DETX and DETY for each event in the final _common_clean file
| Quadrant A | 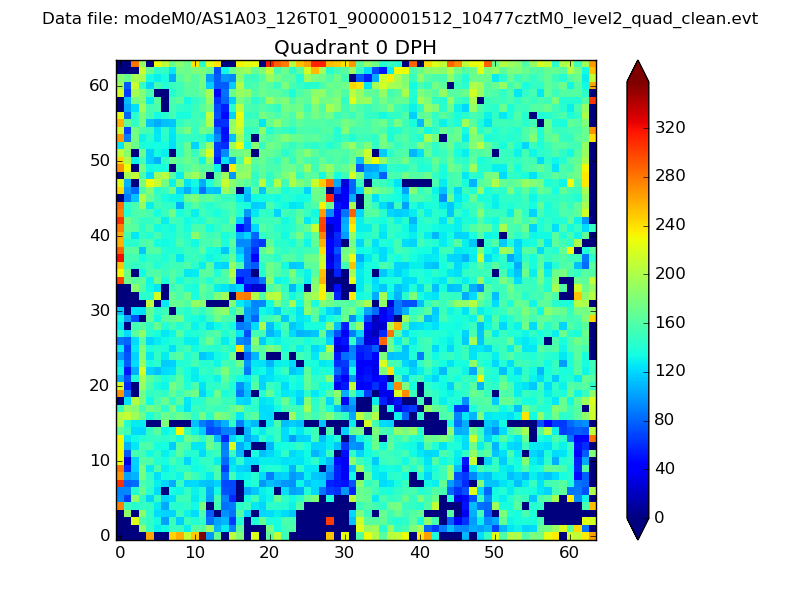 |
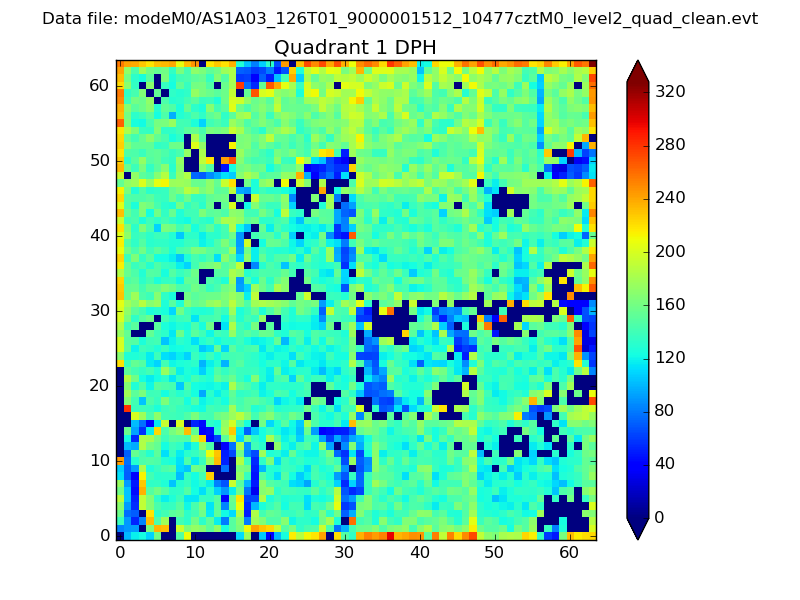 |
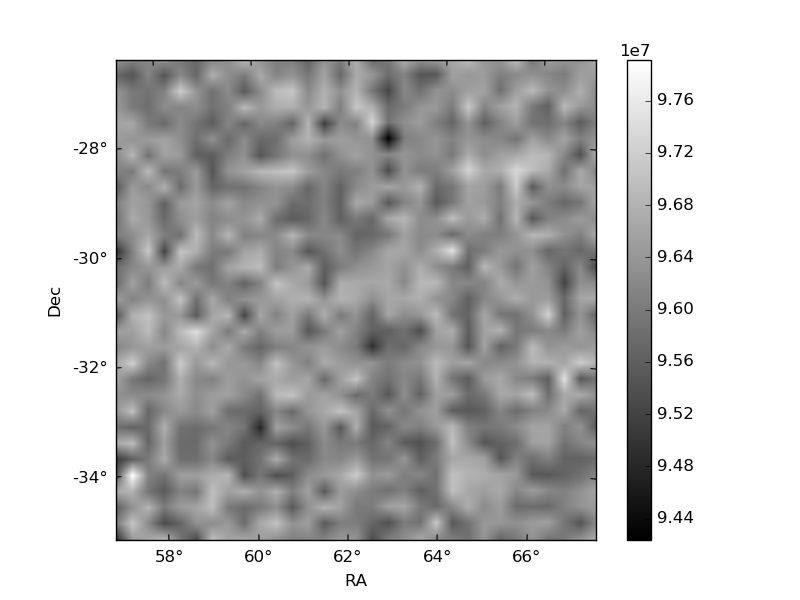
Quadrant B |
|---|---|---|---|
| Quadrant D | 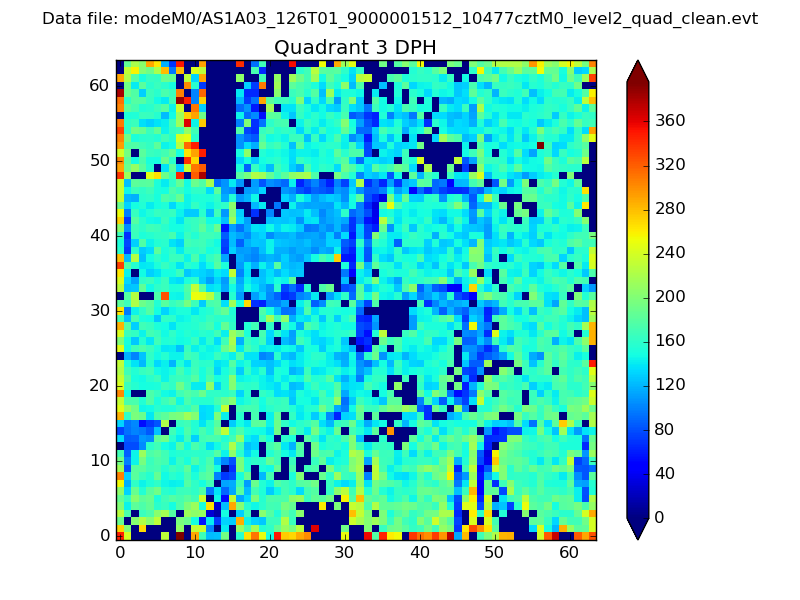 |
 |
Quadrant C |
| Plot type | Count rate plots | Images |
|---|---|---|
| Comparison with Poisson distribution Blue bars denote a histogram of data divided into 1 sec bins. Red curve is a Poisson curve with rate = median count rate of data. |
 |
 |
| Quadrant-wise count rates Data is divided into 100 sec bins |
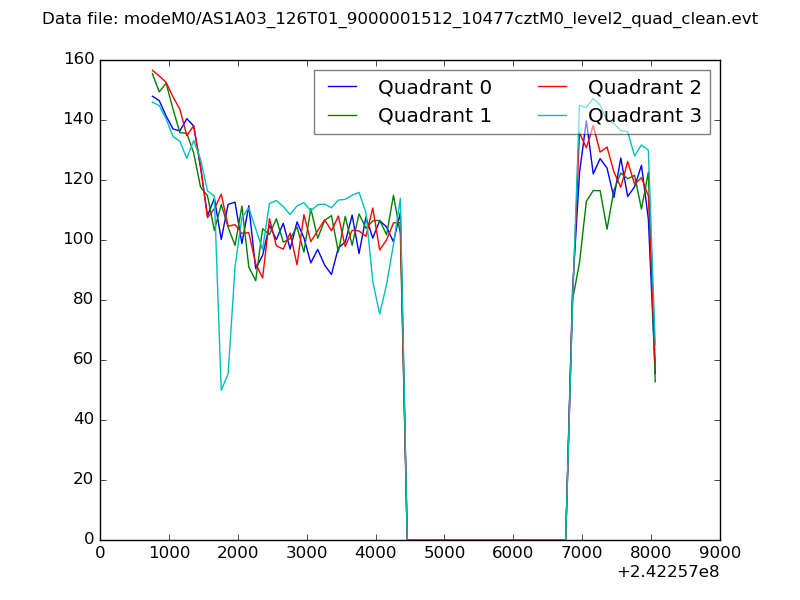 |
|
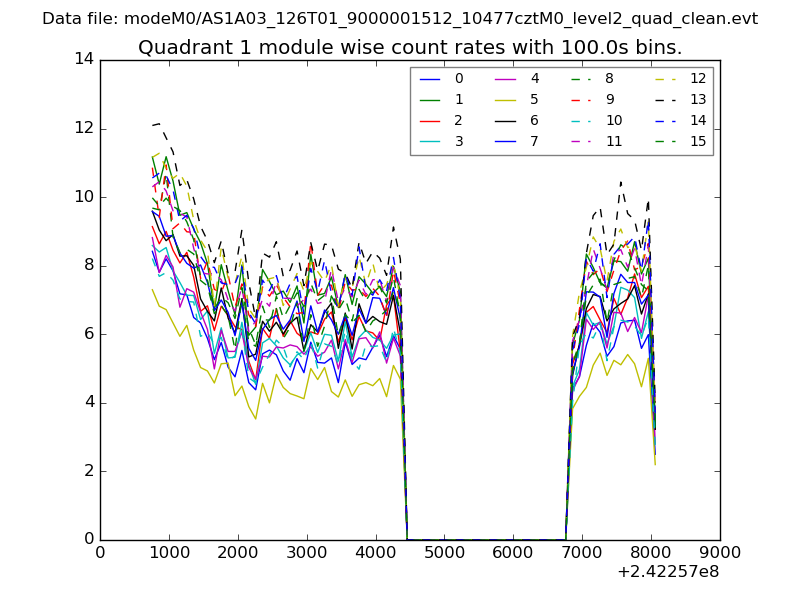
| Module-wise count rates for Quadrant A Data is divided into 100 sec bins |
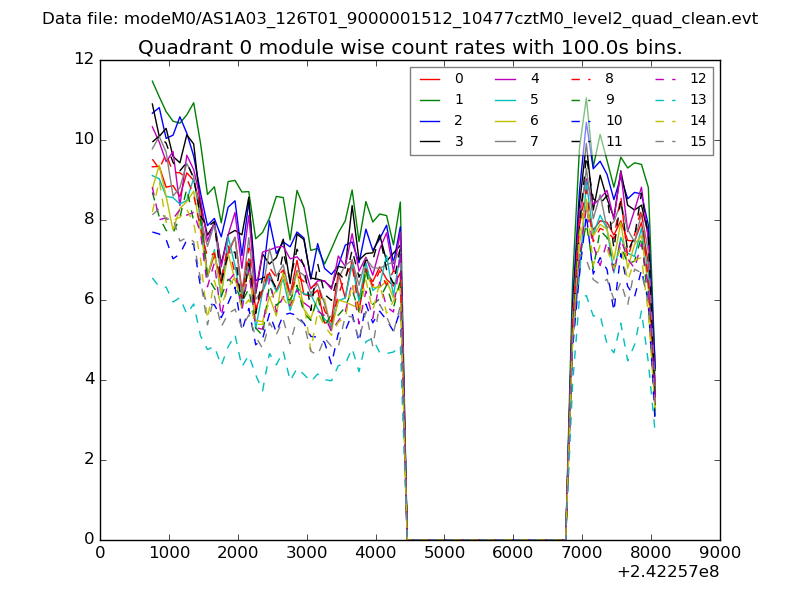 |
 |
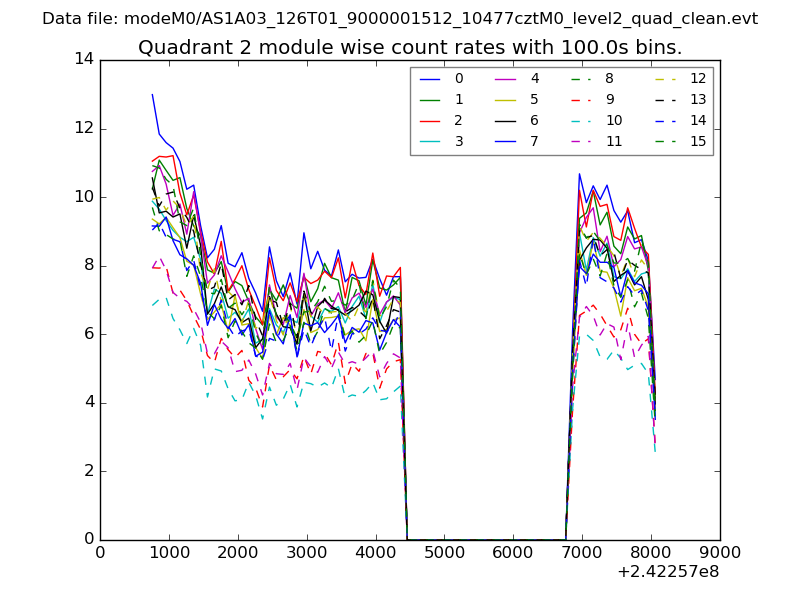
| Module-wise count rates for Quadrant B Data is divided into 100 sec bins |
 |
 |
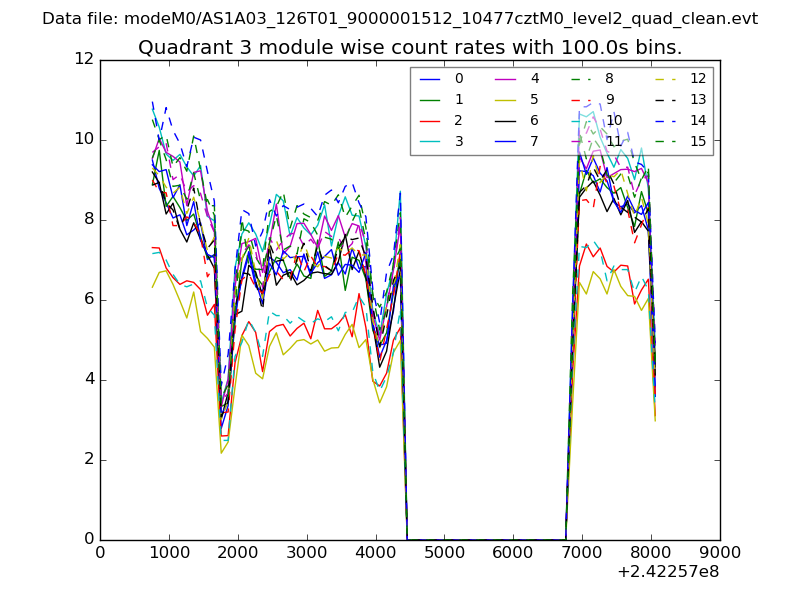
| Module-wise count rates for Quadrant C Data is divided into 100 sec bins |
 |
 |
| Module-wise count rates for Quadrant D Data is divided into 100 sec bins |
 |
 |
| Parameter | Plot |
|---|---|
| CZT HV Monitor | 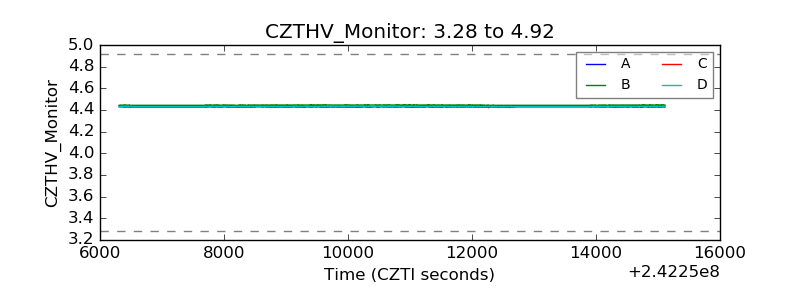 |
| D_VDD | 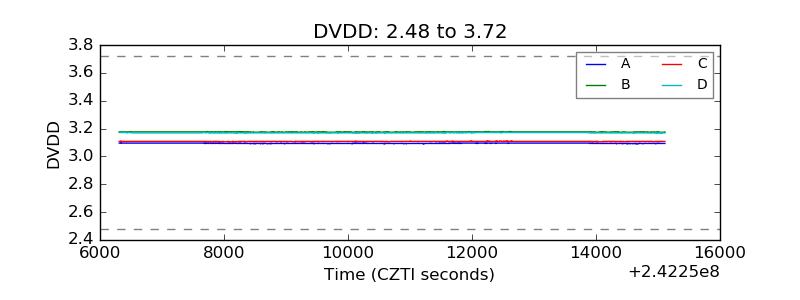 |
| Temperature 1 | 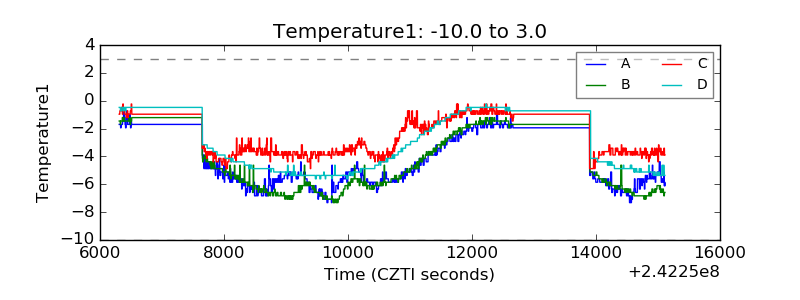 |
| Veto HV Monitor | 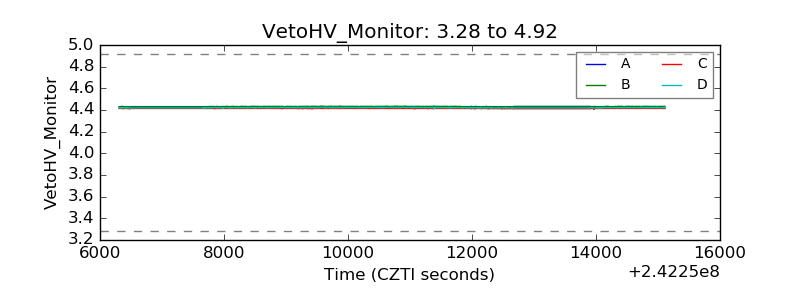 |
| Veto LLD | 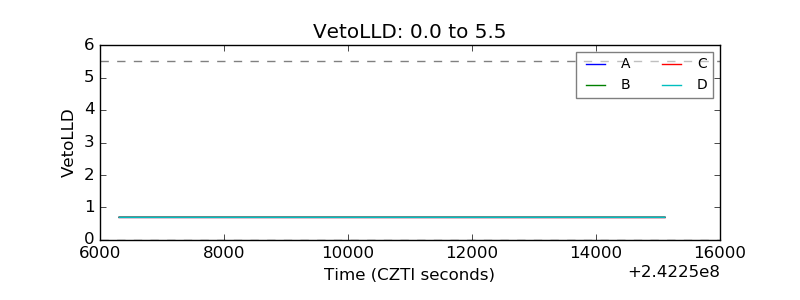 |
| Alpha Counter | 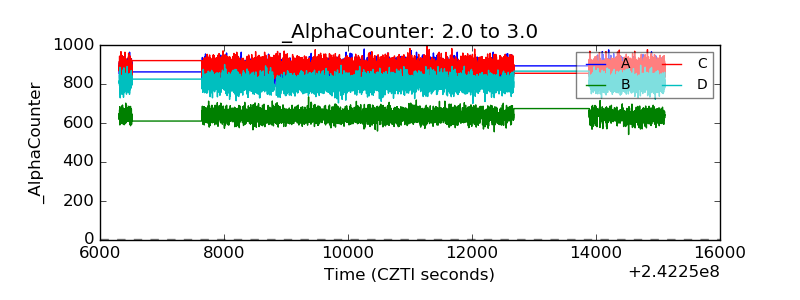 |
| _CPM_Rate | 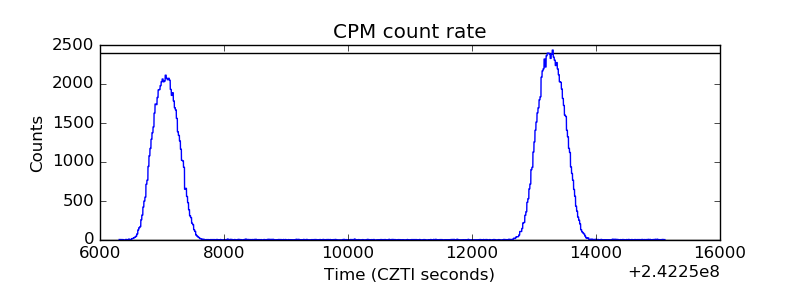 |
| CZT Counter | 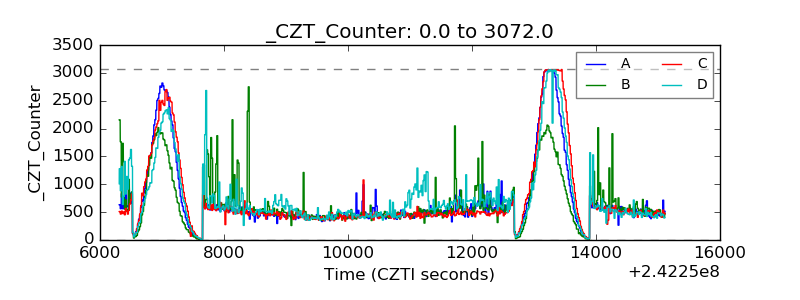 |
| +2.5 Volts monitor |  |
| +5 Volts monitor |  |
| _ROLL_ROT | 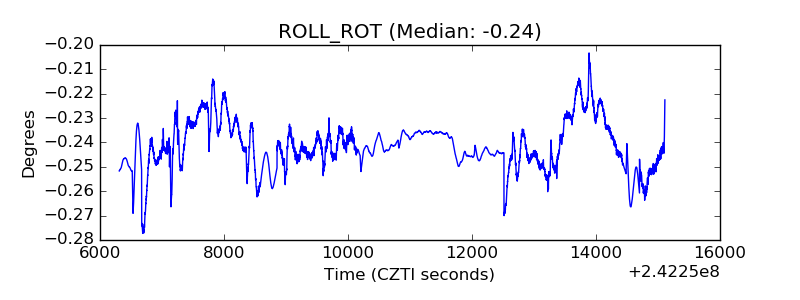 |
| _Roll_DEC | 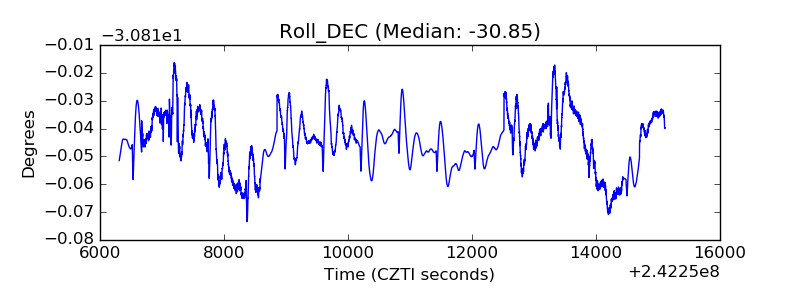 |
| _Roll_RA | 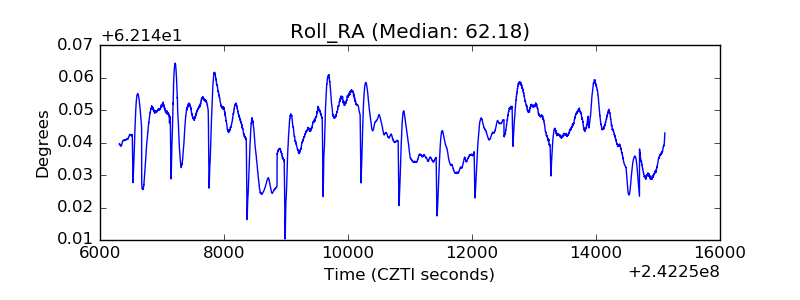 |
| Veto Counter | 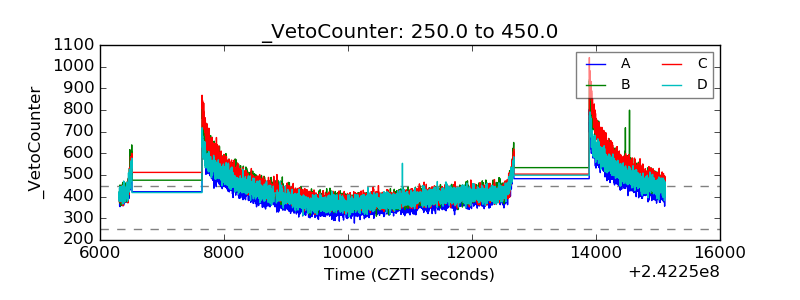 |