| Param | Original file | Final file |
|---|---|---|
| Filename | modeM0/AS1A03_126T01_9000001512_10479cztM0_level2.evt | modeM0/AS1A03_126T01_9000001512_10479cztM0_level2_quad_clean.evt |
| Size (bytes) | 523,820,160 | 125,449,920 |
| Size | 499.6 MB | 119.6 MB |
| Events in quadrant A | 3,869,783 | 800,190 |
| Events in quadrant B | 3,990,838 | 818,421 |
| Events in quadrant C | 3,613,228 | 817,504 |
| Events in quadrant D | 3,865,087 | 826,169 |
| Mode SS | |||
|---|---|---|---|
| Quadrant | BADHDUFLAG | Total packets | Discarded packets |
| A | 0 | 230 | 72 |
| B | 0 | 230 | 69 |
| C | 0 | 230 | 66 |
| D | 0 | 222 | 64 |
| Mode M0 | |||
|---|---|---|---|
| Quadrant | BADHDUFLAG | Total packets | Discarded packets |
| A | 0 | 23559 | 7292 |
| B | 0 | 25555 | 8722 |
| C | 0 | 23574 | 7904 |
| D | 0 | 23510 | 6509 |
| Mode M9 | |||
|---|---|---|---|
| Quadrant | BADHDUFLAG | Total packets | Discarded packets |
| A | 0 | 21 | 6 |
| B | 0 | 22 | 7 |
| C | 0 | 22 | 7 |
| D | 0 | 22 | 6 |
| Quadrant | Total seconds | Saturated seconds | Saturation percentage |
|---|---|---|---|
| A | 7612 | 28 | 0.367840% |
| B | 7547 | 69 | 0.914271% |
| C | 7624 | 15 | 0.196747% |
| D | 8118 | 28 | 0.344913% |
Noise dominated data is calculated using 1-second bins in cleaned event files. If a bin has >2000 counts, and if more than 50% of those come from <1% of pixels, then it is considered to be noise-dominated and hence unusable.
| Quadrant | # 1 sec bins | Bins with >0 counts | Bins with >2000 counts | High rate bins dominated by noise | Noise dominated (total time) | Noise dominated (detector-on time) | Marked lightcurve |
|---|---|---|---|---|---|---|---|
| A | 9452 | 8049 | 0 | 0 | 0.00% | 0.00% | 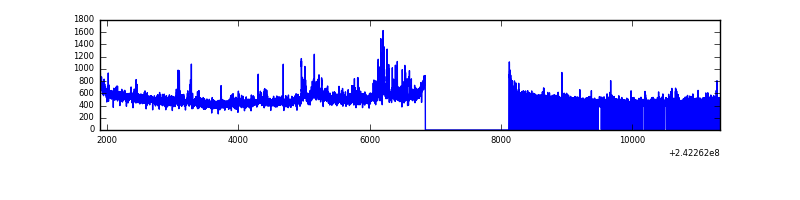 |
| B | 9453 | 7983 | 13 | 13 | 0.14% | 0.16% | 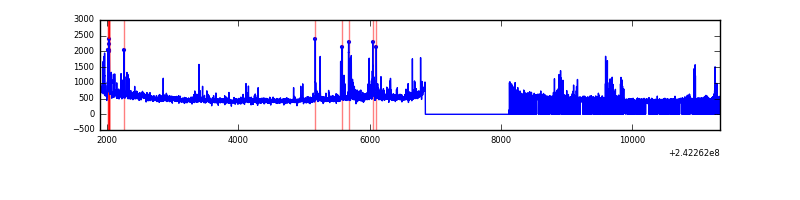 |
| C | 9453 | 8039 | 1 | 1 | 0.01% | 0.01% | 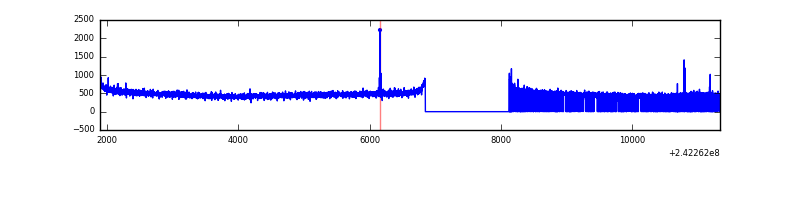 |
| D | 9453 | 8159 | 8 | 8 | 0.08% | 0.10% | 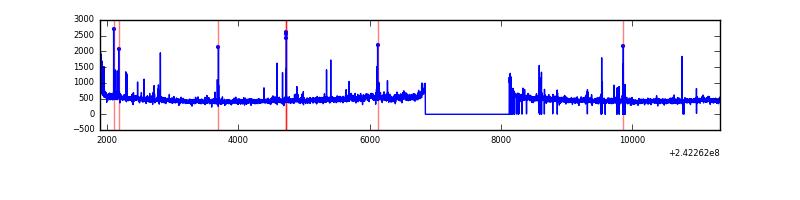 |
Top three noisy pixels from each quadrant. If the there are fewer than three noisy pixels in the level2.evt file, extra rows are filled as -1
| Pixel properties | Quadrant properties | ||||||
|---|---|---|---|---|---|---|---|
| Quadrant | DetID | PixID | Counts | Sigma | Mean | Median | Sigma |
| A | 5 | 16 | 155141 | 833.62 | 922 | 903 | 185.0 |
| A | 3 | 80 | 89466 | 478.66 | 922 | 903 | 185.0 |
| A | 13 | 251 | 44372 | 234.94 | 922 | 903 | 185.0 |
| B | 4 | 239 | 261581 | 1515.81 | 923 | 903 | 172.0 |
| B | 0 | 214 | 42347 | 240.99 | 923 | 903 | 172.0 |
| B | 0 | 187 | 41196 | 234.3 | 923 | 903 | 172.0 |
| C | 14 | 234 | 13489 | 59.07 | 922 | 931 | 212.6 |
| C | 13 | 61 | 6822 | 27.71 | 922 | 931 | 212.6 |
| C | 14 | 67 | 3611 | 12.61 | 922 | 931 | 212.6 |
| D | 8 | 195 | 85083 | 369.39 | 961 | 938 | 227.8 |
| D | 2 | 14 | 35571 | 152.04 | 961 | 938 | 227.8 |
| D | 2 | 234 | 30952 | 131.76 | 961 | 938 | 227.8 |
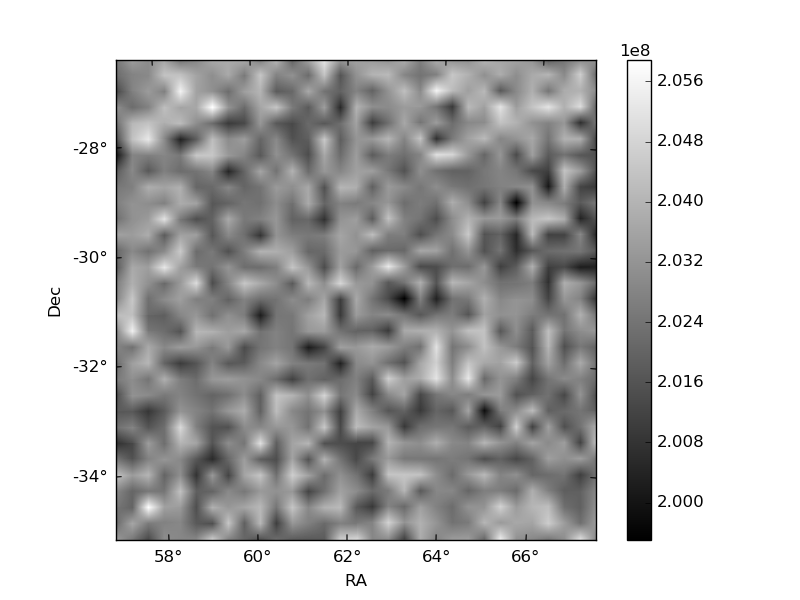
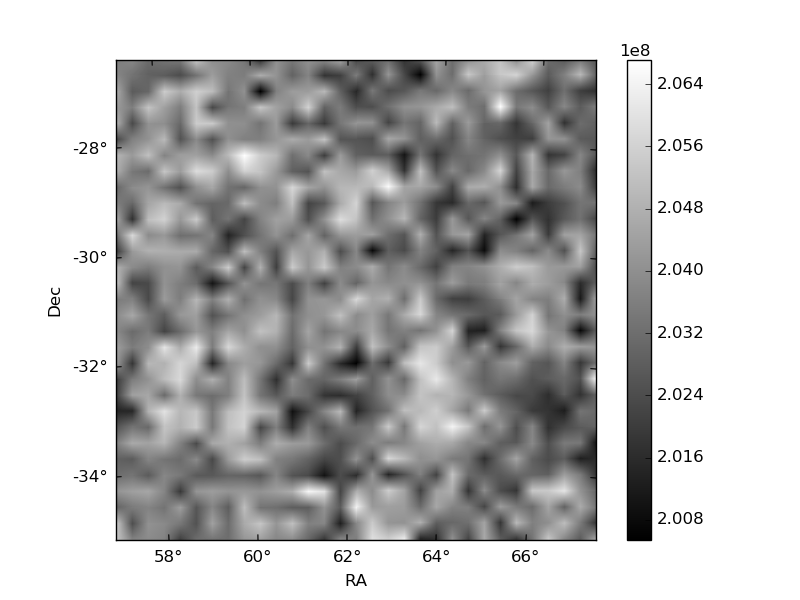
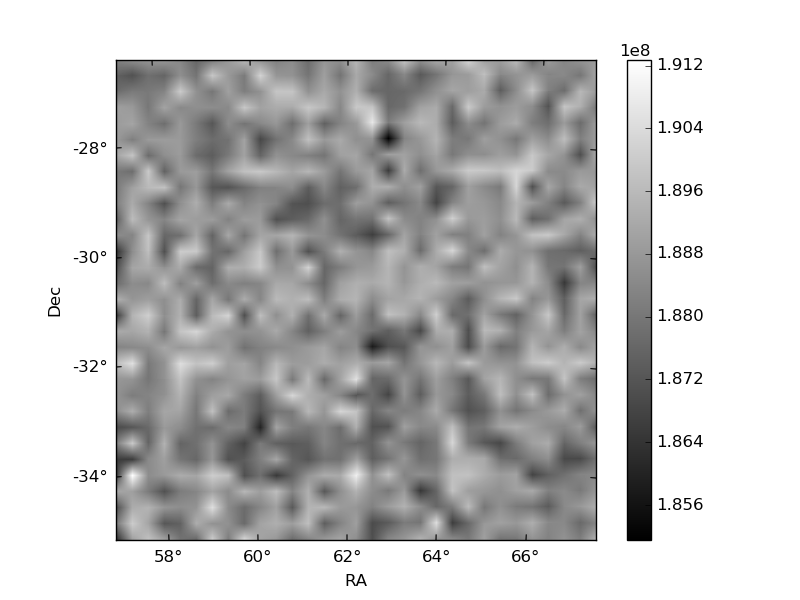
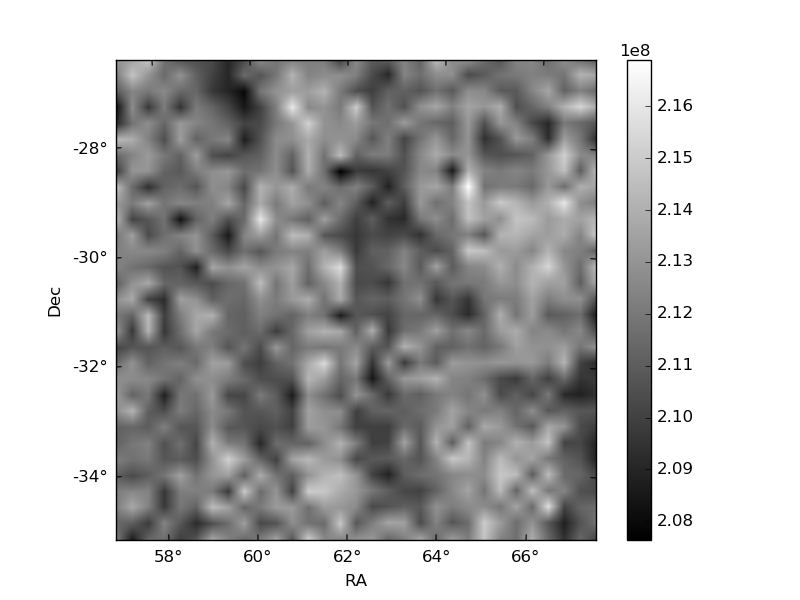
Histogram calculated using DETX and DETY for each event in the final _common_clean file
| Quadrant A | 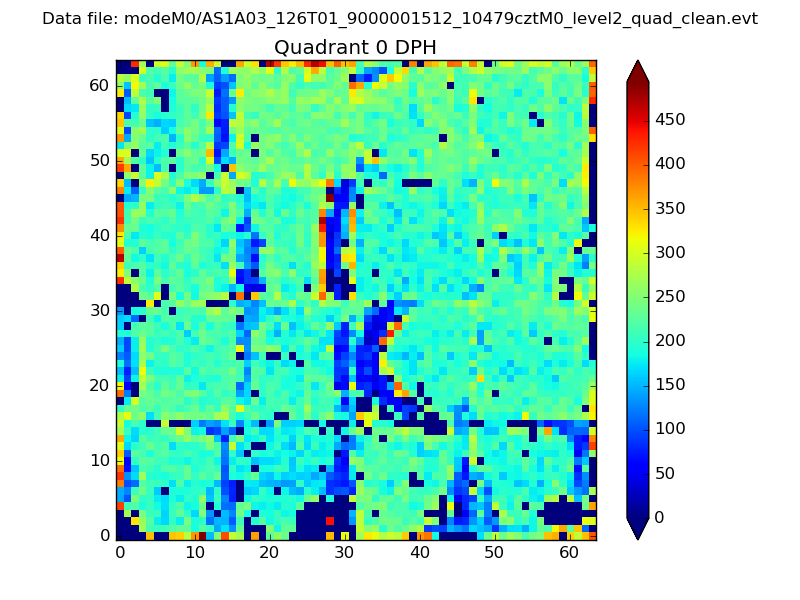 |
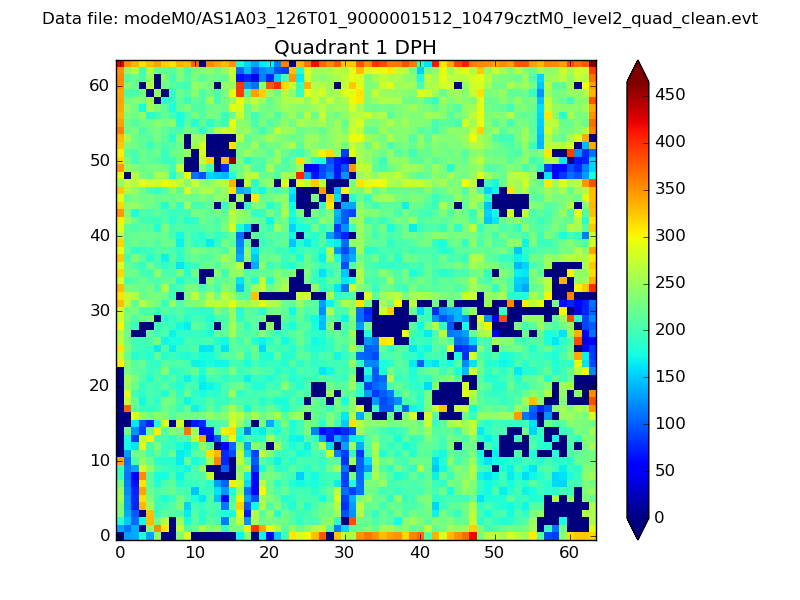 |
Quadrant B |
|---|---|---|---|
| Quadrant D | 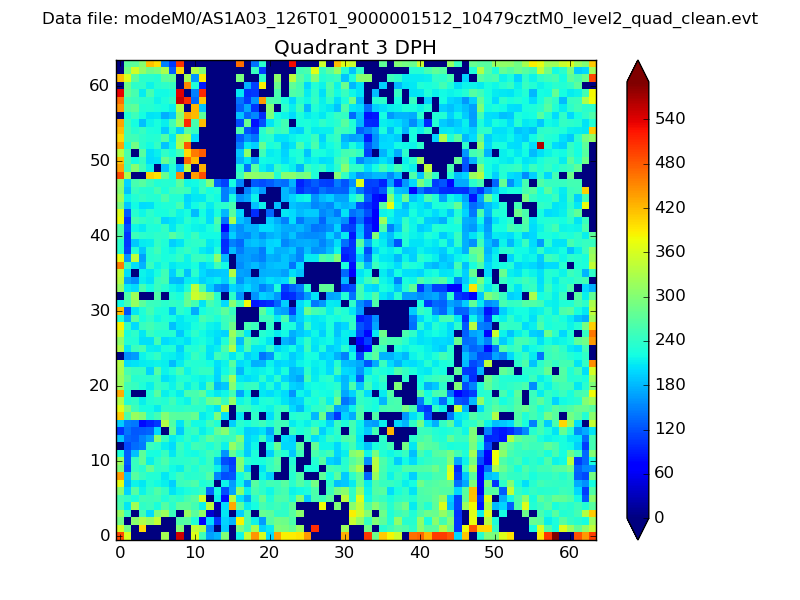 |
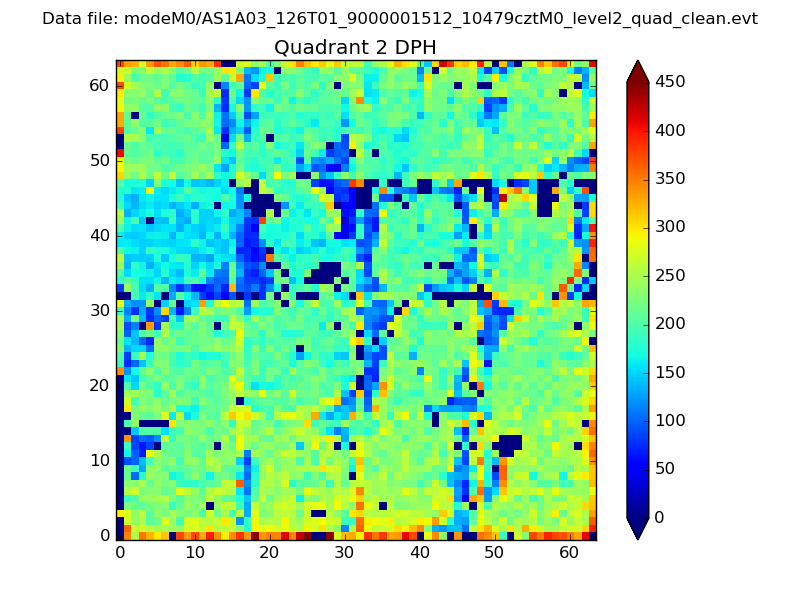 |
Quadrant C |
| Plot type | Count rate plots | Images |
|---|---|---|
| Comparison with Poisson distribution Blue bars denote a histogram of data divided into 1 sec bins. Red curve is a Poisson curve with rate = median count rate of data. |
 |
 |
| Quadrant-wise count rates Data is divided into 100 sec bins |
 |
|
| Module-wise count rates for Quadrant A Data is divided into 100 sec bins |
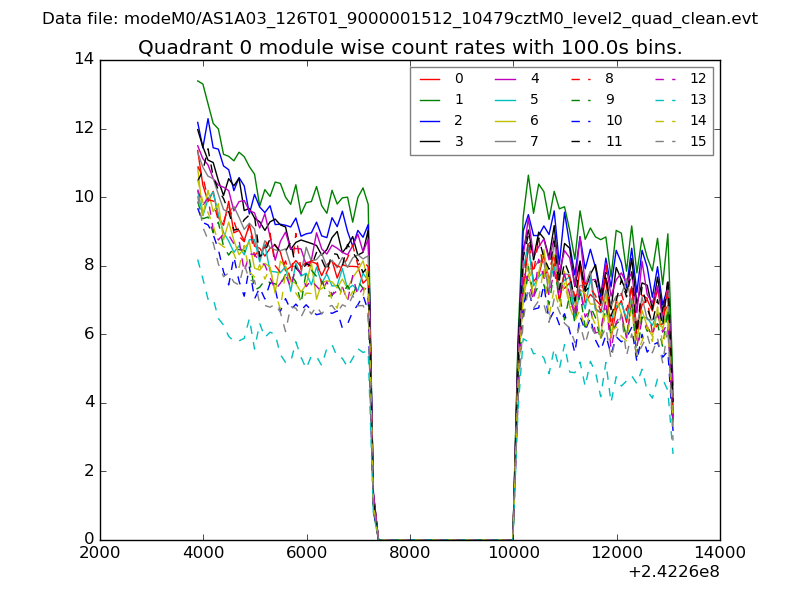 |
 |
| Module-wise count rates for Quadrant B Data is divided into 100 sec bins |
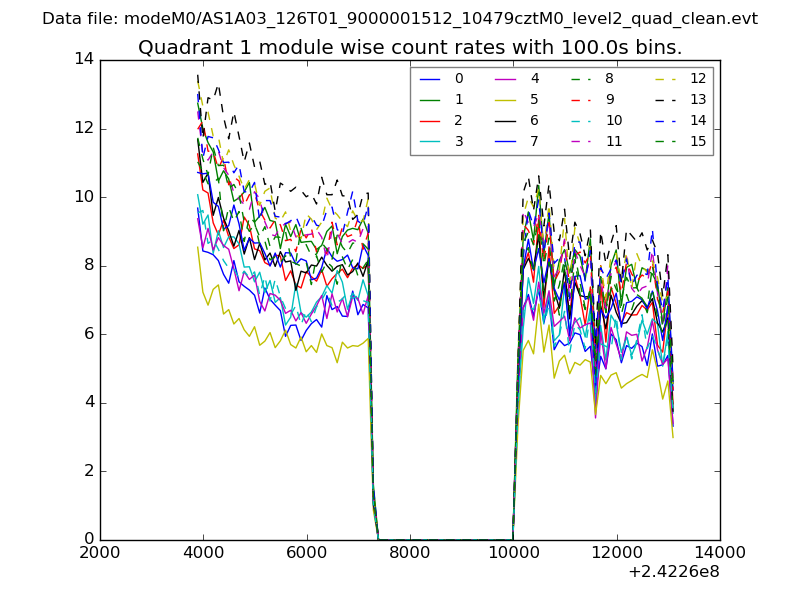 |
 |
| Module-wise count rates for Quadrant C Data is divided into 100 sec bins |
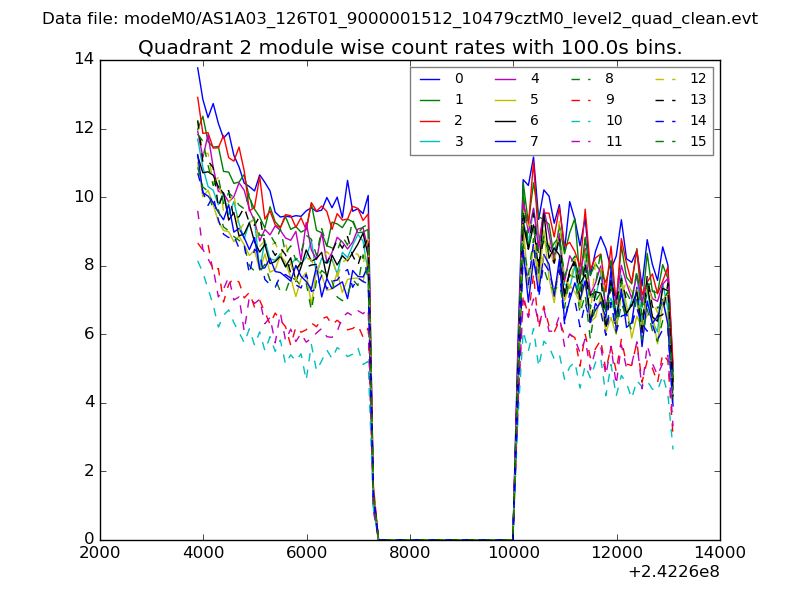 |
 |
| Module-wise count rates for Quadrant D Data is divided into 100 sec bins |
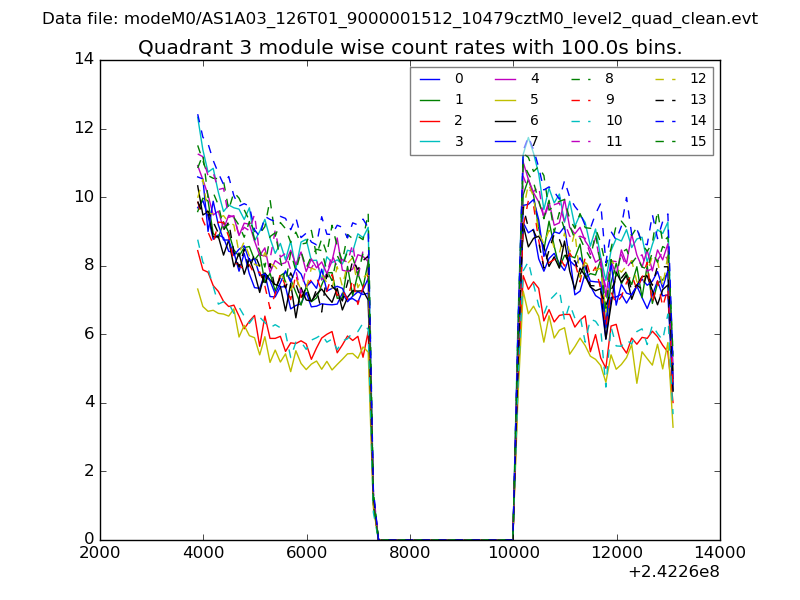 |
 |
| Parameter | Plot |
|---|---|
| CZT HV Monitor | 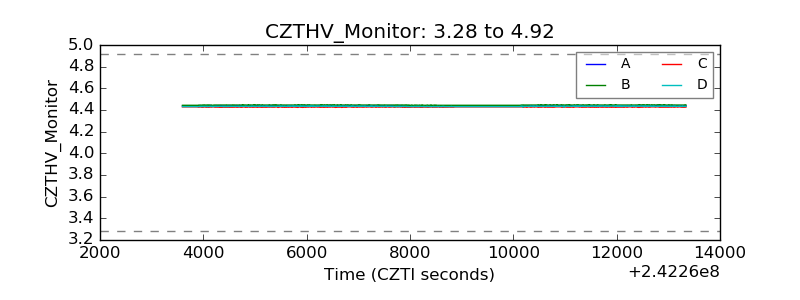 |
| D_VDD | 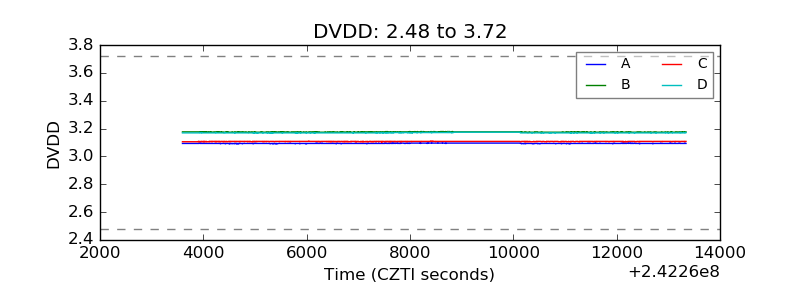 |
| Temperature 1 | 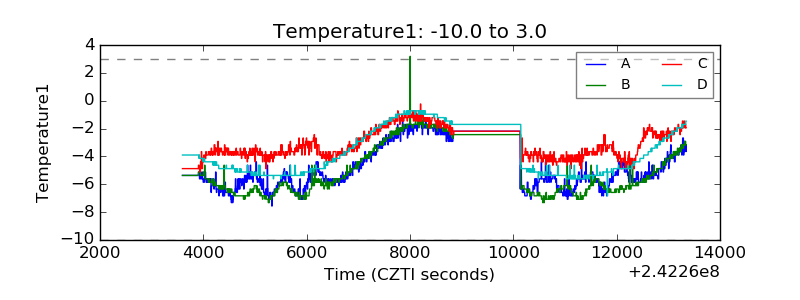 |
| Veto HV Monitor | 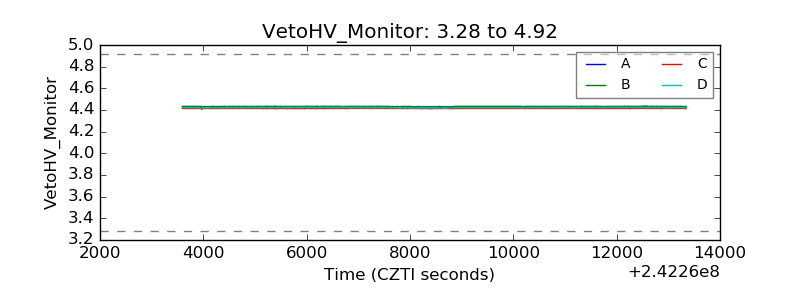 |
| Veto LLD | 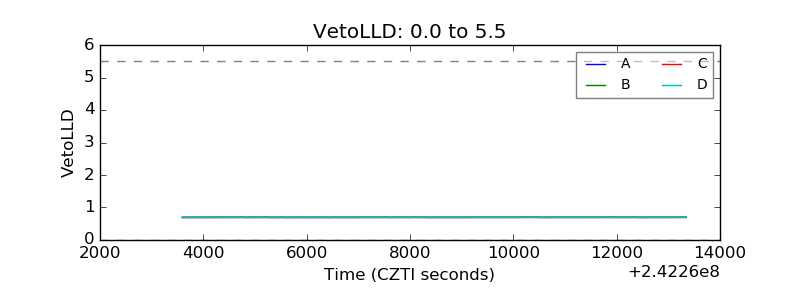 |
| Alpha Counter |  |
| _CPM_Rate | 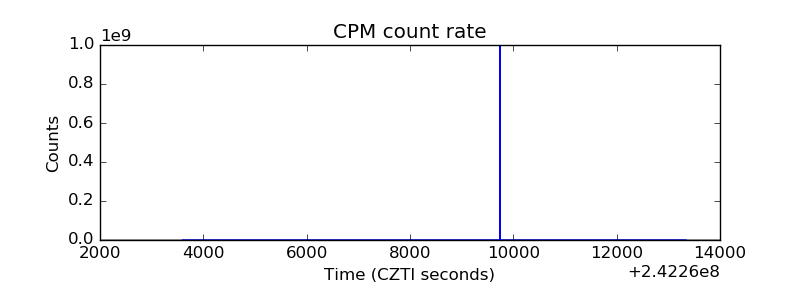 |
| CZT Counter | 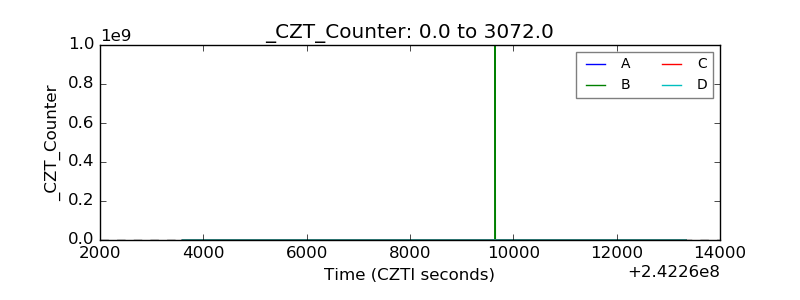 |
| +2.5 Volts monitor |  |
| +5 Volts monitor |  |
| _ROLL_ROT | 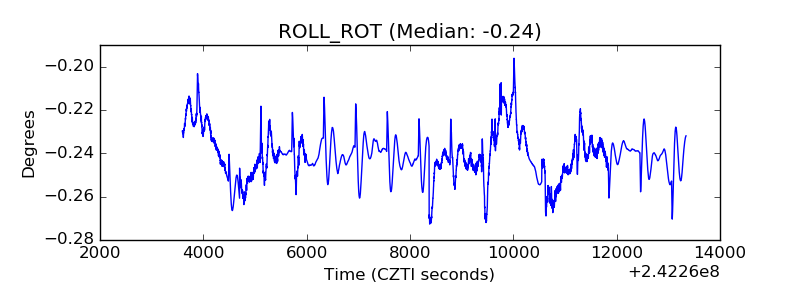 |
| _Roll_DEC | 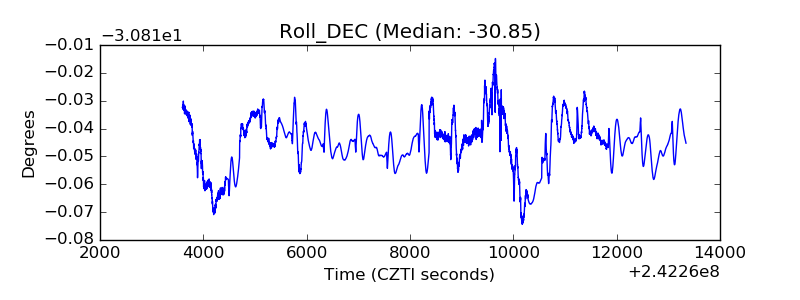 |
| _Roll_RA | 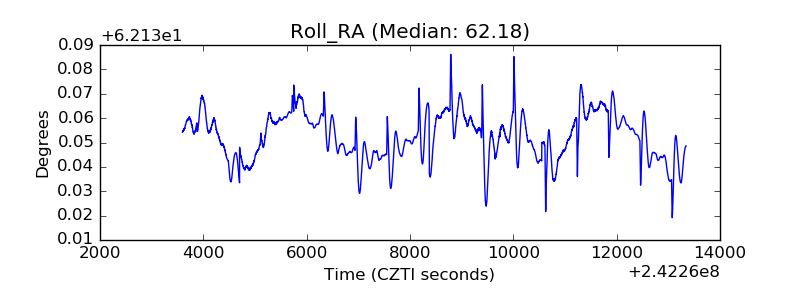 |
| Veto Counter | 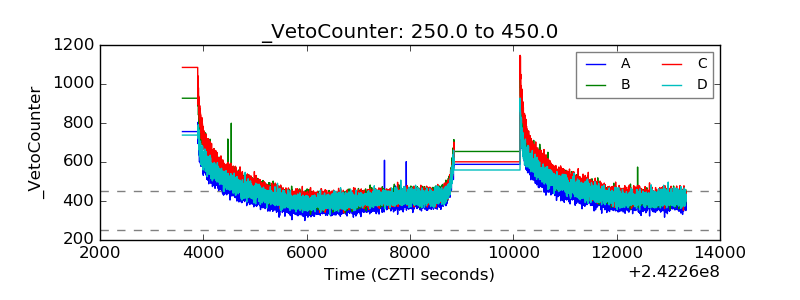 |