| Param | Original file | Final file |
|---|---|---|
| Filename | modeM0/AS1A03_126T01_9000001512_10482cztM0_level2.evt | modeM0/AS1A03_126T01_9000001512_10482cztM0_level2_quad_clean.evt |
| Size (bytes) | 1,762,922,880 | 366,880,320 |
| Size | 1.6 GB | 349.9 MB |
| Events in quadrant A | 12,807,179 | 2,360,641 |
| Events in quadrant B | 13,682,892 | 2,414,140 |
| Events in quadrant C | 11,534,289 | 2,382,832 |
| Events in quadrant D | 13,681,709 | 2,239,428 |
| Mode SS | |||
|---|---|---|---|
| Quadrant | BADHDUFLAG | Total packets | Discarded packets |
| A | 0 | 510 | 0 |
| B | 0 | 510 | 0 |
| C | 0 | 510 | 0 |
| D | 0 | 510 | 0 |
| Mode M0 | |||
|---|---|---|---|
| Quadrant | BADHDUFLAG | Total packets | Discarded packets |
| A | 0 | 54164 | 5 |
| B | 0 | 57114 | 5 |
| C | 0 | 50937 | 5 |
| D | 0 | 57651 | 5 |
| Mode M9 | |||
|---|---|---|---|
| Quadrant | BADHDUFLAG | Total packets | Discarded packets |
| A | 0 | 54 | 0 |
| B | 0 | 54 | 0 |
| C | 0 | 54 | 0 |
| D | 0 | 54 | 0 |
| Quadrant | Total seconds | Saturated seconds | Saturation percentage |
|---|---|---|---|
| A | 24939 | 168 | 0.673644% |
| B | 24939 | 507 | 2.032960% |
| C | 24939 | 77 | 0.308753% |
| D | 24939 | 225 | 0.902201% |
Noise dominated data is calculated using 1-second bins in cleaned event files. If a bin has >2000 counts, and if more than 50% of those come from <1% of pixels, then it is considered to be noise-dominated and hence unusable.
| Quadrant | # 1 sec bins | Bins with >0 counts | Bins with >2000 counts | High rate bins dominated by noise | Noise dominated (total time) | Noise dominated (detector-on time) | Marked lightcurve |
|---|---|---|---|---|---|---|---|
| A | 30424 | 24940 | 13 | 13 | 0.04% | 0.05% | 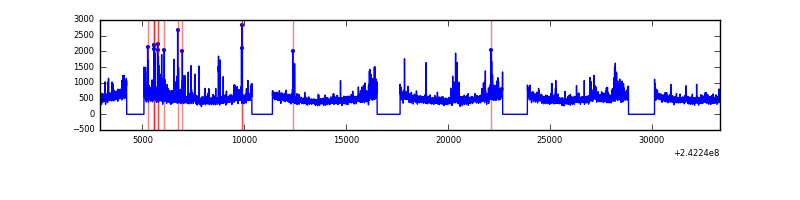 |
| B | 30424 | 24940 | 156 | 156 | 0.51% | 0.63% | 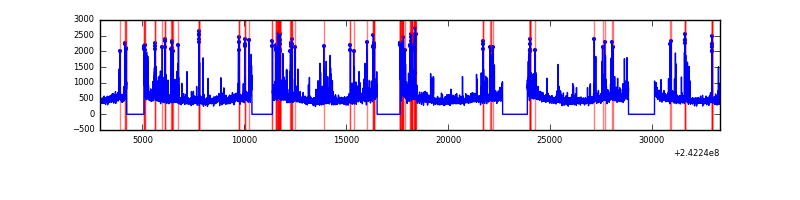 |
| C | 30424 | 24941 | 10 | 10 | 0.03% | 0.04% | 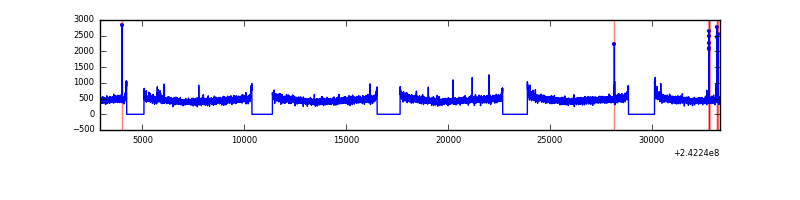 |
| D | 30424 | 24941 | 122 | 122 | 0.40% | 0.49% | 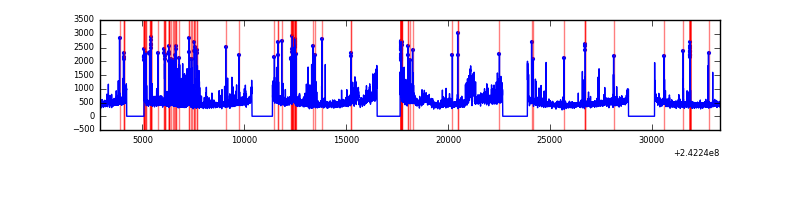 |
Top three noisy pixels from each quadrant. If the there are fewer than three noisy pixels in the level2.evt file, extra rows are filled as -1
| Pixel properties | Quadrant properties | ||||||
|---|---|---|---|---|---|---|---|
| Quadrant | DetID | PixID | Counts | Sigma | Mean | Median | Sigma |
| A | 5 | 16 | 377592 | 623.89 | 2980 | 2919 | 600.5 |
| A | 3 | 80 | 332950 | 549.55 | 2980 | 2919 | 600.5 |
| A | 15 | 239 | 207808 | 341.17 | 2980 | 2919 | 600.5 |
| B | 4 | 239 | 1534349 | 2748.88 | 2986 | 2915 | 557.1 |
| B | 0 | 214 | 149382 | 262.9 | 2986 | 2915 | 557.1 |
| B | 0 | 187 | 139018 | 244.3 | 2986 | 2915 | 557.1 |
| C | 14 | 234 | 54939 | 77.07 | 2938 | 2964 | 674.4 |
| C | 13 | 61 | 21680 | 27.75 | 2938 | 2964 | 674.4 |
| C | 14 | 67 | 20323 | 25.74 | 2938 | 2964 | 674.4 |
| D | 1 | 20 | 896018 | 1296.72 | 2896 | 2822 | 688.8 |
| D | 1 | 52 | 628837 | 908.84 | 2896 | 2822 | 688.8 |
| D | 8 | 195 | 499460 | 721.01 | 2896 | 2822 | 688.8 |
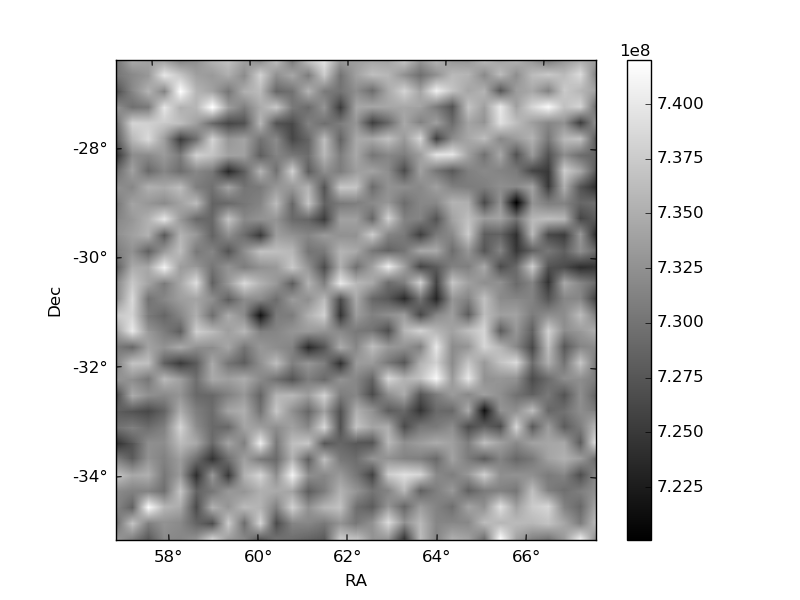
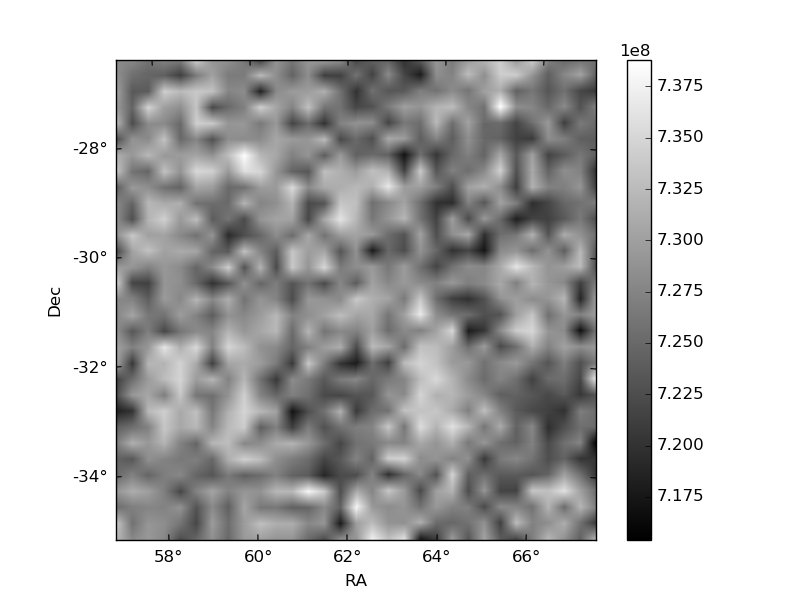
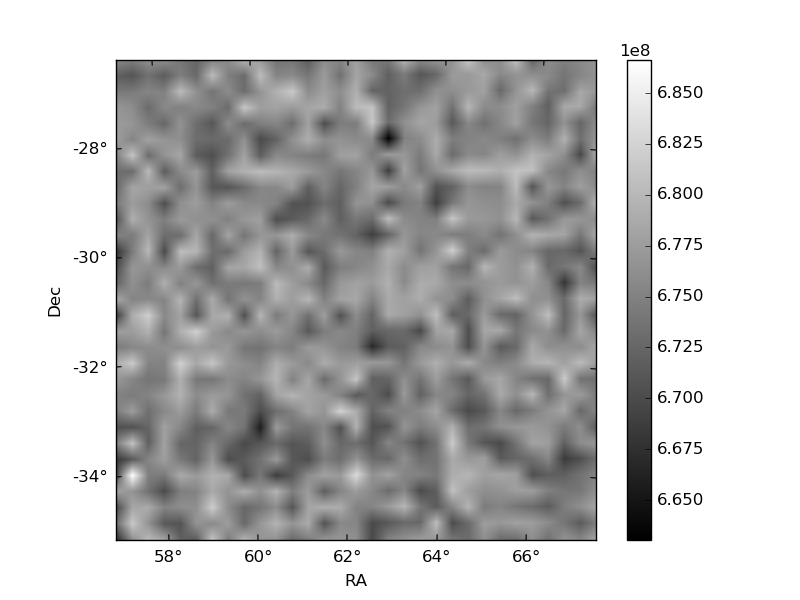
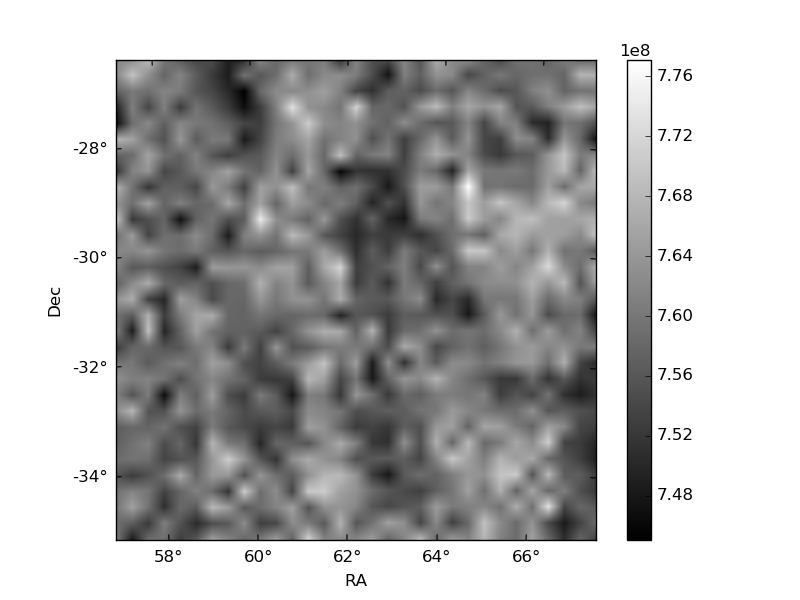
Histogram calculated using DETX and DETY for each event in the final _common_clean file
| Quadrant A |  |
 |
Quadrant B |
|---|---|---|---|
| Quadrant D |  |
 |
Quadrant C |
| Plot type | Count rate plots | Images |
|---|---|---|
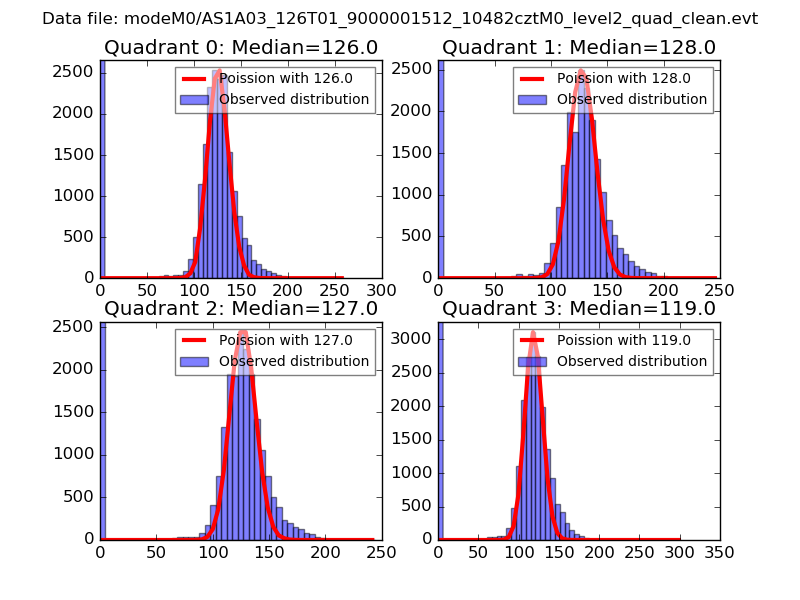
| Comparison with Poisson distribution Blue bars denote a histogram of data divided into 1 sec bins. Red curve is a Poisson curve with rate = median count rate of data. |
 |
 |
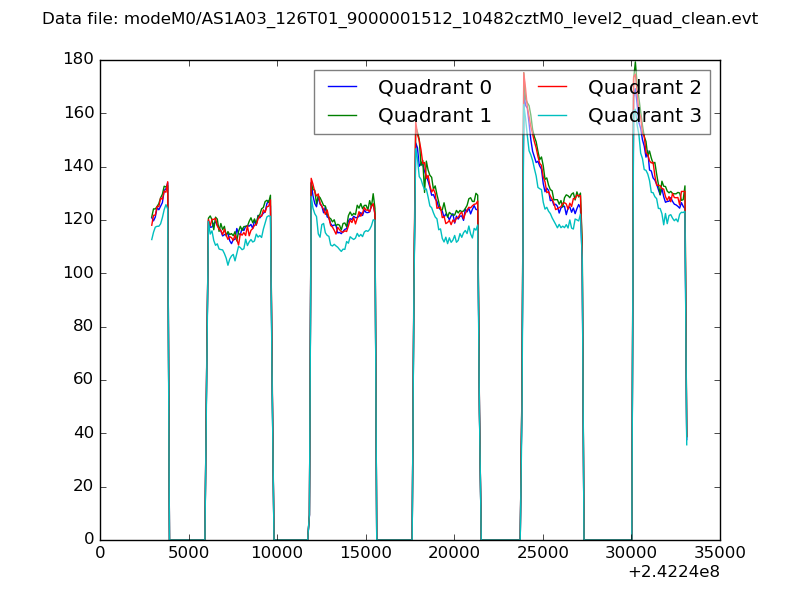
| Quadrant-wise count rates Data is divided into 100 sec bins |
 |
|
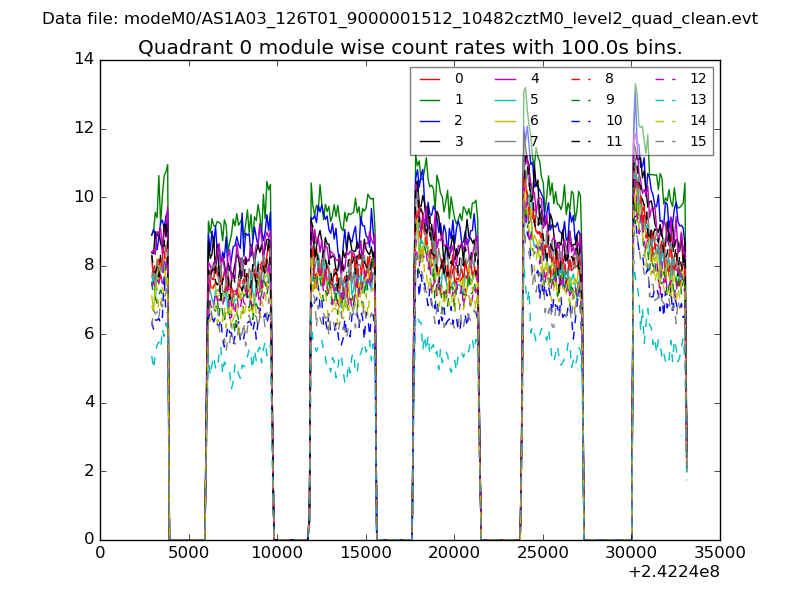
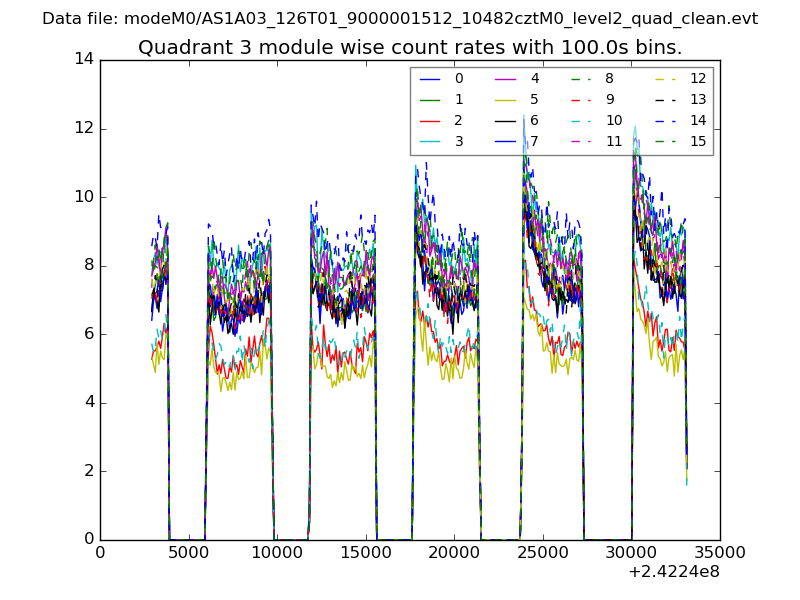
| Module-wise count rates for Quadrant A Data is divided into 100 sec bins |
 |
 |
| Module-wise count rates for Quadrant B Data is divided into 100 sec bins |
 |
 |
| Module-wise count rates for Quadrant C Data is divided into 100 sec bins |
 |
 |
| Module-wise count rates for Quadrant D Data is divided into 100 sec bins |
 |
 |
| Parameter | Plot |
|---|---|
| CZT HV Monitor |  |
| D_VDD | 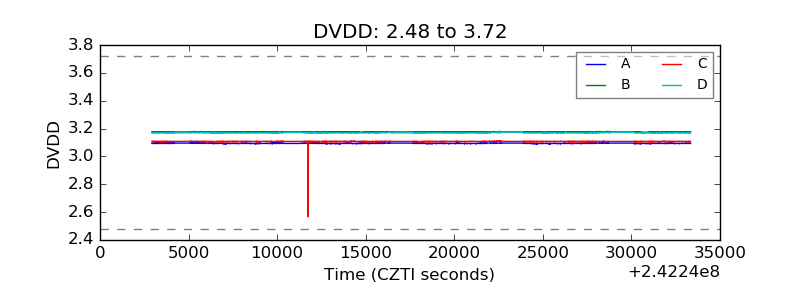 |
| Temperature 1 | 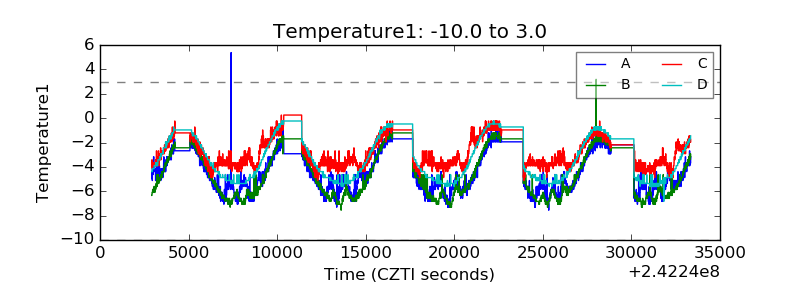 |
| Veto HV Monitor | 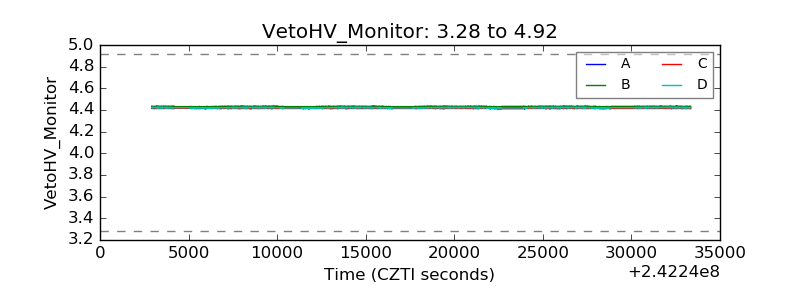 |
| Veto LLD | 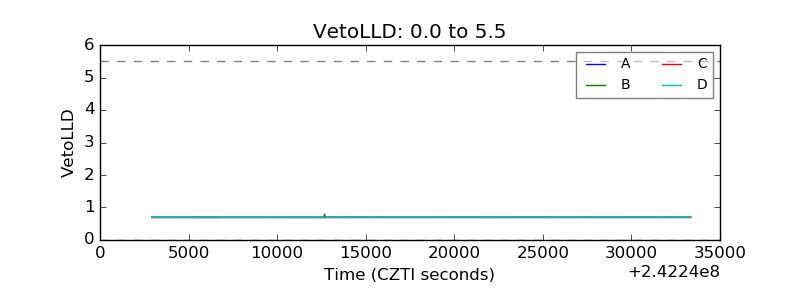 |
| Alpha Counter | 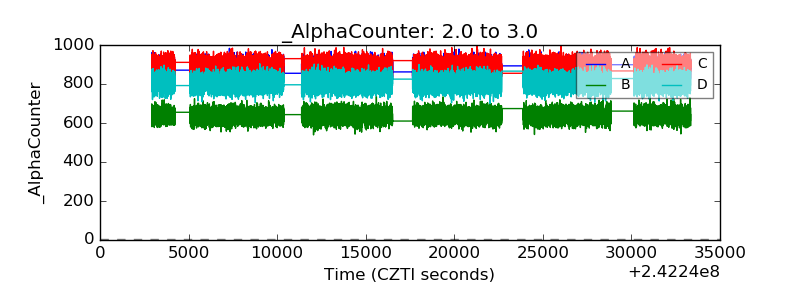 |
| _CPM_Rate | 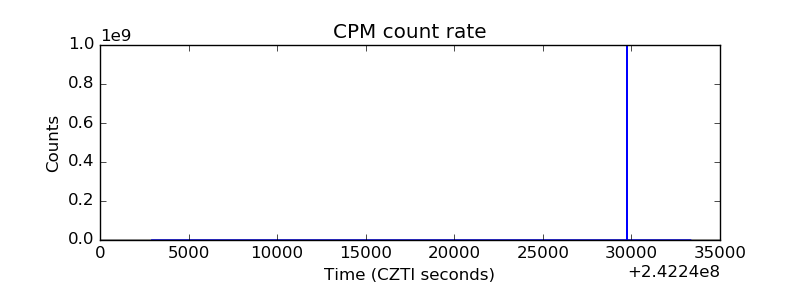 |
| CZT Counter | 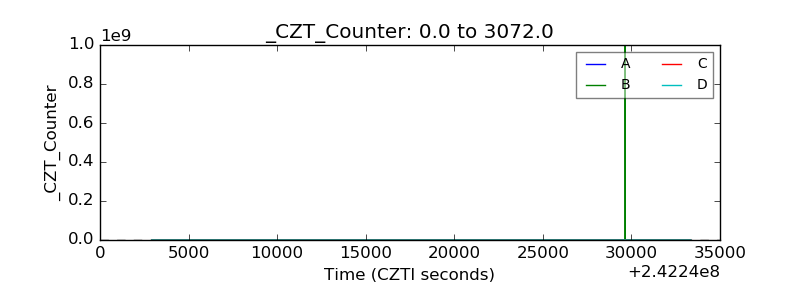 |
| +2.5 Volts monitor |  |
| +5 Volts monitor | 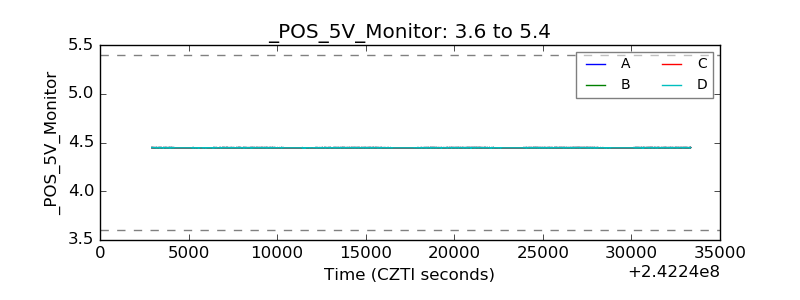 |
| _ROLL_ROT | 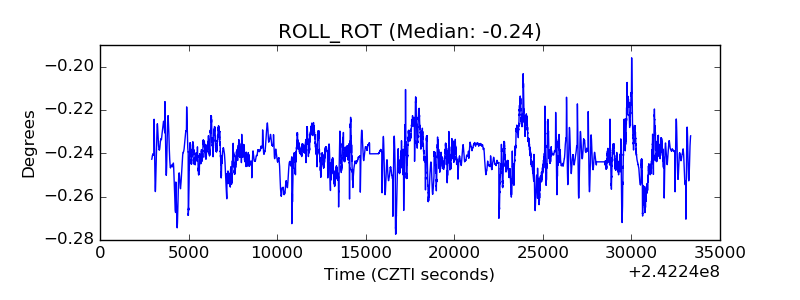 |
| _Roll_DEC | 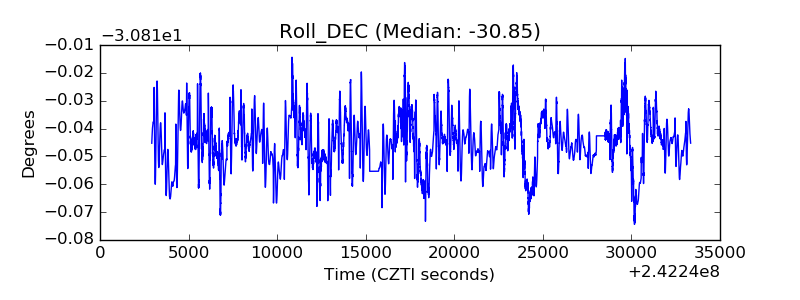 |
| _Roll_RA | 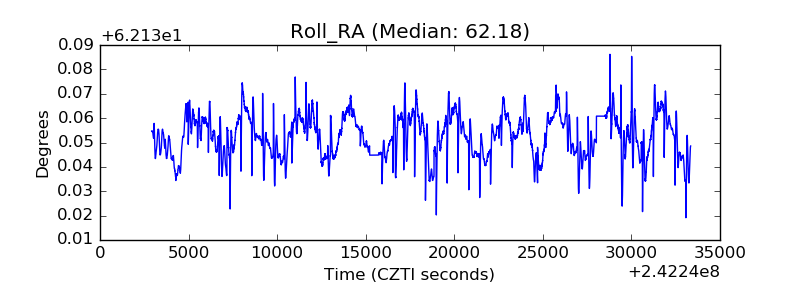 |
| Veto Counter | 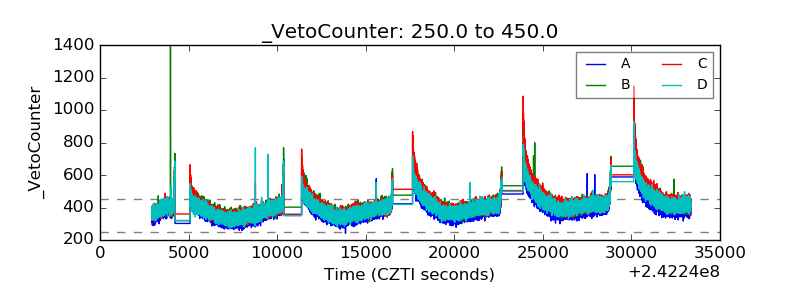 |