| Param | Original file | Final file |
|---|---|---|
| Filename | modeM0/AS1G07_066T01_9000001510_10424cztM0_level2.evt | modeM0/AS1G07_066T01_9000001510_10424cztM0_level2_quad_clean.evt |
| Size (bytes) | 228,291,840 | 44,501,760 |
| Size | 217.7 MB | 42.4 MB |
| Events in quadrant A | 1,818,994 | 286,543 |
| Events in quadrant B | 1,669,242 | 284,355 |
| Events in quadrant C | 1,448,813 | 288,795 |
| Events in quadrant D | 1,776,675 | 279,372 |
| Mode SS | |||
|---|---|---|---|
| Quadrant | BADHDUFLAG | Total packets | Discarded packets |
| A | 0 | 68 | 6 |
| B | 0 | 68 | 6 |
| C | 0 | 68 | 7 |
| D | 0 | 67 | 6 |
| Mode M9 | |||
|---|---|---|---|
| Quadrant | BADHDUFLAG | Total packets | Discarded packets |
| A | 0 | 7 | 0 |
| B | 0 | 7 | 0 |
| C | 0 | 7 | 0 |
| D | 0 | 7 | 0 |
| Mode M0 | |||
|---|---|---|---|
| Quadrant | BADHDUFLAG | Total packets | Discarded packets |
| A | 0 | 8354 | 969 |
| B | 0 | 8057 | 1271 |
| C | 0 | 6996 | 730 |
| D | 0 | 8172 | 1173 |
| Quadrant | Total seconds | Saturated seconds | Saturation percentage |
|---|---|---|---|
| A | 2912 | 142 | 4.876374% |
| B | 2887 | 166 | 5.749913% |
| C | 2973 | 91 | 3.060881% |
| D | 2889 | 112 | 3.876774% |
Noise dominated data is calculated using 1-second bins in cleaned event files. If a bin has >2000 counts, and if more than 50% of those come from <1% of pixels, then it is considered to be noise-dominated and hence unusable.
| Quadrant | # 1 sec bins | Bins with >0 counts | Bins with >2000 counts | High rate bins dominated by noise | Noise dominated (total time) | Noise dominated (detector-on time) | Marked lightcurve |
|---|---|---|---|---|---|---|---|
| A | 3696 | 2980 | 1 | 1 | 0.03% | 0.03% | 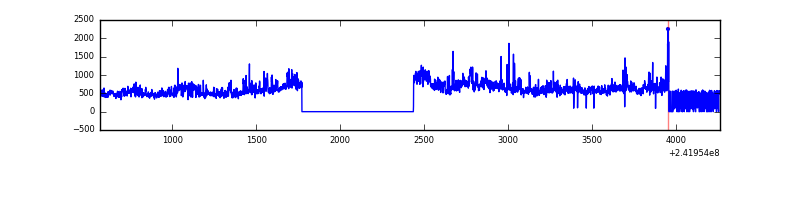 |
| B | 3696 | 2948 | 25 | 25 | 0.68% | 0.85% | 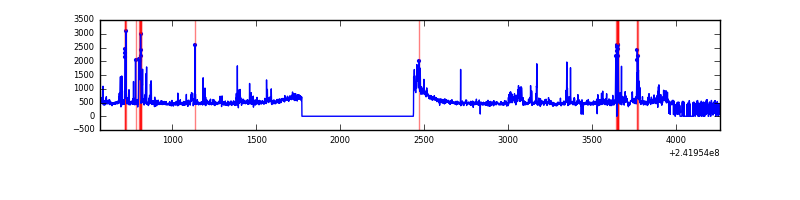 |
| C | 3696 | 3021 | 6 | 6 | 0.16% | 0.20% | 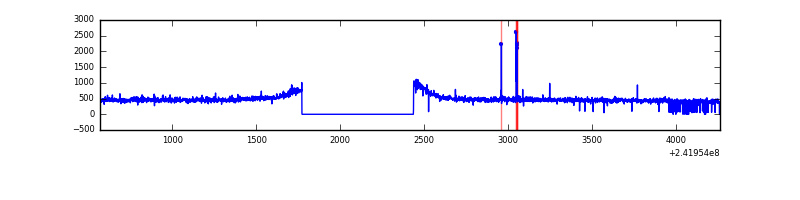 |
| D | 3692 | 2946 | 18 | 18 | 0.49% | 0.61% | 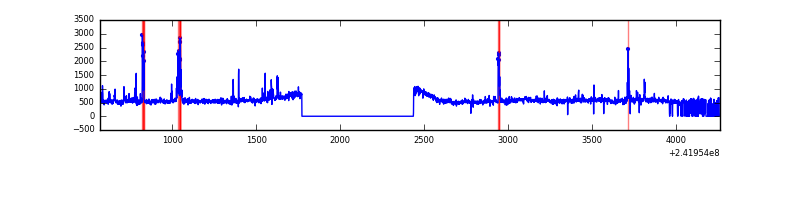 |
Top three noisy pixels from each quadrant. If the there are fewer than three noisy pixels in the level2.evt file, extra rows are filled as -1
| Pixel properties | Quadrant properties | ||||||
|---|---|---|---|---|---|---|---|
| Quadrant | DetID | PixID | Counts | Sigma | Mean | Median | Sigma |
| A | 13 | 251 | 417219 | 5516.0 | 362 | 352 | 75.6 |
| A | 8 | 15 | 3442 | 40.89 | 362 | 352 | 75.6 |
| A | 13 | 253 | 3310 | 39.14 | 362 | 352 | 75.6 |
| B | 4 | 239 | 223800 | 3154.06 | 355 | 345 | 70.8 |
| B | 0 | 214 | 34238 | 478.4 | 355 | 345 | 70.8 |
| B | 10 | 245 | 11861 | 162.55 | 355 | 345 | 70.8 |
| C | 14 | 234 | 18815 | 213.38 | 366 | 365 | 86.5 |
| C | 13 | 61 | 2749 | 27.57 | 366 | 365 | 86.5 |
| C | 14 | 67 | 2349 | 22.95 | 366 | 365 | 86.5 |
| D | 8 | 195 | 262224 | 3026.87 | 355 | 344 | 86.5 |
| D | 9 | 85 | 51376 | 589.84 | 355 | 344 | 86.5 |
| D | 1 | 52 | 50704 | 582.07 | 355 | 344 | 86.5 |
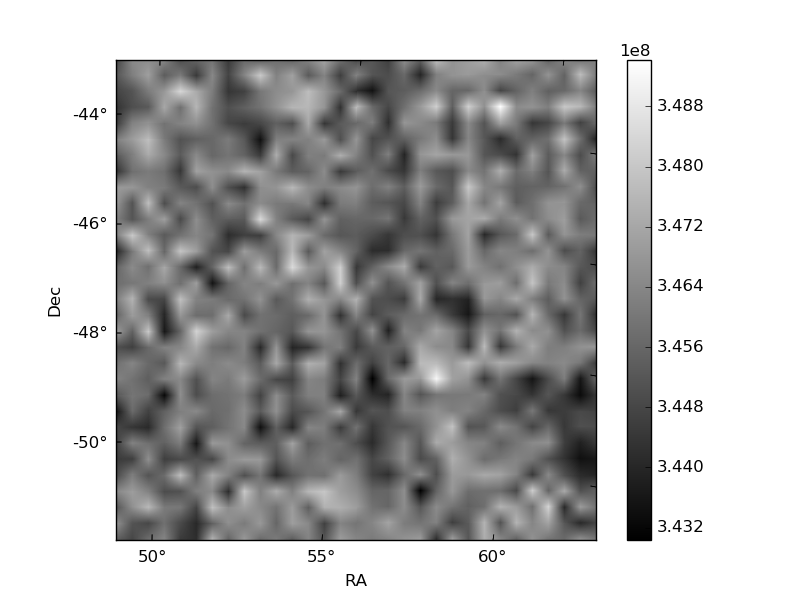
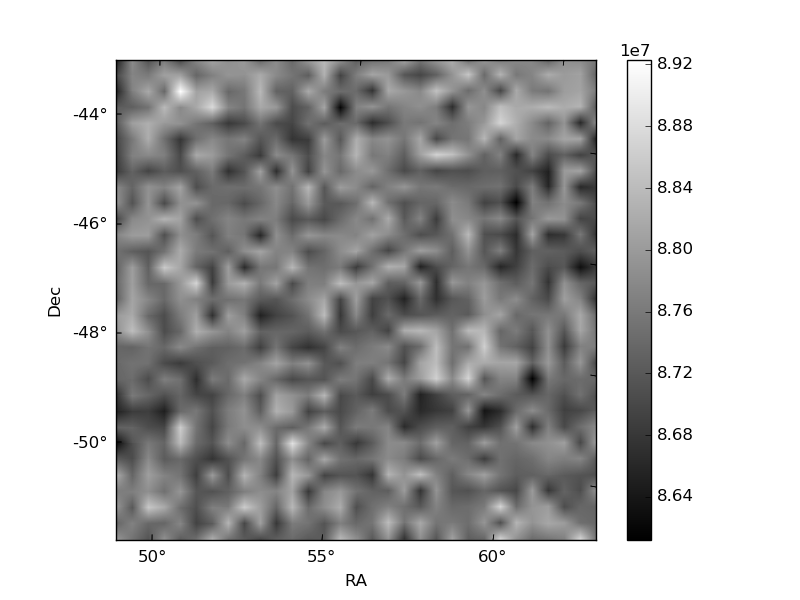
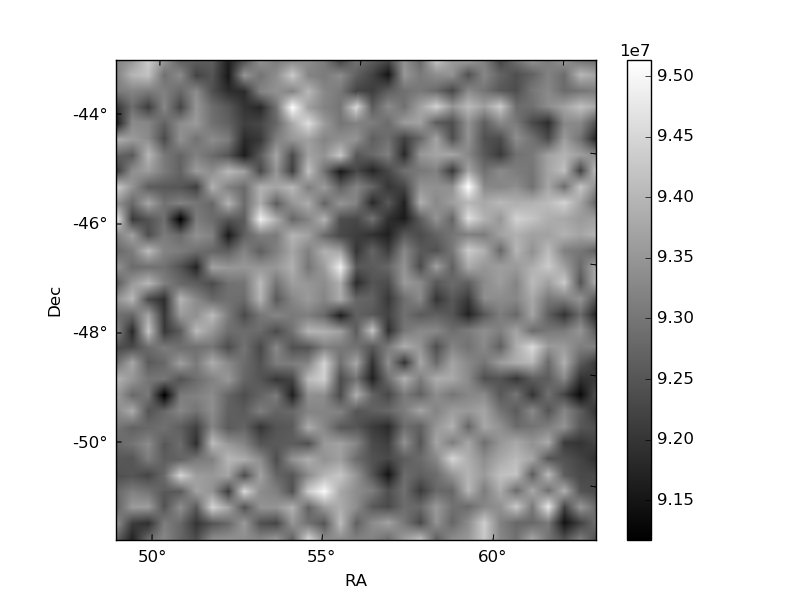
Histogram calculated using DETX and DETY for each event in the final _common_clean file
| Quadrant A | 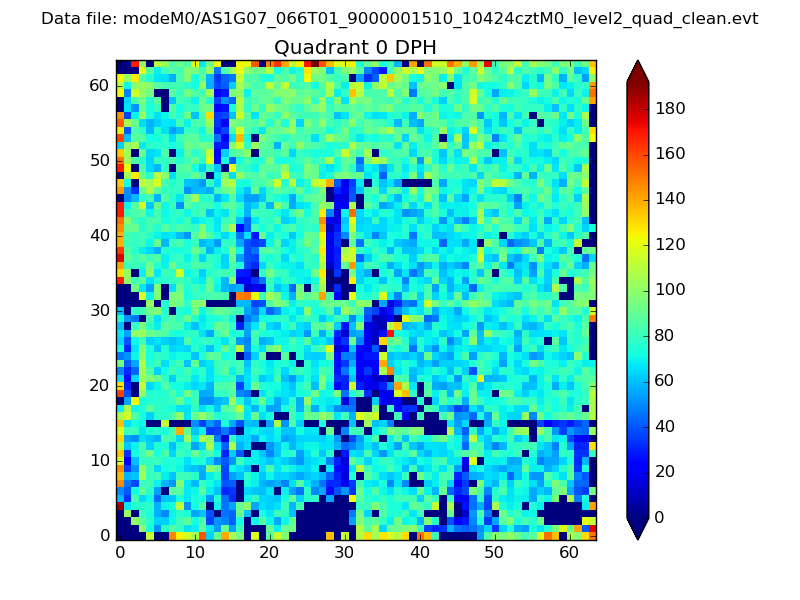 |
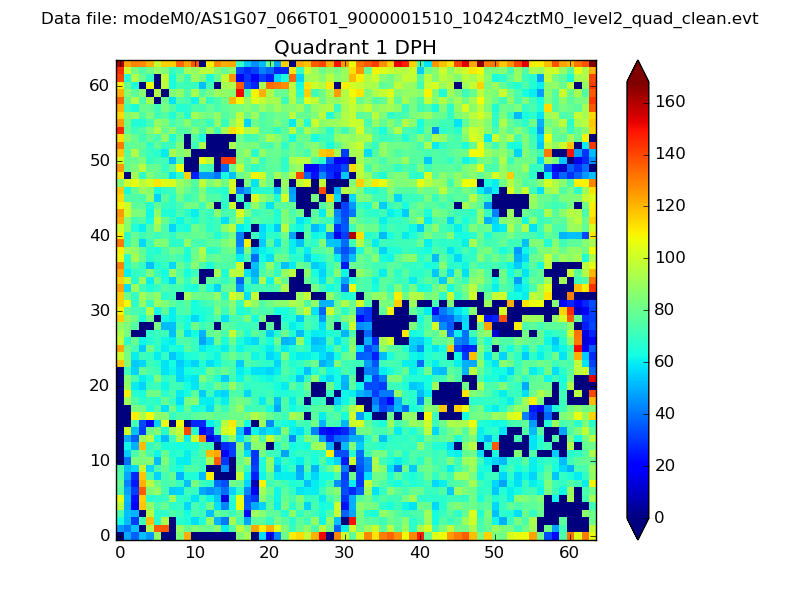 |
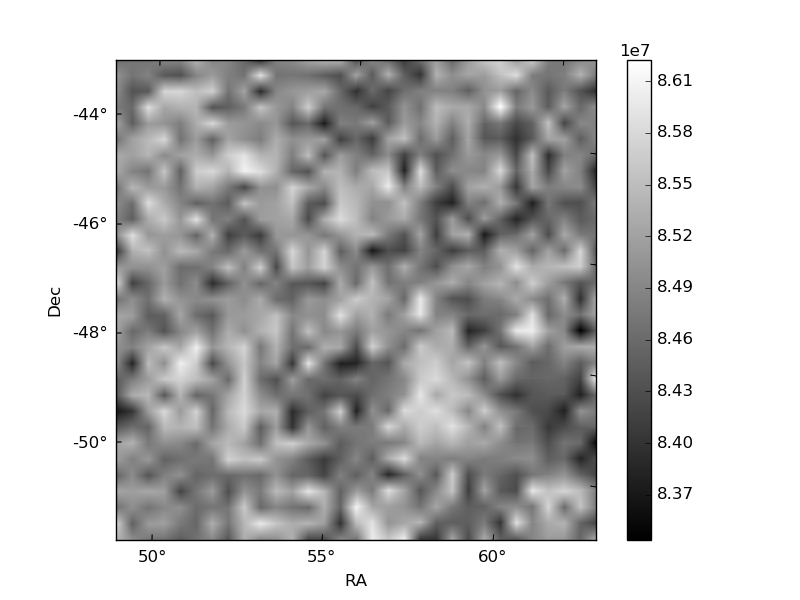
Quadrant B |
|---|---|---|---|
| Quadrant D | 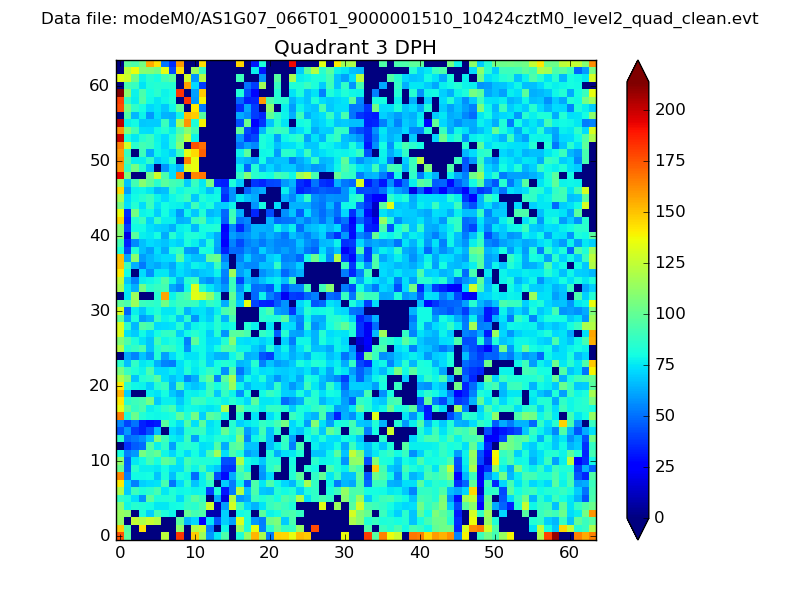 |
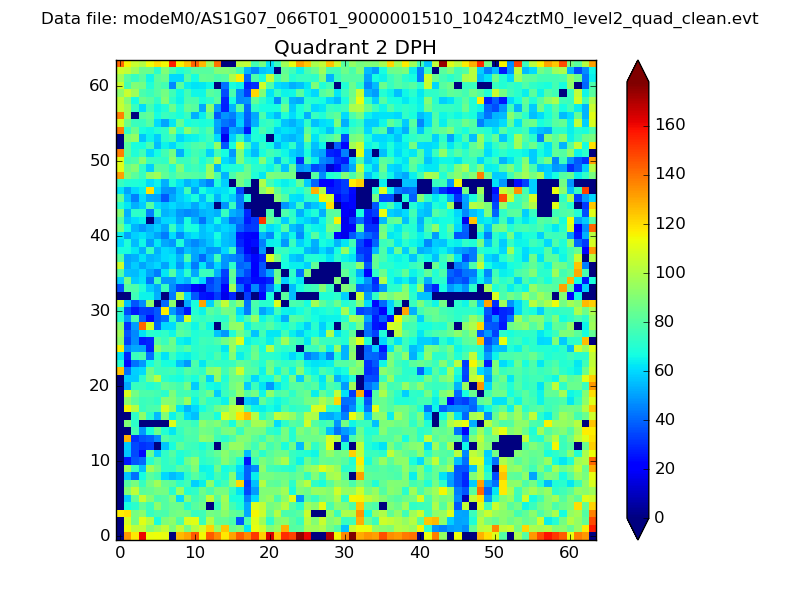 |
Quadrant C |
| Plot type | Count rate plots | Images |
|---|---|---|
| Comparison with Poisson distribution Blue bars denote a histogram of data divided into 1 sec bins. Red curve is a Poisson curve with rate = median count rate of data. |
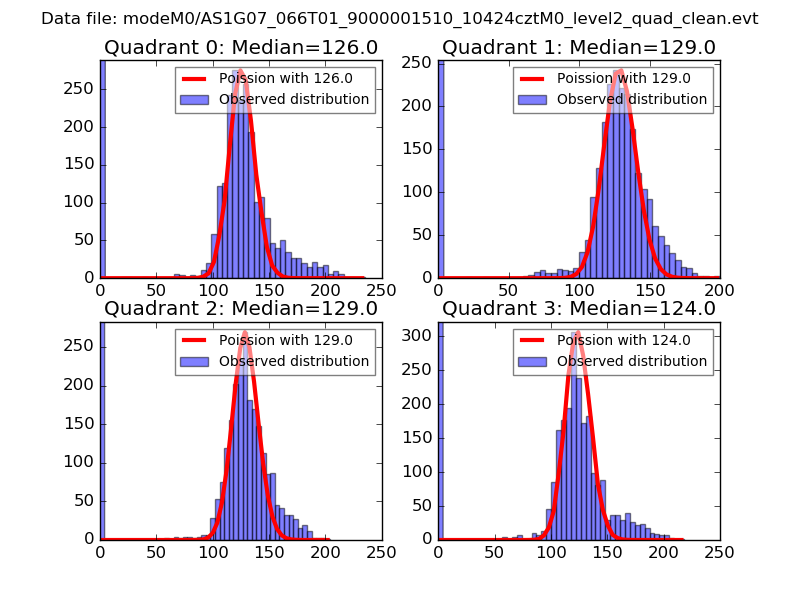 |
 |
| Quadrant-wise count rates Data is divided into 100 sec bins |
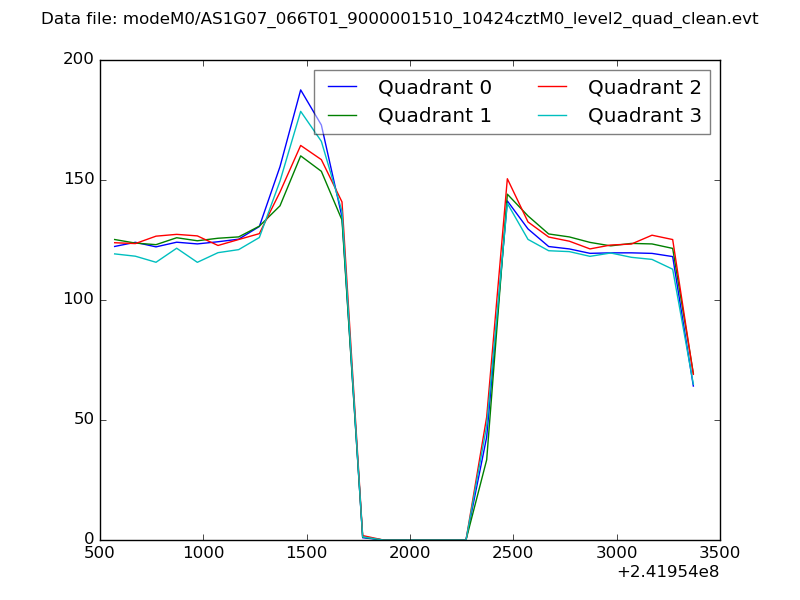 |
|
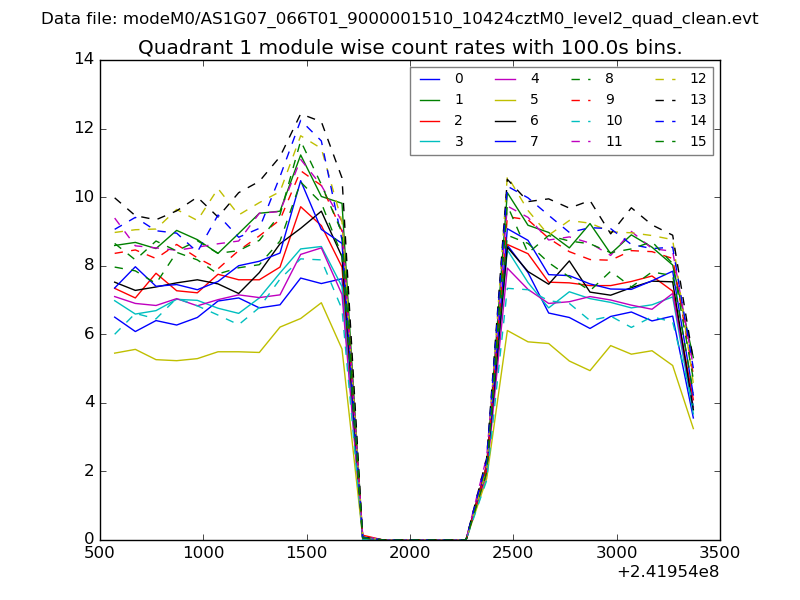
| Module-wise count rates for Quadrant A Data is divided into 100 sec bins |
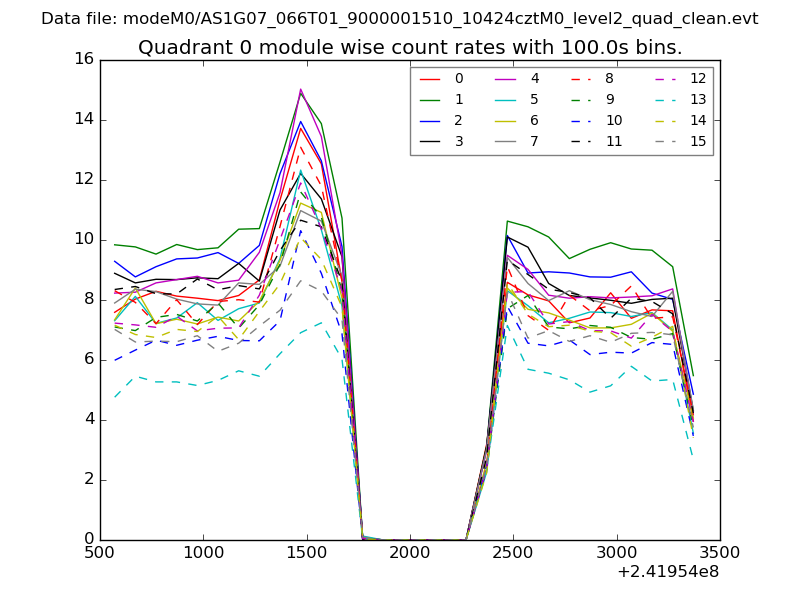 |
 |
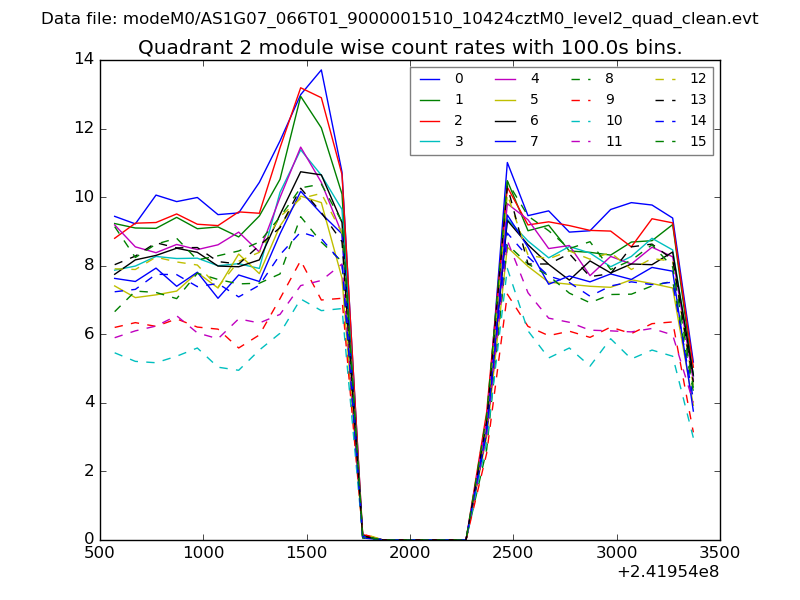
| Module-wise count rates for Quadrant B Data is divided into 100 sec bins |
 |
 |
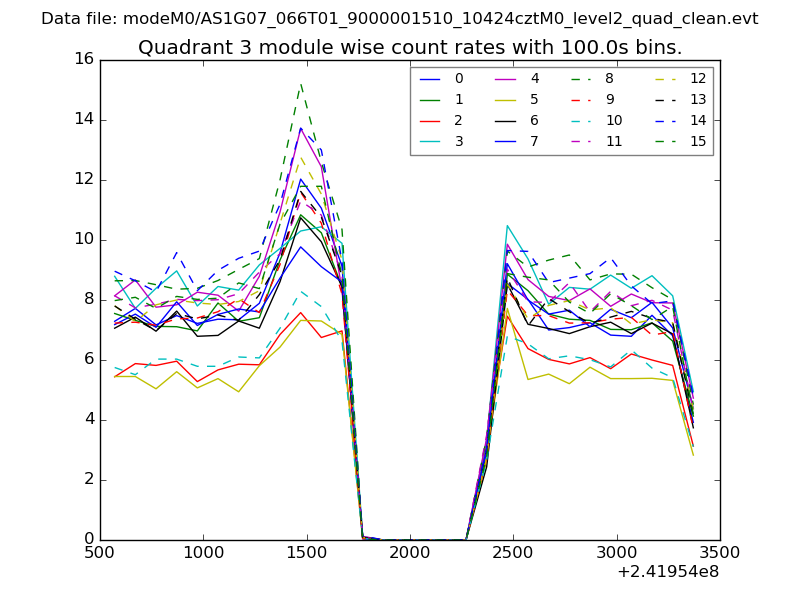
| Module-wise count rates for Quadrant C Data is divided into 100 sec bins |
 |
 |
| Module-wise count rates for Quadrant D Data is divided into 100 sec bins |
 |
 |
| Parameter | Plot |
|---|---|
| CZT HV Monitor | 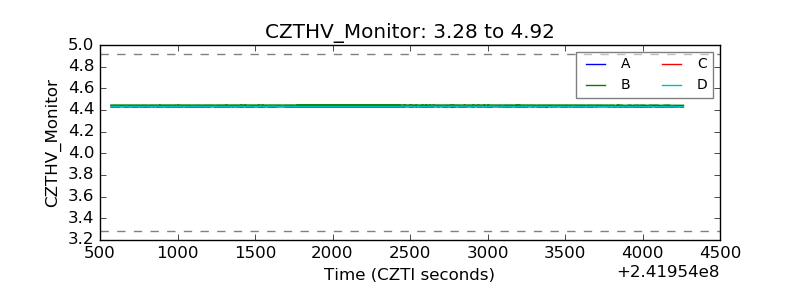 |
| D_VDD | 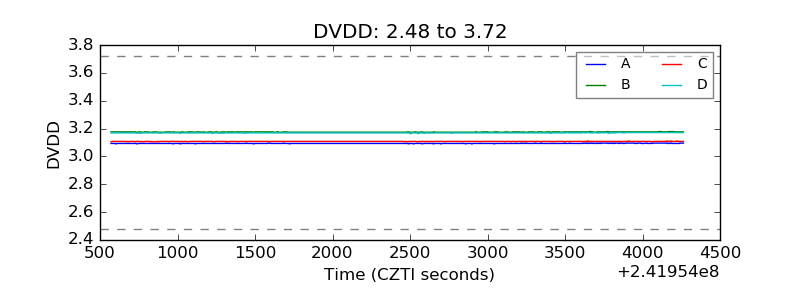 |
| Temperature 1 |  |
| Veto HV Monitor | 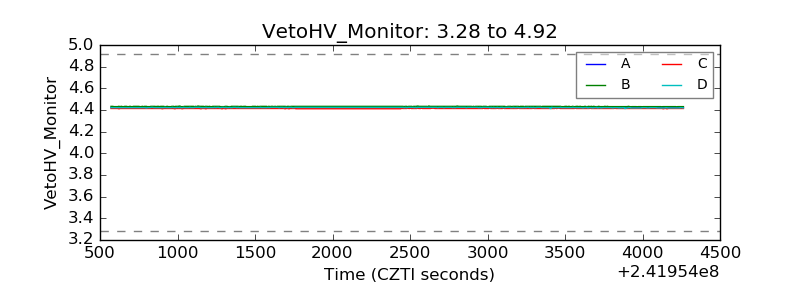 |
| Veto LLD | 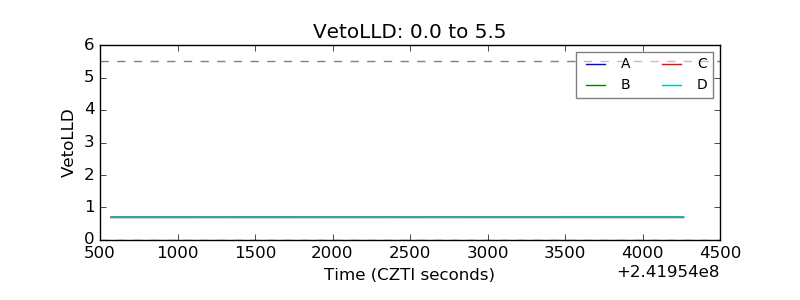 |
| Alpha Counter | 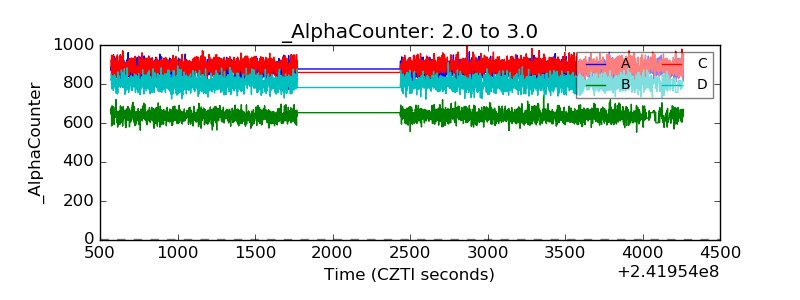 |
| _CPM_Rate | 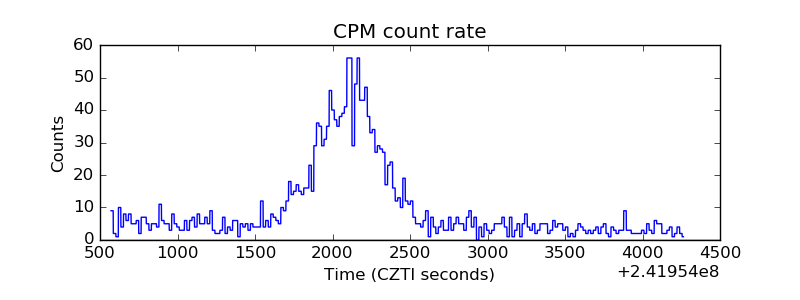 |
| CZT Counter | 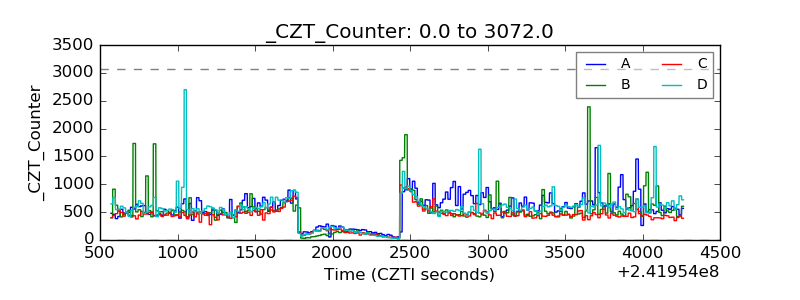 |
| +2.5 Volts monitor |  |
| +5 Volts monitor |  |
| _ROLL_ROT |  |
| _Roll_DEC | 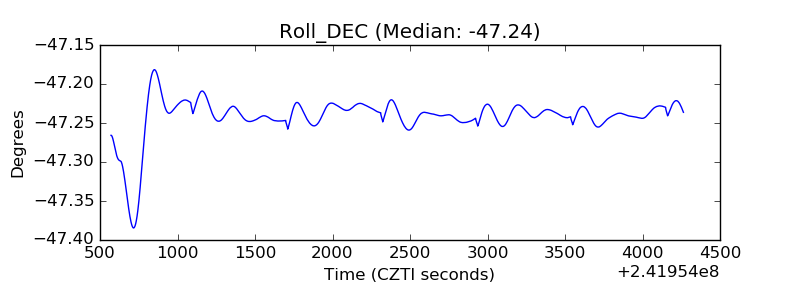 |
| _Roll_RA | 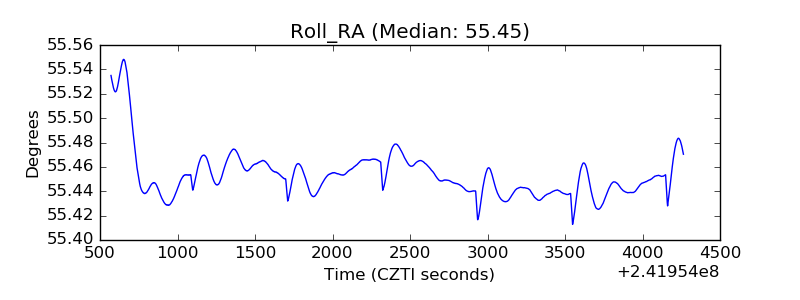 |
| Veto Counter | 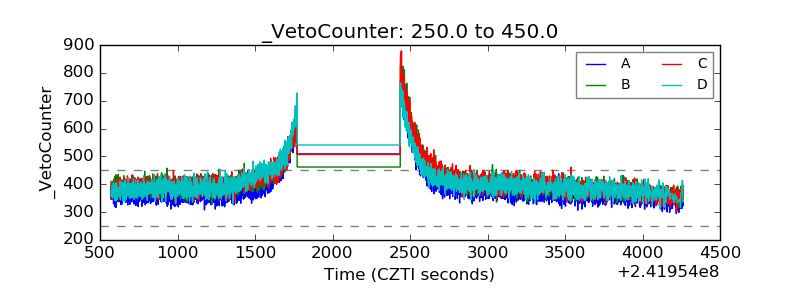 |