| Param | Original file | Final file |
|---|---|---|
| Filename | modeM0/AS1G07_066T01_9000001510_10425cztM0_level2.evt | modeM0/AS1G07_066T01_9000001510_10425cztM0_level2_quad_clean.evt |
| Size (bytes) | 687,355,200 | 82,497,600 |
| Size | 655.5 MB | 78.7 MB |
| Events in quadrant A | 7,309,507 | 457,441 |
| Events in quadrant B | 4,940,565 | 513,066 |
| Events in quadrant C | 3,341,321 | 527,348 |
| Events in quadrant D | 4,731,437 | 491,375 |
| Mode SS | |||
|---|---|---|---|
| Quadrant | BADHDUFLAG | Total packets | Discarded packets |
| A | 0 | 174 | 19 |
| B | 0 | 174 | 17 |
| C | 0 | 174 | 18 |
| D | 0 | 173 | 16 |
| Mode M9 | |||
|---|---|---|---|
| Quadrant | BADHDUFLAG | Total packets | Discarded packets |
| A | 0 | 4 | 2 |
| B | 0 | 4 | 2 |
| C | 0 | 4 | 2 |
| D | 0 | 4 | 2 |
| Mode M0 | |||
|---|---|---|---|
| Quadrant | BADHDUFLAG | Total packets | Discarded packets |
| A | 0 | 32514 | 5762 |
| B | 0 | 23088 | 3579 |
| C | 0 | 18547 | 3422 |
| D | 0 | 22545 | 3837 |
| Quadrant | Total seconds | Saturated seconds | Saturation percentage |
|---|---|---|---|
| A | 7077 | 752 | 10.625971% |
| B | 7340 | 394 | 5.367847% |
| C | 7388 | 49 | 0.663238% |
| D | 7314 | 106 | 1.449275% |
Noise dominated data is calculated using 1-second bins in cleaned event files. If a bin has >2000 counts, and if more than 50% of those come from <1% of pixels, then it is considered to be noise-dominated and hence unusable.
| Quadrant | # 1 sec bins | Bins with >0 counts | Bins with >2000 counts | High rate bins dominated by noise | Noise dominated (total time) | Noise dominated (detector-on time) | Marked lightcurve |
|---|---|---|---|---|---|---|---|
| A | 8003 | 7081 | 510 | 510 | 6.37% | 7.20% | 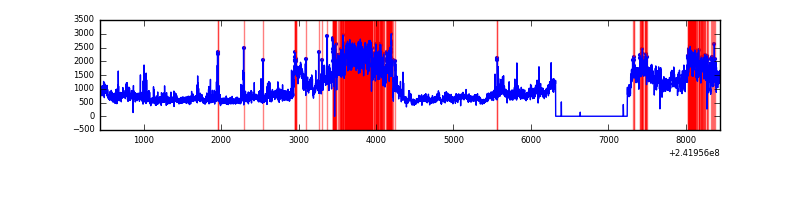 |
| B | 8003 | 7418 | 223 | 223 | 2.79% | 3.01% | 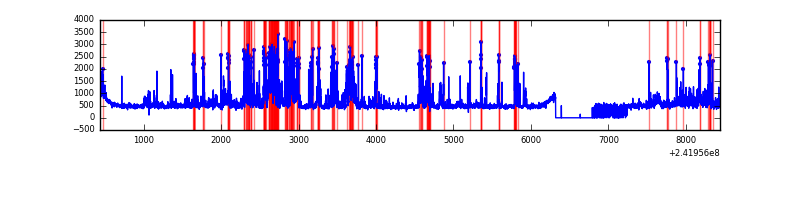 |
| C | 8003 | 7468 | 7 | 7 | 0.09% | 0.09% | 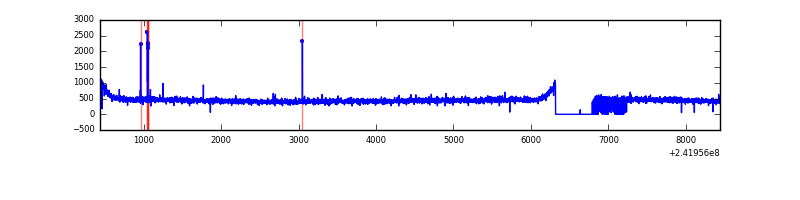 |
| D | 8004 | 7426 | 60 | 60 | 0.75% | 0.81% | 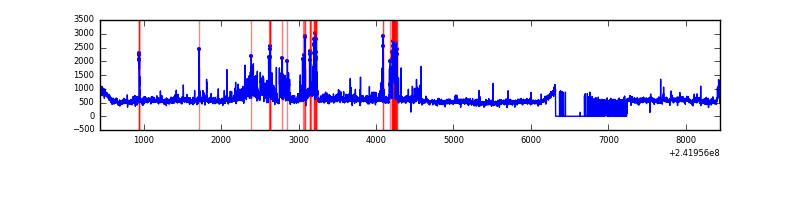 |
Top three noisy pixels from each quadrant. If the there are fewer than three noisy pixels in the level2.evt file, extra rows are filled as -1
| Pixel properties | Quadrant properties | ||||||
|---|---|---|---|---|---|---|---|
| Quadrant | DetID | PixID | Counts | Sigma | Mean | Median | Sigma |
| A | 13 | 251 | 4124337 | 24857.58 | 806 | 788 | 165.9 |
| A | 3 | 80 | 56864 | 338.04 | 806 | 788 | 165.9 |
| A | 8 | 15 | 12029 | 67.76 | 806 | 788 | 165.9 |
| B | 4 | 239 | 1378407 | 8546.16 | 845 | 821 | 161.2 |
| B | 4 | 81 | 129756 | 799.88 | 845 | 821 | 161.2 |
| B | 0 | 214 | 72725 | 446.07 | 845 | 821 | 161.2 |
| C | 14 | 234 | 21737 | 106.38 | 848 | 849 | 196.4 |
| C | 13 | 61 | 6263 | 27.57 | 848 | 849 | 196.4 |
| C | 8 | 128 | 4073 | 16.42 | 848 | 849 | 196.4 |
| D | 8 | 195 | 764361 | 3790.52 | 834 | 812 | 201.4 |
| D | 5 | 222 | 461836 | 2288.68 | 834 | 812 | 201.4 |
| D | 1 | 52 | 198032 | 979.07 | 834 | 812 | 201.4 |
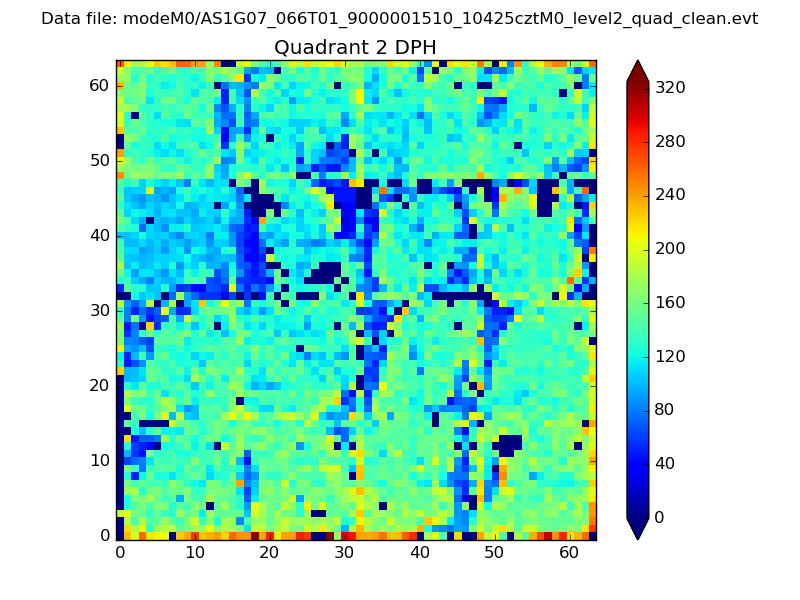
Histogram calculated using DETX and DETY for each event in the final _common_clean file
| Quadrant A | 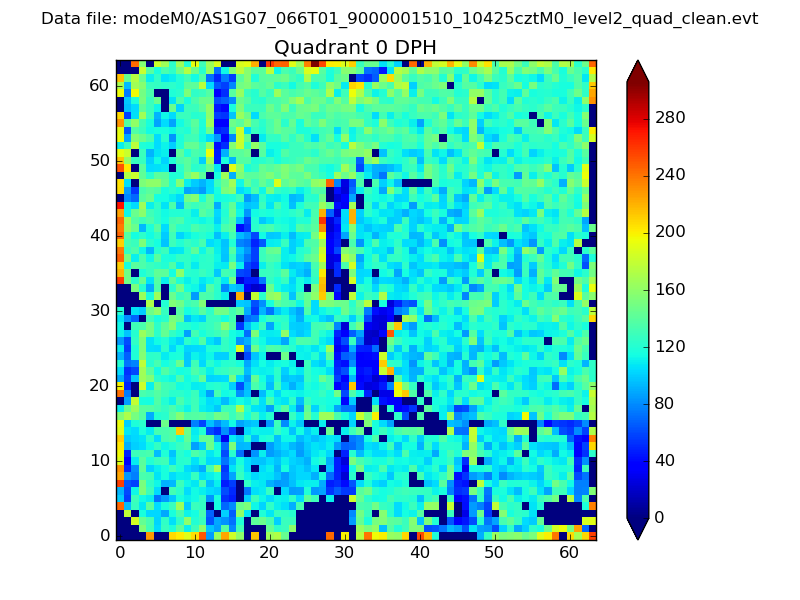 |
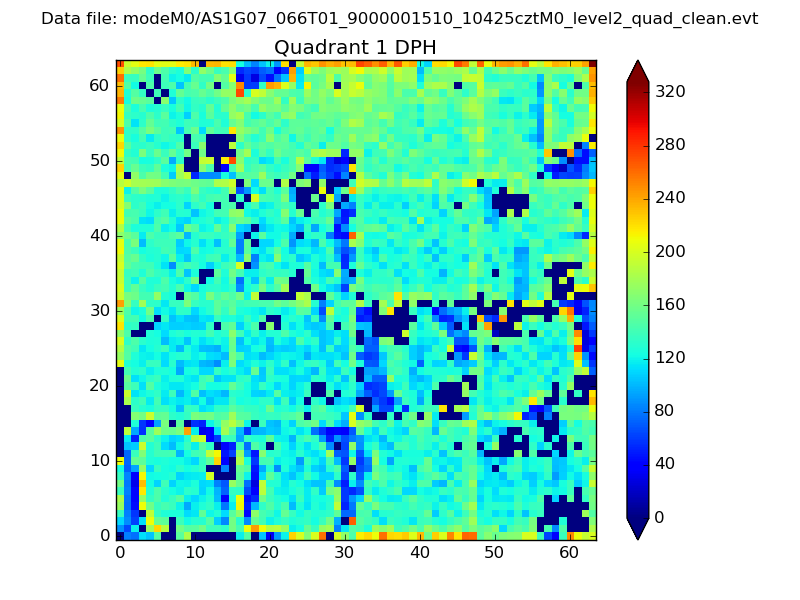 |
Quadrant B |
|---|---|---|---|
| Quadrant D | 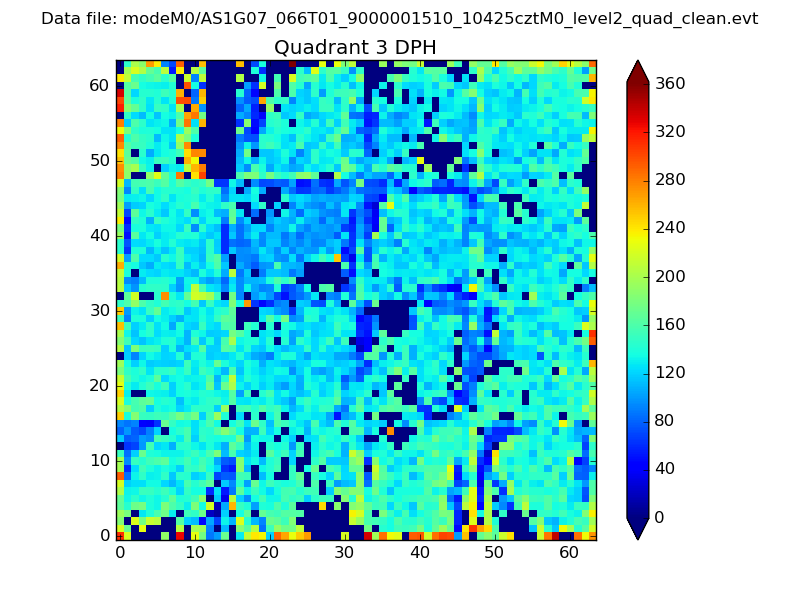 |
 |
Quadrant C |
| Plot type | Count rate plots | Images |
|---|---|---|
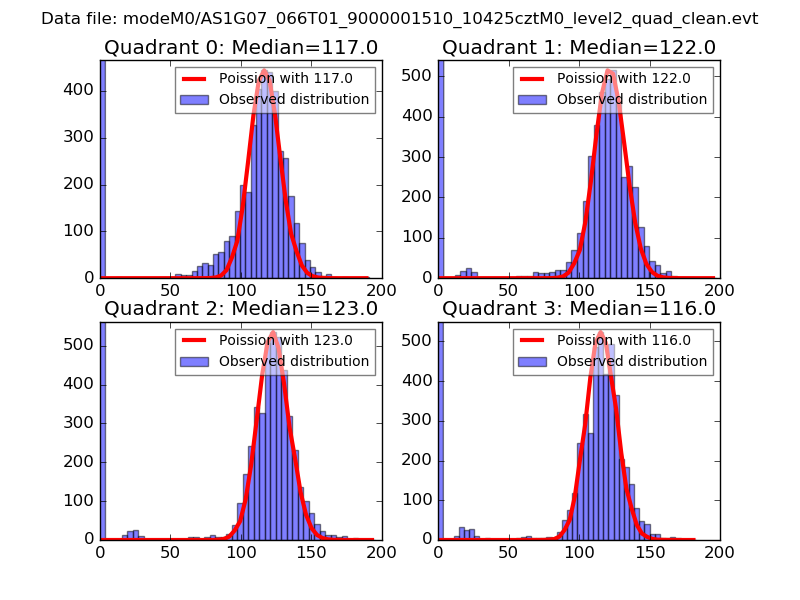
| Comparison with Poisson distribution Blue bars denote a histogram of data divided into 1 sec bins. Red curve is a Poisson curve with rate = median count rate of data. |
 |
 |
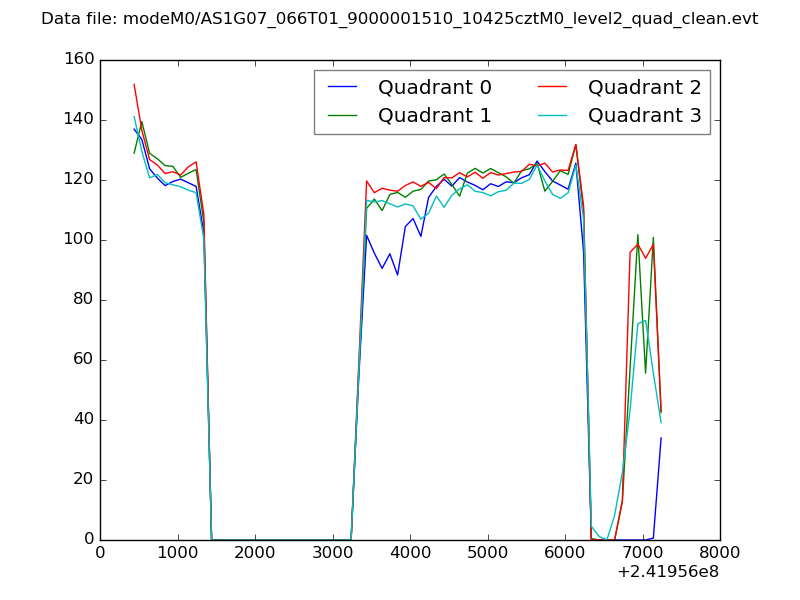
| Quadrant-wise count rates Data is divided into 100 sec bins |
 |
|
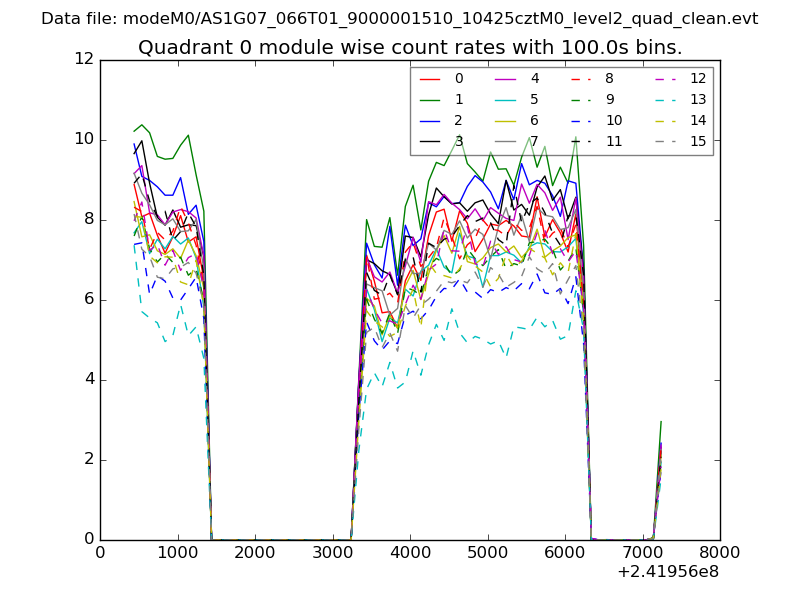
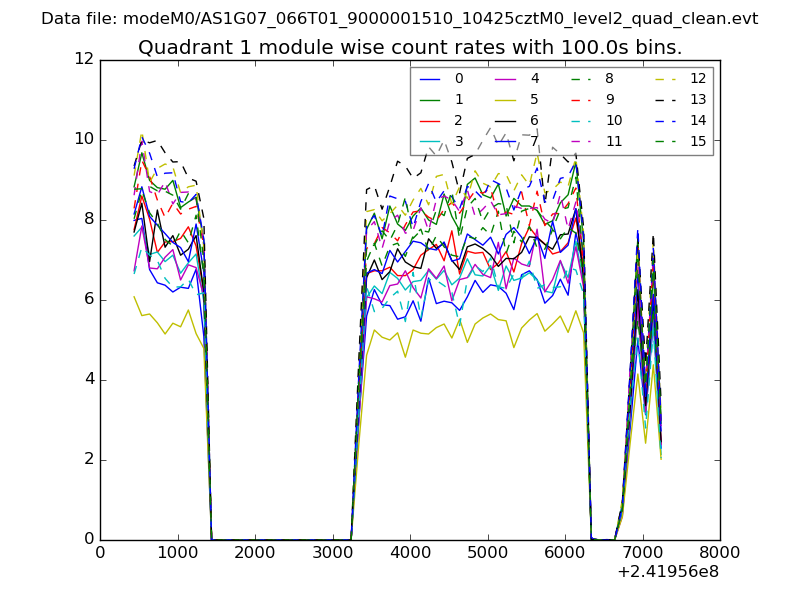
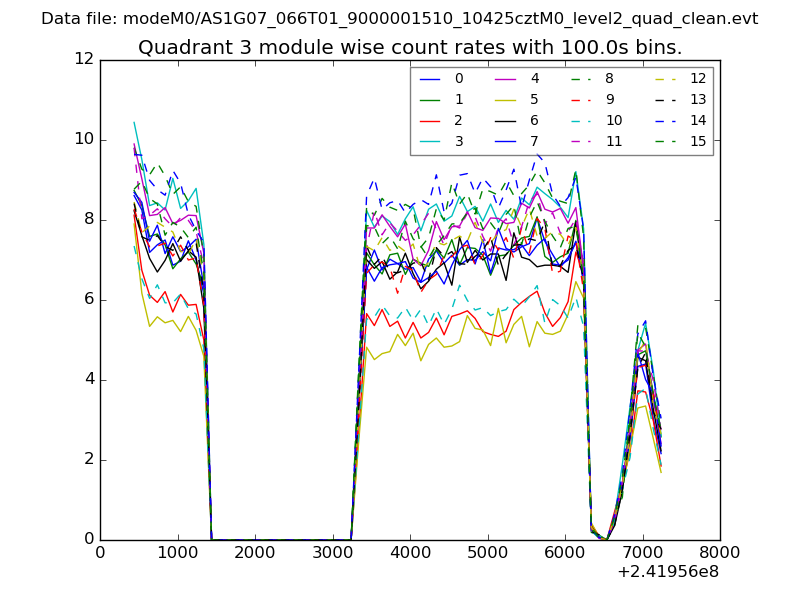
| Module-wise count rates for Quadrant A Data is divided into 100 sec bins |
 |
 |
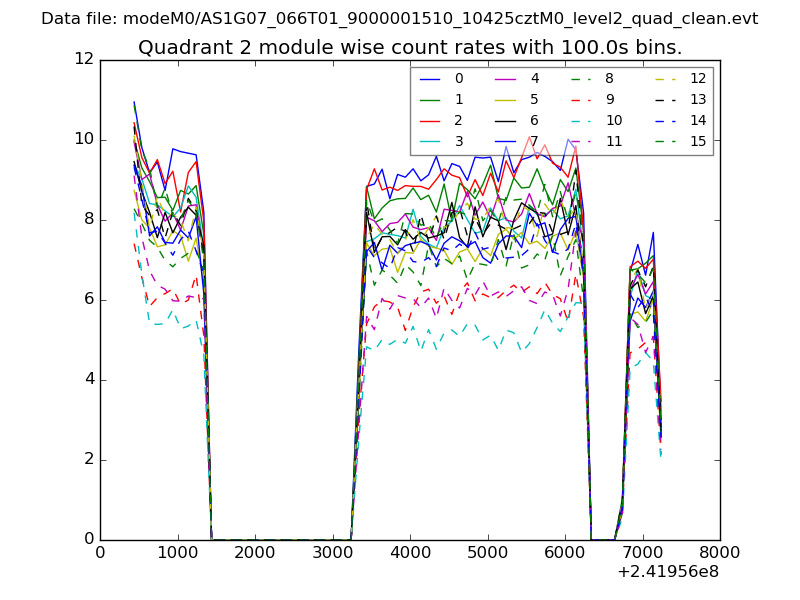
| Module-wise count rates for Quadrant B Data is divided into 100 sec bins |
 |
 |
| Module-wise count rates for Quadrant C Data is divided into 100 sec bins |
 |
 |
| Module-wise count rates for Quadrant D Data is divided into 100 sec bins |
 |
 |
| Parameter | Plot |
|---|---|
| CZT HV Monitor | 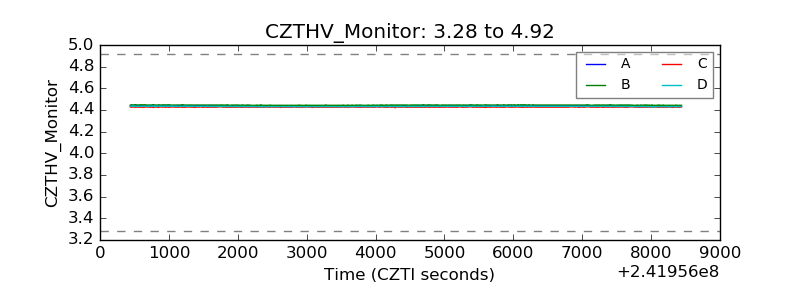 |
| D_VDD |  |
| Temperature 1 | 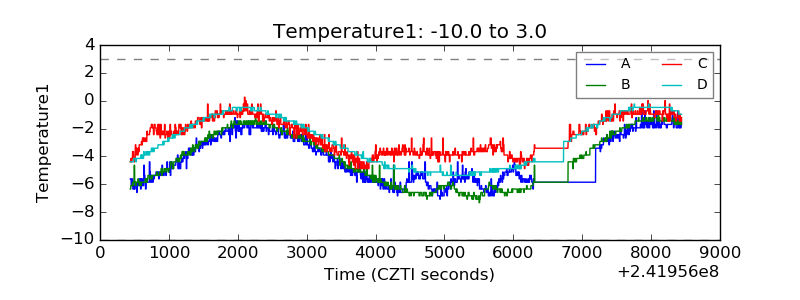 |
| Veto HV Monitor | 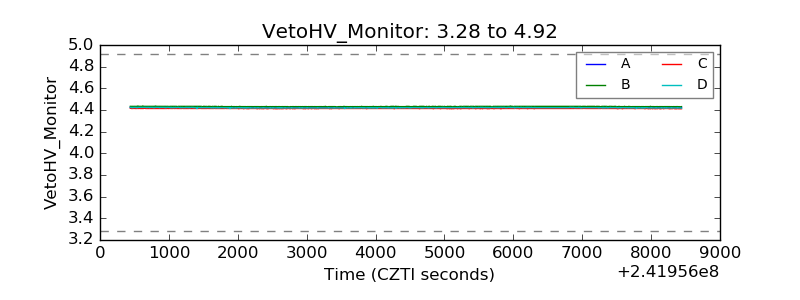 |
| Veto LLD | 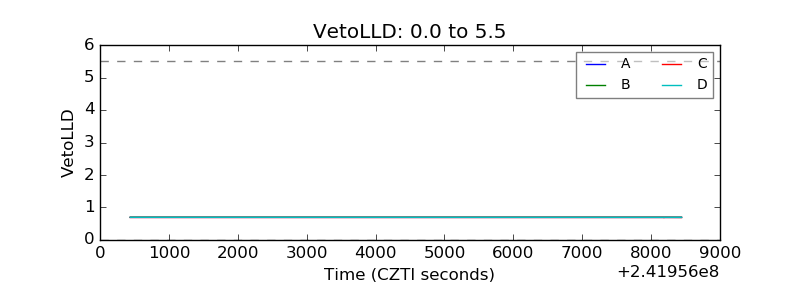 |
| Alpha Counter | 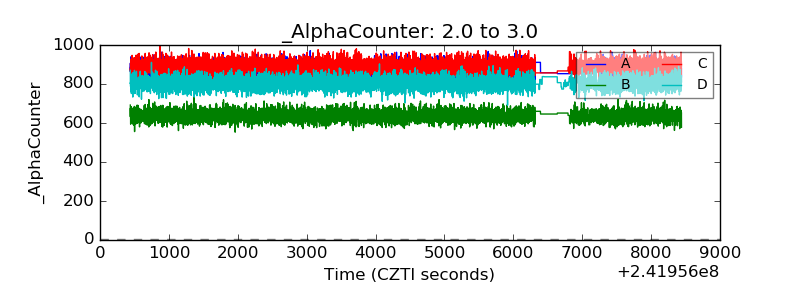 |
| _CPM_Rate | 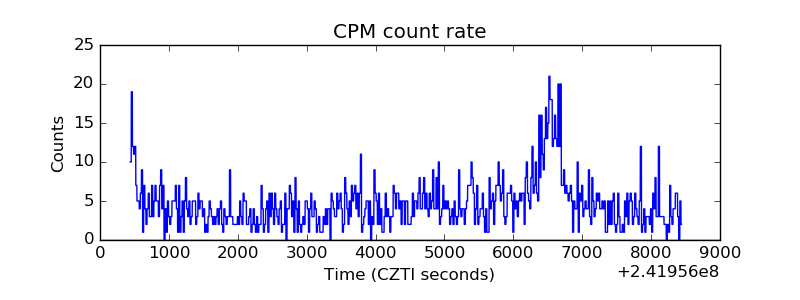 |
| CZT Counter | 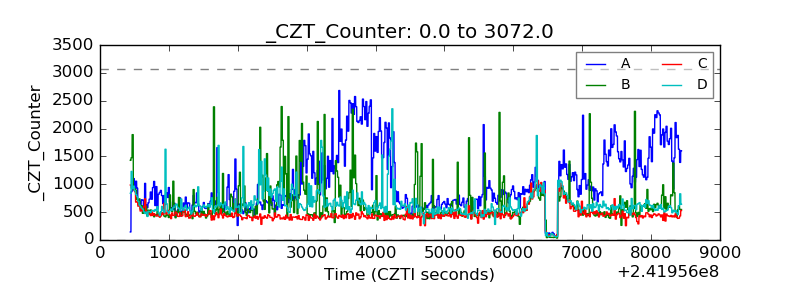 |
| +2.5 Volts monitor | 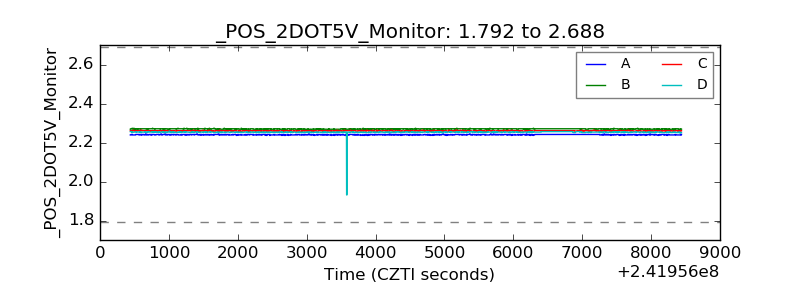 |
| +5 Volts monitor |  |
| _ROLL_ROT | 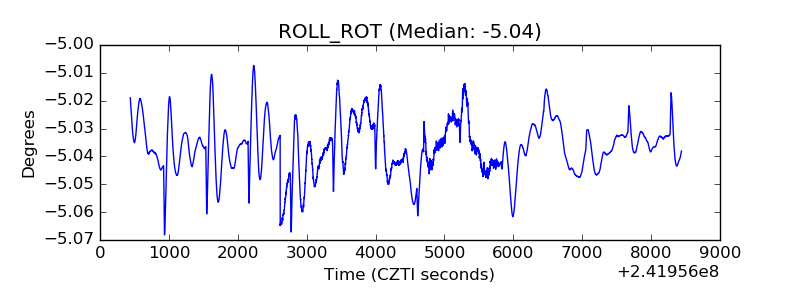 |
| _Roll_DEC | 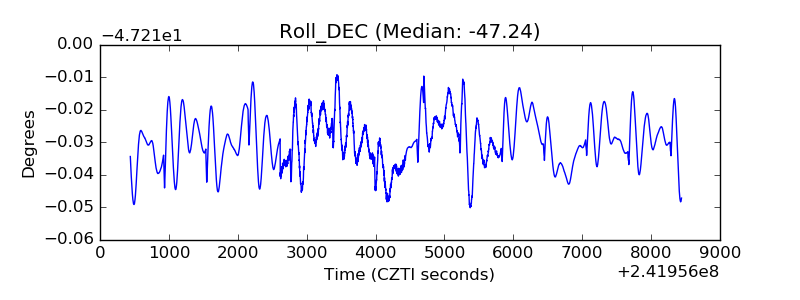 |
| _Roll_RA | 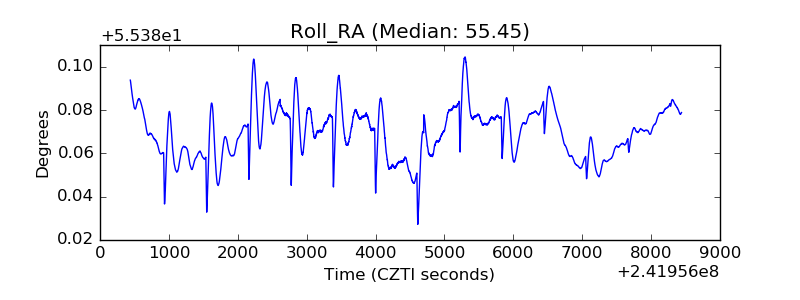 |
| Veto Counter | 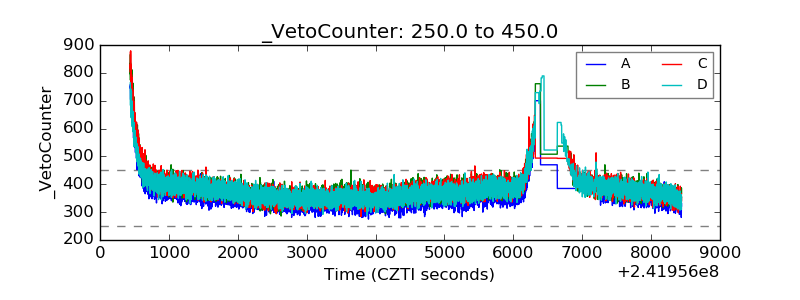 |