| Param | Original file | Final file |
|---|---|---|
| Filename | modeM0/AS1G07_066T01_9000001510_10426cztM0_level2.evt | modeM0/AS1G07_066T01_9000001510_10426cztM0_level2_quad_clean.evt |
| Size (bytes) | 552,646,080 | 62,271,360 |
| Size | 527.0 MB | 59.4 MB |
| Events in quadrant A | 5,247,247 | 232,155 |
| Events in quadrant B | 3,625,302 | 405,468 |
| Events in quadrant C | 3,088,243 | 431,637 |
| Events in quadrant D | 4,362,709 | 390,212 |
| Mode SS | |||
|---|---|---|---|
| Quadrant | BADHDUFLAG | Total packets | Discarded packets |
| A | 0 | 268 | 118 |
| B | 0 | 268 | 116 |
| C | 0 | 268 | 120 |
| D | 0 | 257 | 110 |
| Mode M9 | |||
|---|---|---|---|
| Quadrant | BADHDUFLAG | Total packets | Discarded packets |
| A | 0 | 4 | 2 |
| B | 0 | 4 | 2 |
| C | 0 | 4 | 2 |
| D | 0 | 4 | 2 |
| Mode M0 | |||
|---|---|---|---|
| Quadrant | BADHDUFLAG | Total packets | Discarded packets |
| A | 0 | 66498 | 48058 |
| B | 0 | 31897 | 16869 |
| C | 0 | 27617 | 13623 |
| D | 0 | 40726 | 23499 |
| Quadrant | Total seconds | Saturated seconds | Saturation percentage |
|---|---|---|---|
| A | 4208 | 648 | 15.399240% |
| B | 6530 | 184 | 2.817764% |
| C | 6786 | 76 | 1.119953% |
| D | 6577 | 160 | 2.432720% |
Noise dominated data is calculated using 1-second bins in cleaned event files. If a bin has >2000 counts, and if more than 50% of those come from <1% of pixels, then it is considered to be noise-dominated and hence unusable.
| Quadrant | # 1 sec bins | Bins with >0 counts | Bins with >2000 counts | High rate bins dominated by noise | Noise dominated (total time) | Noise dominated (detector-on time) | Marked lightcurve |
|---|---|---|---|---|---|---|---|
| A | 7963 | 4860 | 345 | 345 | 4.33% | 7.10% | 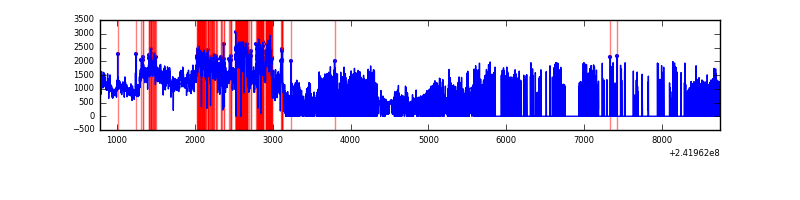 |
| B | 7965 | 7314 | 26 | 26 | 0.33% | 0.36% | 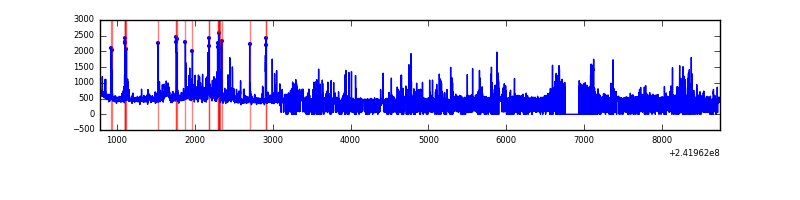 |
| C | 7965 | 7528 | 2 | 2 | 0.03% | 0.03% | 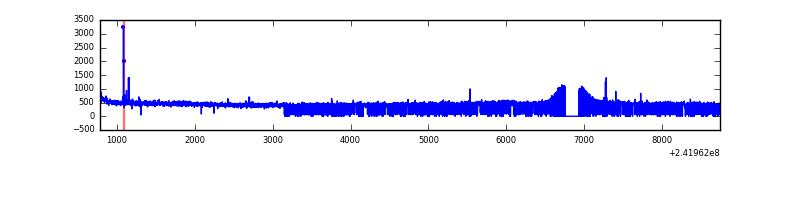 |
| D | 7963 | 7109 | 28 | 28 | 0.35% | 0.39% | 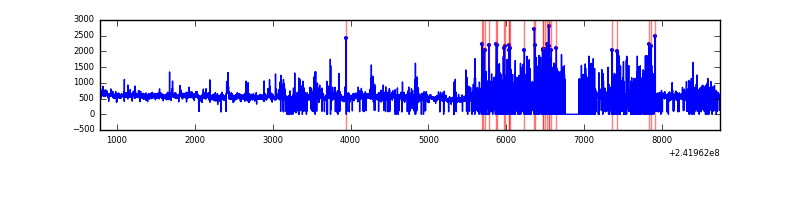 |
Top three noisy pixels from each quadrant. If the there are fewer than three noisy pixels in the level2.evt file, extra rows are filled as -1
| Pixel properties | Quadrant properties | ||||||
|---|---|---|---|---|---|---|---|
| Quadrant | DetID | PixID | Counts | Sigma | Mean | Median | Sigma |
| A | 13 | 251 | 3354690 | 34102.13 | 470 | 458 | 98.4 |
| A | 3 | 80 | 76640 | 774.53 | 470 | 458 | 98.4 |
| A | 0 | 226 | 4345 | 39.52 | 470 | 458 | 98.4 |
| B | 4 | 239 | 408895 | 2765.21 | 765 | 744 | 147.6 |
| B | 4 | 81 | 104848 | 705.3 | 765 | 744 | 147.6 |
| B | 0 | 214 | 35757 | 237.21 | 765 | 744 | 147.6 |
| C | 14 | 234 | 19434 | 102.3 | 782 | 785 | 182.3 |
| C | 8 | 128 | 8511 | 42.38 | 782 | 785 | 182.3 |
| C | 13 | 61 | 5817 | 27.6 | 782 | 785 | 182.3 |
| D | 8 | 195 | 659847 | 3666.98 | 746 | 728 | 179.7 |
| D | 2 | 33 | 462545 | 2569.3 | 746 | 728 | 179.7 |
| D | 1 | 20 | 158546 | 878.01 | 746 | 728 | 179.7 |
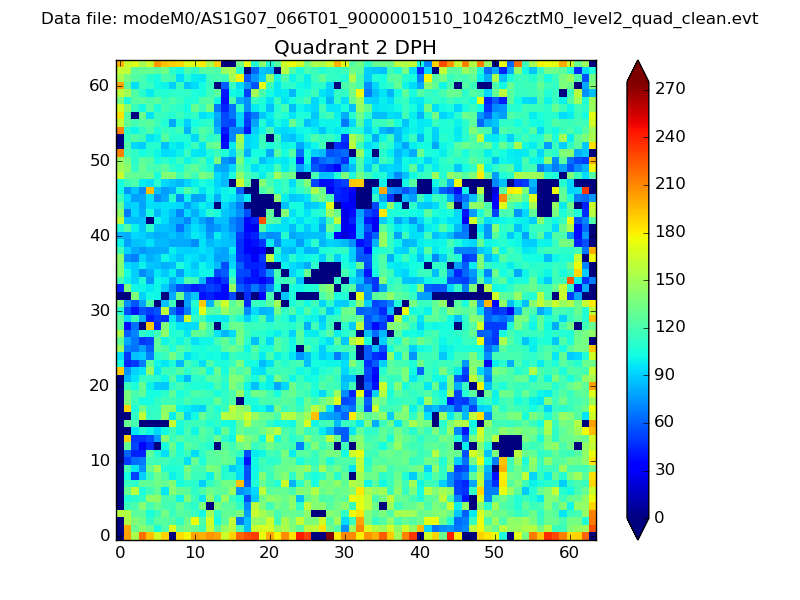
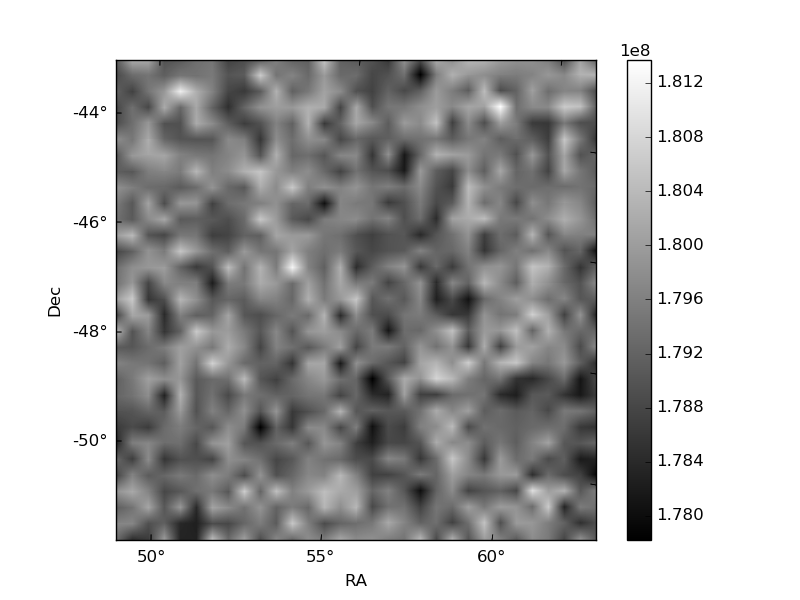
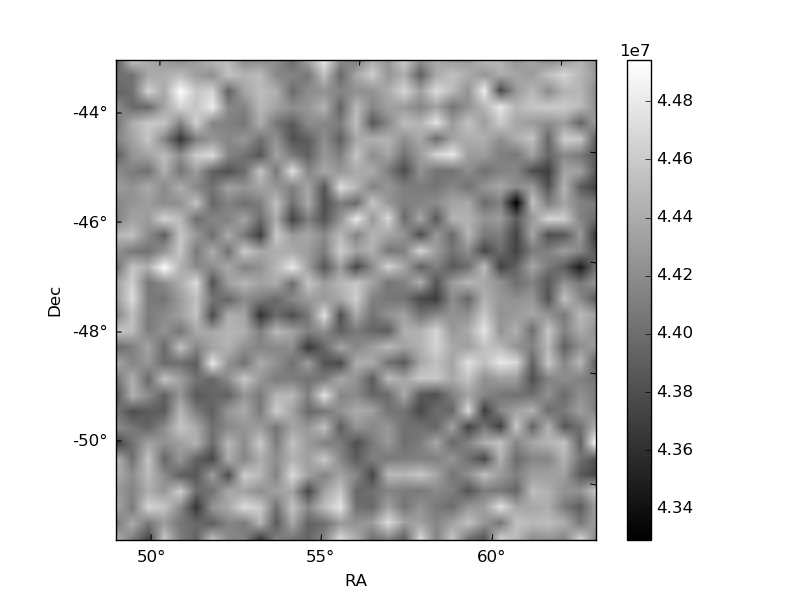
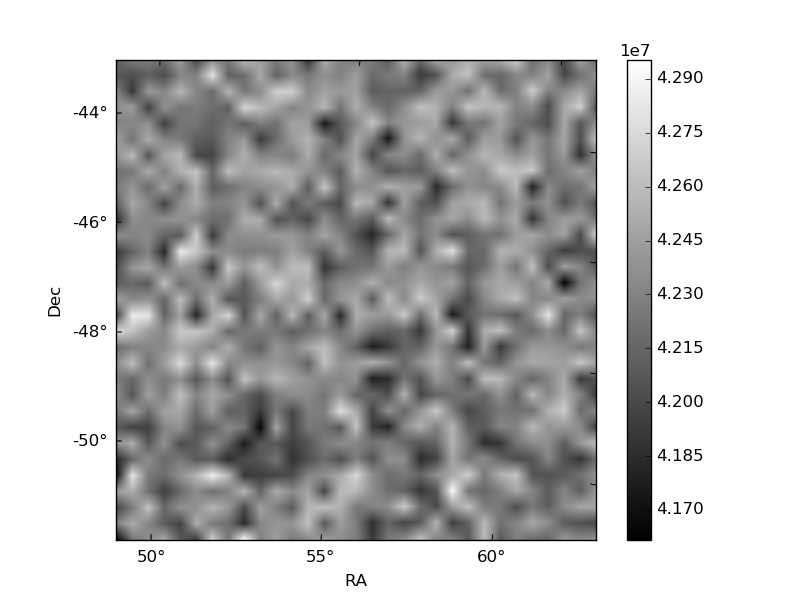
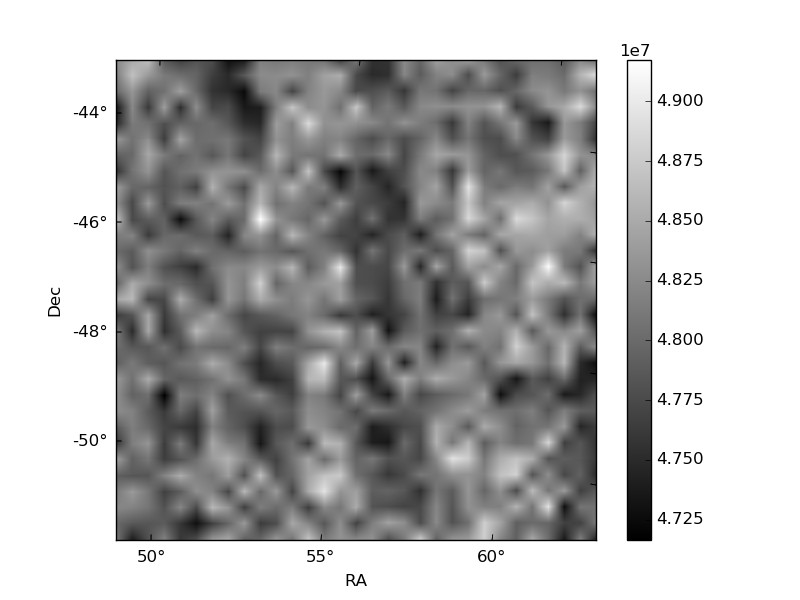
Histogram calculated using DETX and DETY for each event in the final _common_clean file
| Quadrant A | 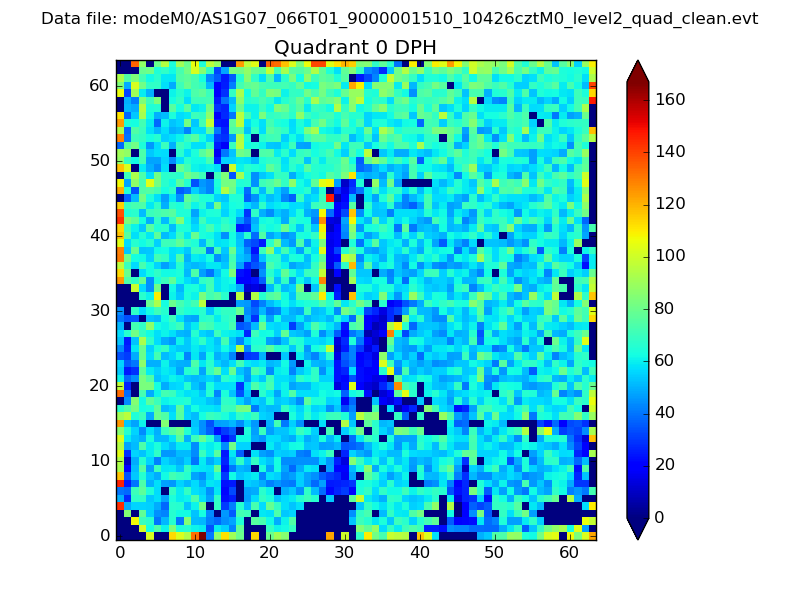 |
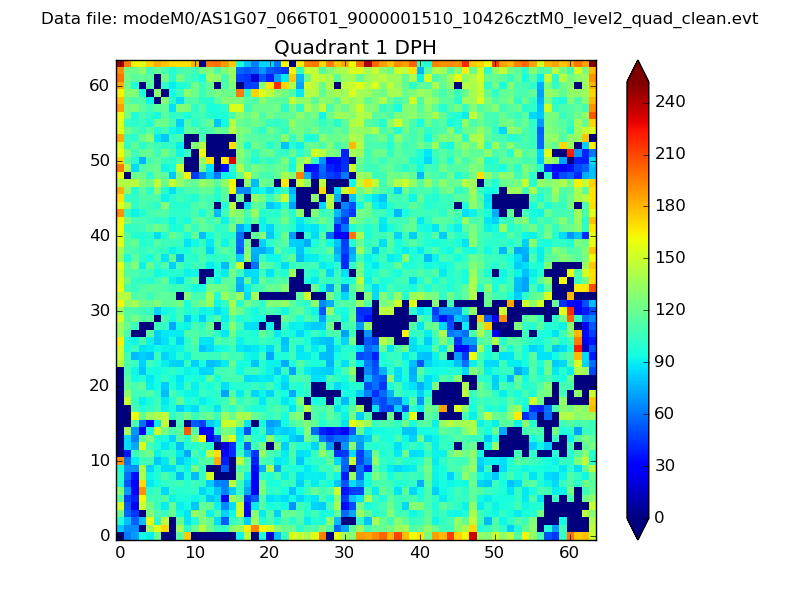 |
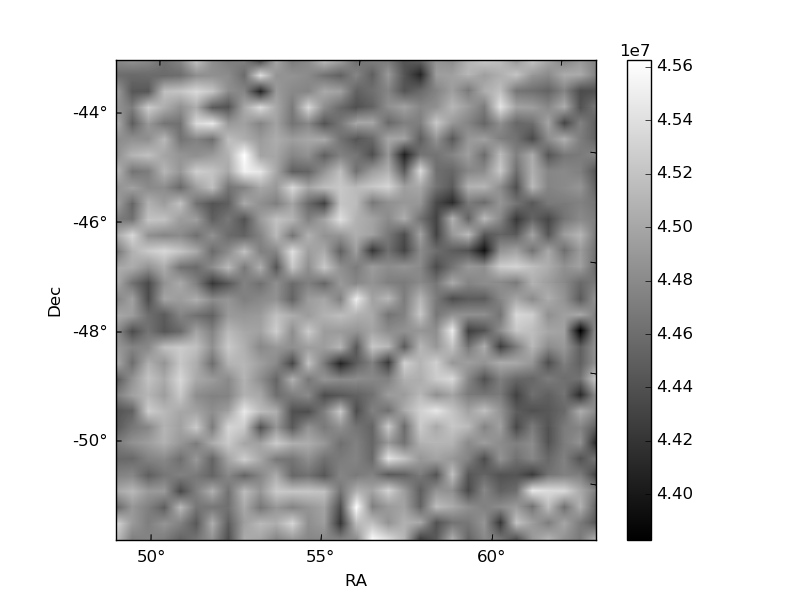
Quadrant B |
|---|---|---|---|
| Quadrant D | 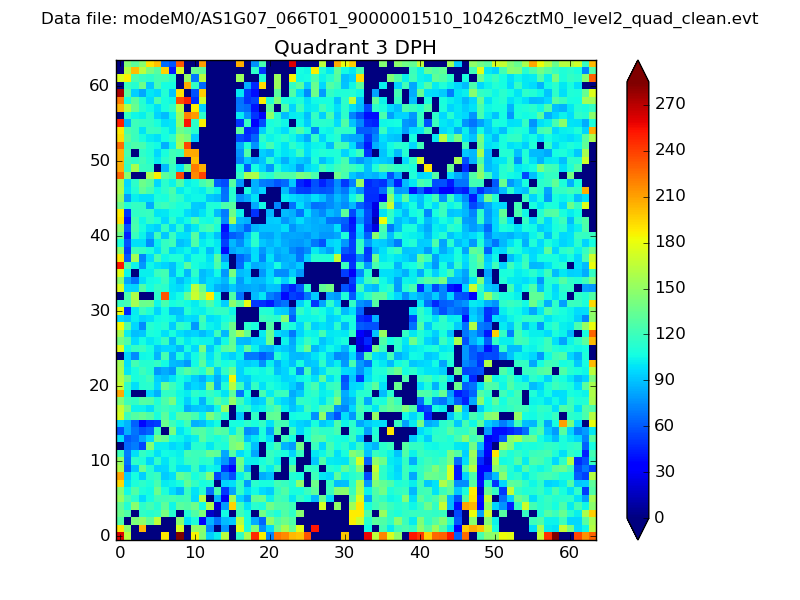 |
 |
Quadrant C |
| Plot type | Count rate plots | Images |
|---|---|---|
| Comparison with Poisson distribution Blue bars denote a histogram of data divided into 1 sec bins. Red curve is a Poisson curve with rate = median count rate of data. |
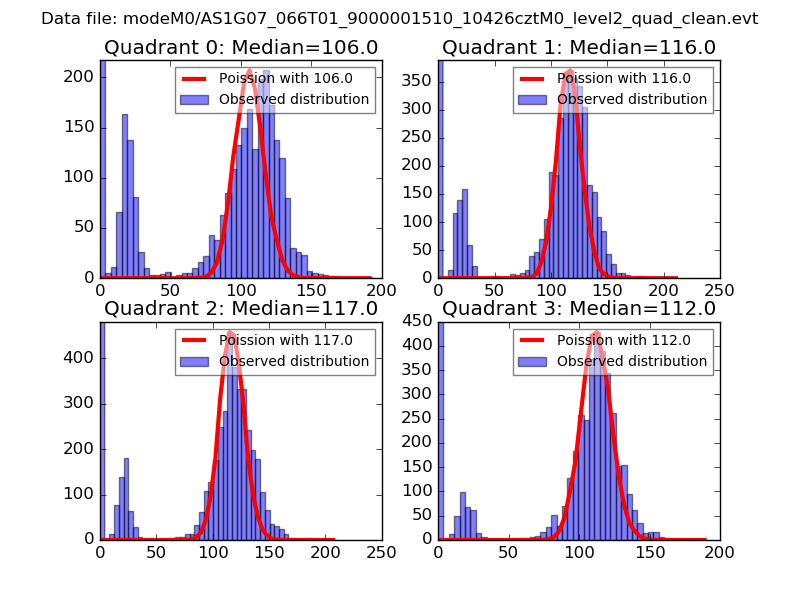 |
 |
| Quadrant-wise count rates Data is divided into 100 sec bins |
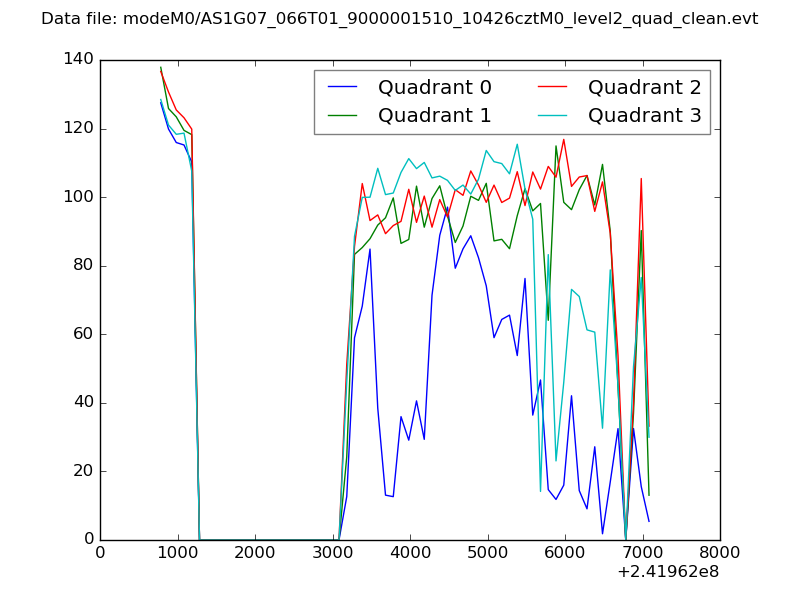 |
|
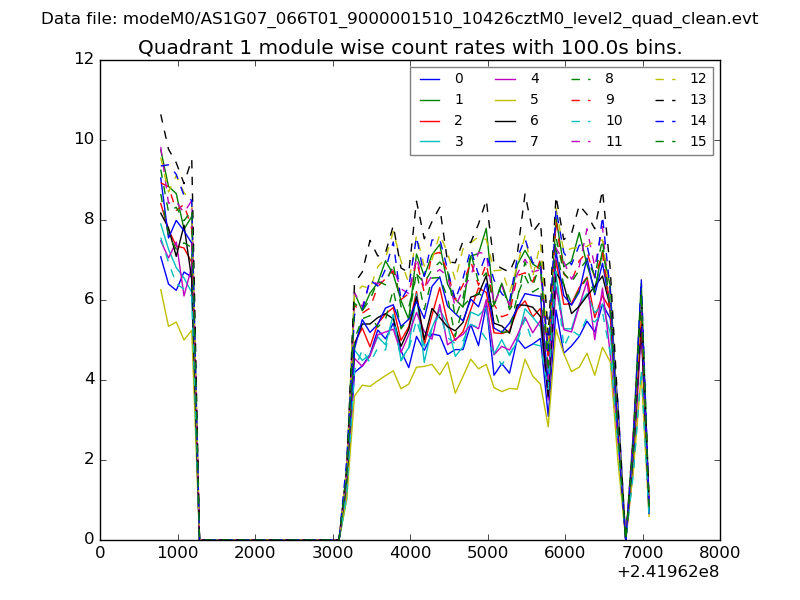
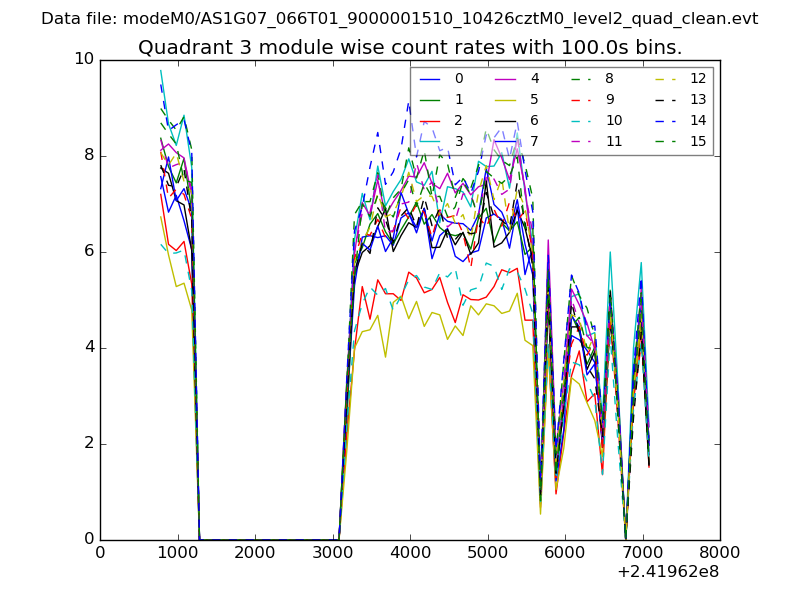
| Module-wise count rates for Quadrant A Data is divided into 100 sec bins |
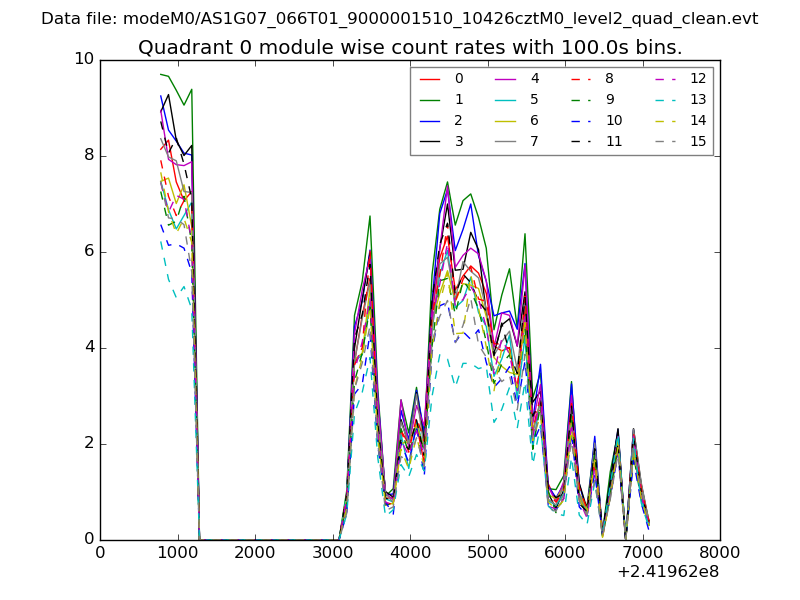 |
 |
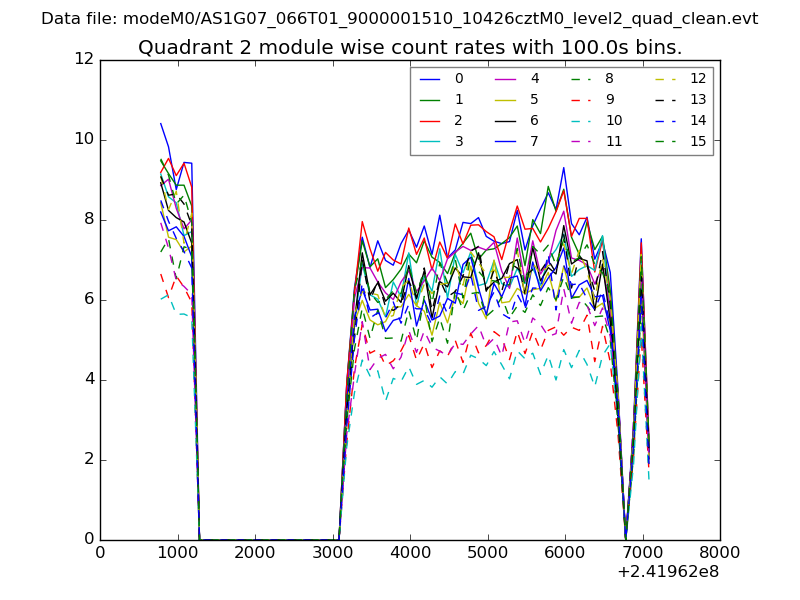
| Module-wise count rates for Quadrant B Data is divided into 100 sec bins |
 |
 |
| Module-wise count rates for Quadrant C Data is divided into 100 sec bins |
 |
 |
| Module-wise count rates for Quadrant D Data is divided into 100 sec bins |
 |
 |
| Parameter | Plot |
|---|---|
| CZT HV Monitor | 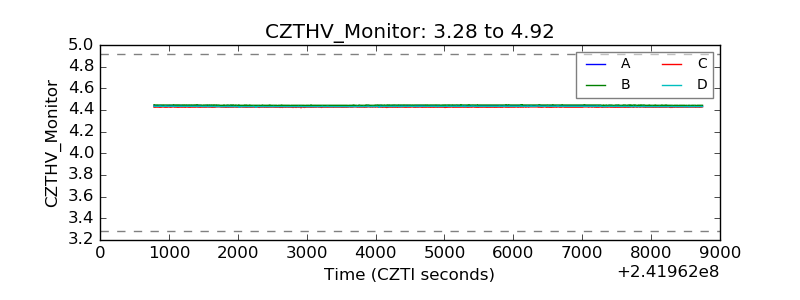 |
| D_VDD | 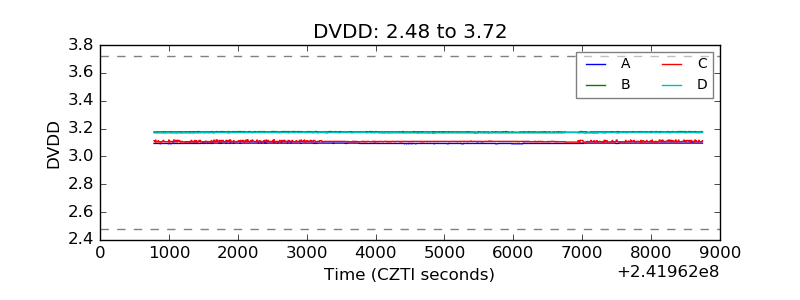 |
| Temperature 1 | 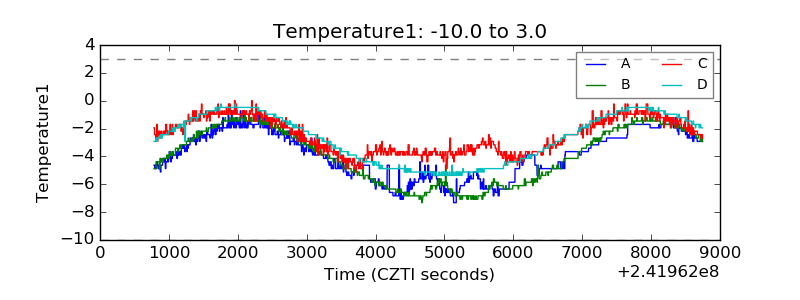 |
| Veto HV Monitor | 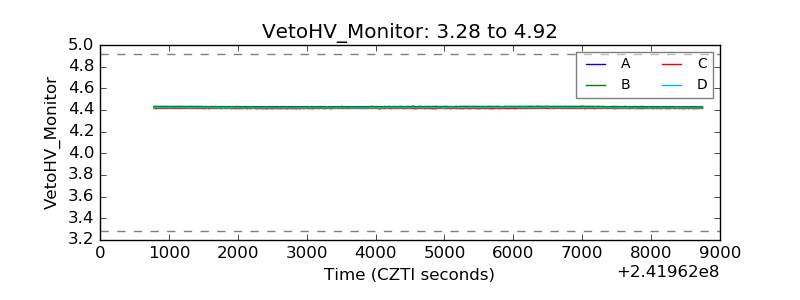 |
| Veto LLD | 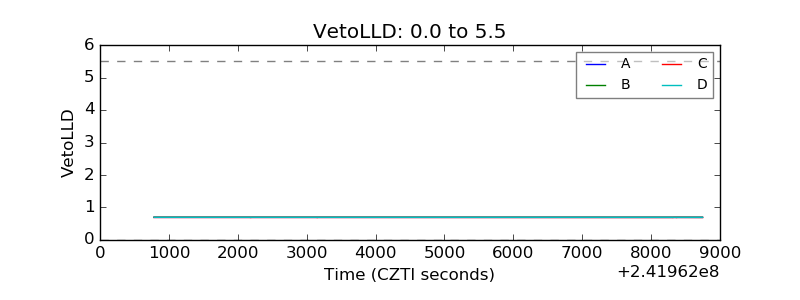 |
| Alpha Counter | 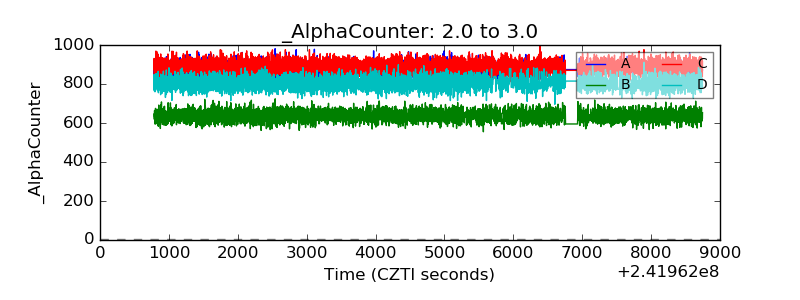 |
| _CPM_Rate | 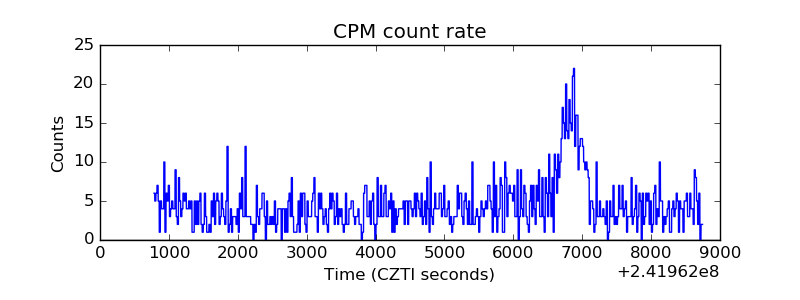 |
| CZT Counter | 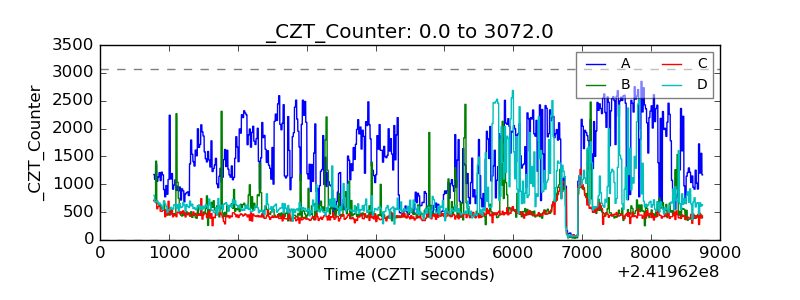 |
| +2.5 Volts monitor |  |
| +5 Volts monitor |  |
| _ROLL_ROT | 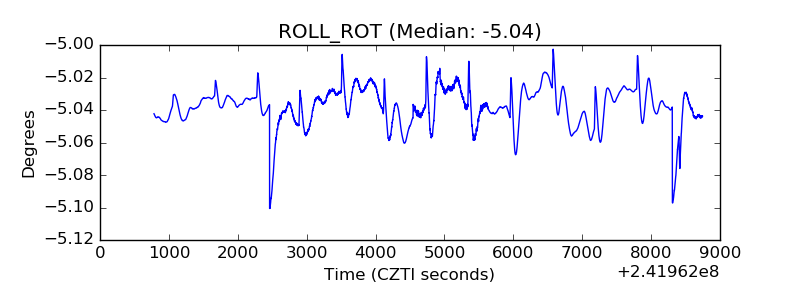 |
| _Roll_DEC | 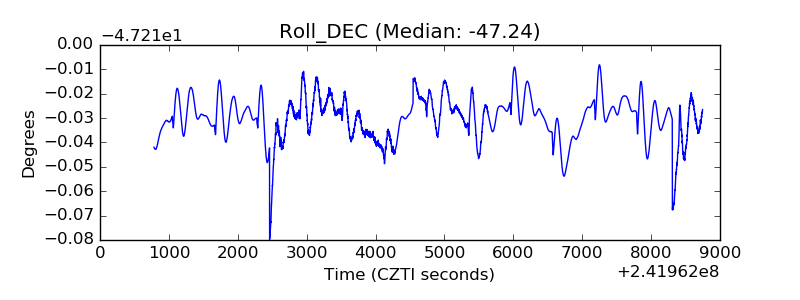 |
| _Roll_RA | 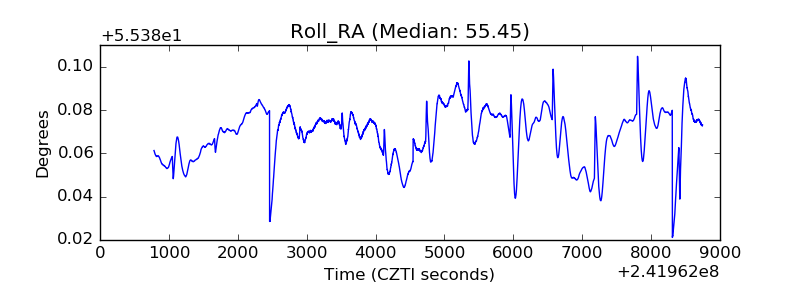 |
| Veto Counter | 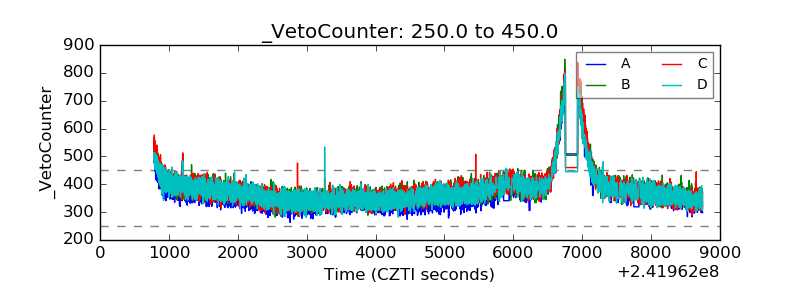 |