| Param | Original file | Final file |
|---|---|---|
| Filename | modeM0/AS1G07_066T01_9000001510_10427cztM0_level2.evt | modeM0/AS1G07_066T01_9000001510_10427cztM0_level2_quad_clean.evt |
| Size (bytes) | 395,058,240 | 59,336,640 |
| Size | 376.8 MB | 56.6 MB |
| Events in quadrant A | 2,726,173 | 297,950 |
| Events in quadrant B | 2,802,683 | 343,885 |
| Events in quadrant C | 2,520,698 | 393,323 |
| Events in quadrant D | 3,576,831 | 413,726 |
| Mode SS | |||
|---|---|---|---|
| Quadrant | BADHDUFLAG | Total packets | Discarded packets |
| A | 0 | 264 | 137 |
| B | 0 | 264 | 138 |
| C | 0 | 264 | 140 |
| D | 0 | 255 | 134 |
| Mode M9 | |||
|---|---|---|---|
| Quadrant | BADHDUFLAG | Total packets | Discarded packets |
| A | 0 | 7 | 3 |
| B | 0 | 8 | 4 |
| C | 0 | 8 | 4 |
| D | 0 | 6 | 2 |
| Mode M0 | |||
|---|---|---|---|
| Quadrant | BADHDUFLAG | Total packets | Discarded packets |
| A | 0 | 50841 | 40395 |
| B | 0 | 36312 | 24934 |
| C | 0 | 26600 | 15220 |
| D | 0 | 34991 | 20647 |
| Quadrant | Total seconds | Saturated seconds | Saturation percentage |
|---|---|---|---|
| A | 3651 | 321 | 8.792112% |
| B | 4749 | 137 | 2.884818% |
| C | 5519 | 36 | 0.652292% |
| D | 5635 | 73 | 1.295475% |
Noise dominated data is calculated using 1-second bins in cleaned event files. If a bin has >2000 counts, and if more than 50% of those come from <1% of pixels, then it is considered to be noise-dominated and hence unusable.
| Quadrant | # 1 sec bins | Bins with >0 counts | Bins with >2000 counts | High rate bins dominated by noise | Noise dominated (total time) | Noise dominated (detector-on time) | Marked lightcurve |
|---|---|---|---|---|---|---|---|
| A | 7030 | 4456 | 147 | 147 | 2.09% | 3.30% | 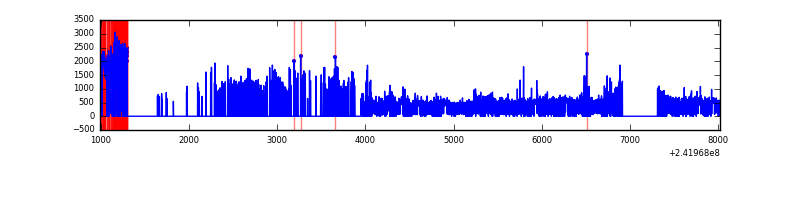 |
| B | 7029 | 5743 | 12 | 12 | 0.17% | 0.21% | 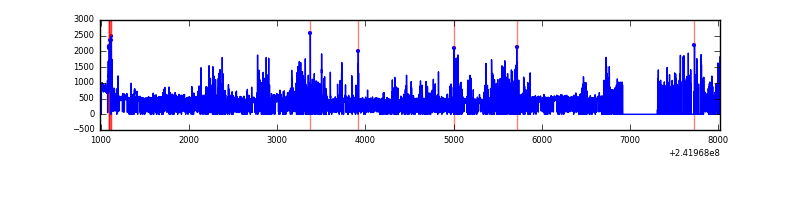 |
| C | 7030 | 6398 | 4 | 4 | 0.06% | 0.06% | 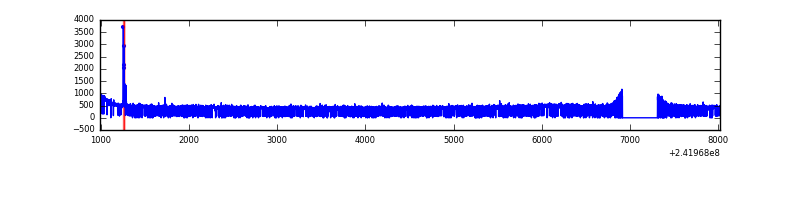 |
| D | 7030 | 6214 | 4 | 4 | 0.06% | 0.06% | 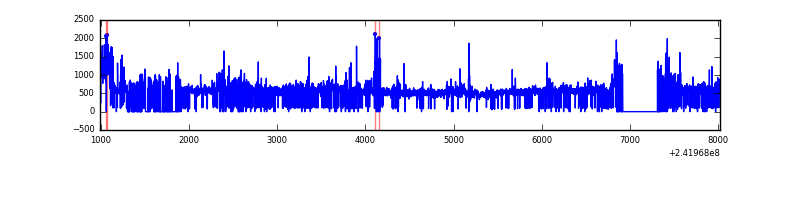 |
Top three noisy pixels from each quadrant. If the there are fewer than three noisy pixels in the level2.evt file, extra rows are filled as -1
| Pixel properties | Quadrant properties | ||||||
|---|---|---|---|---|---|---|---|
| Quadrant | DetID | PixID | Counts | Sigma | Mean | Median | Sigma |
| A | 13 | 251 | 1026142 | 11604.48 | 421 | 412 | 88.4 |
| A | 3 | 80 | 60759 | 682.73 | 421 | 412 | 88.4 |
| A | 15 | 174 | 10016 | 108.65 | 421 | 412 | 88.4 |
| B | 4 | 239 | 514408 | 4719.49 | 555 | 539 | 108.9 |
| B | 4 | 81 | 31505 | 284.4 | 555 | 539 | 108.9 |
| B | 0 | 214 | 27972 | 251.95 | 555 | 539 | 108.9 |
| C | 14 | 234 | 21436 | 140.33 | 635 | 638 | 148.2 |
| C | 8 | 128 | 9910 | 62.56 | 635 | 638 | 148.2 |
| C | 8 | 112 | 5407 | 32.18 | 635 | 638 | 148.2 |
| D | 8 | 195 | 499758 | 3233.77 | 640 | 621 | 154.4 |
| D | 1 | 20 | 227201 | 1467.95 | 640 | 621 | 154.4 |
| D | 2 | 33 | 180169 | 1163.24 | 640 | 621 | 154.4 |
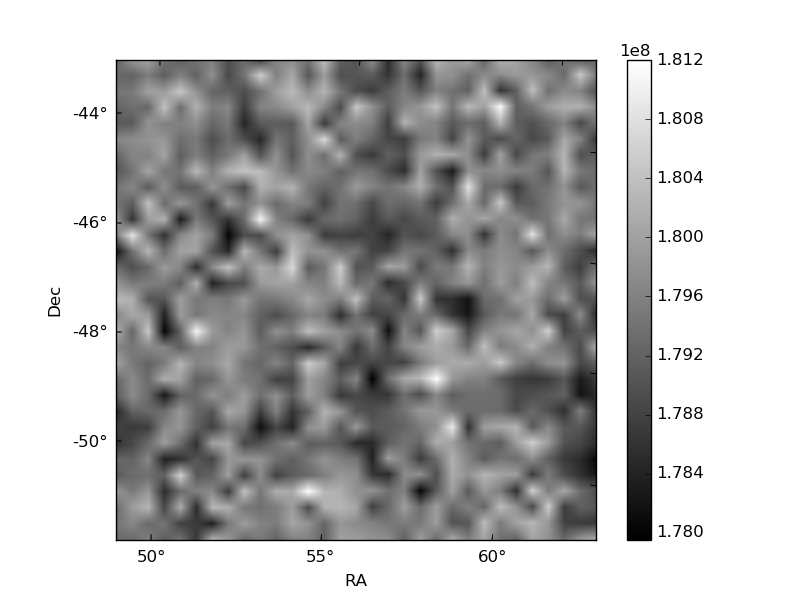
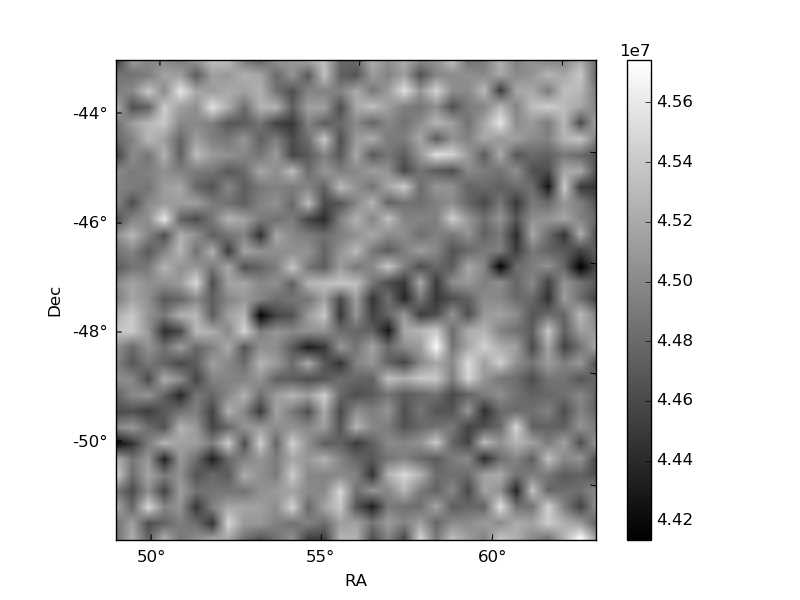
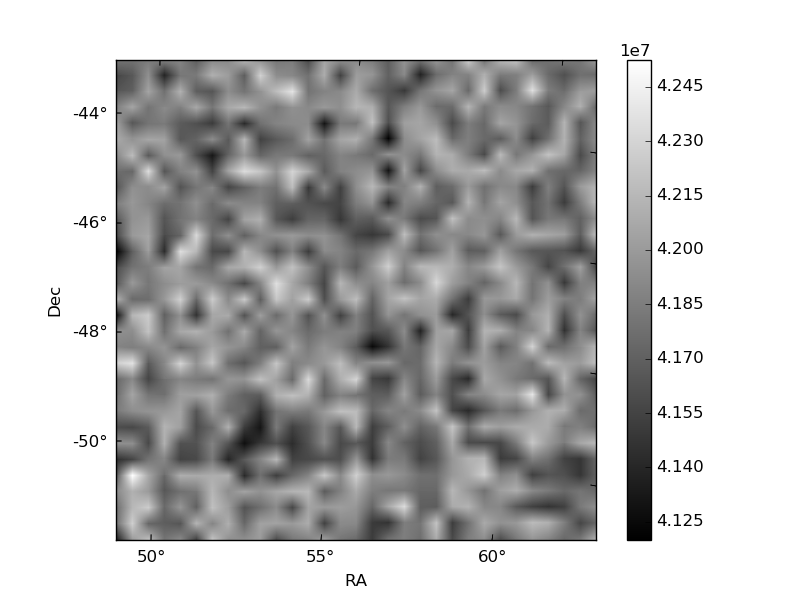
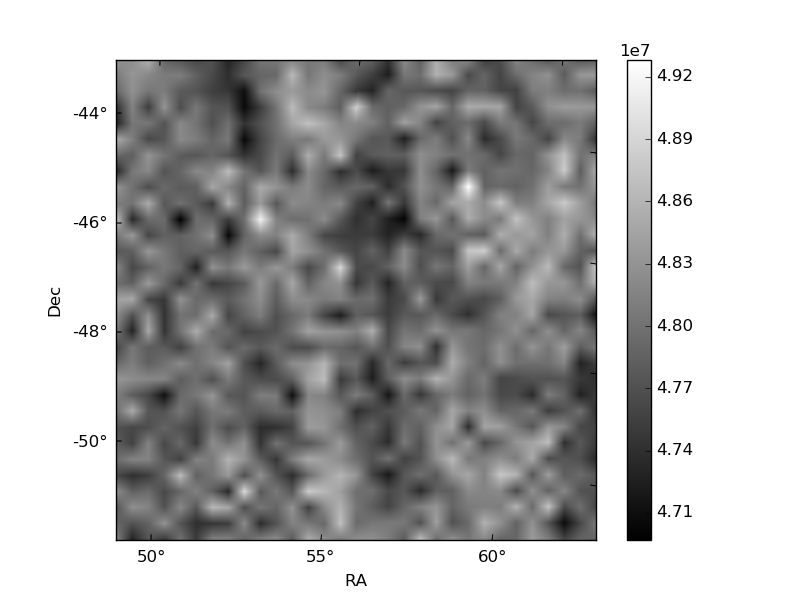
Histogram calculated using DETX and DETY for each event in the final _common_clean file
| Quadrant A | 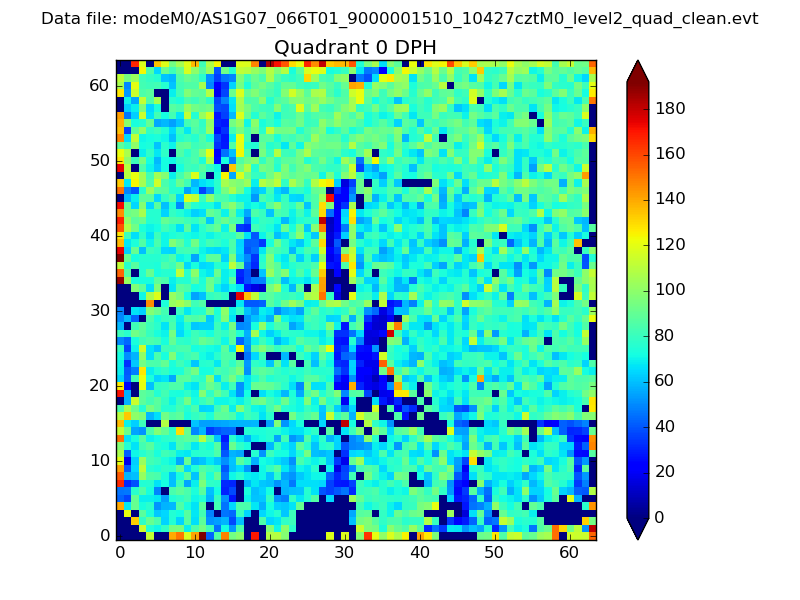 |
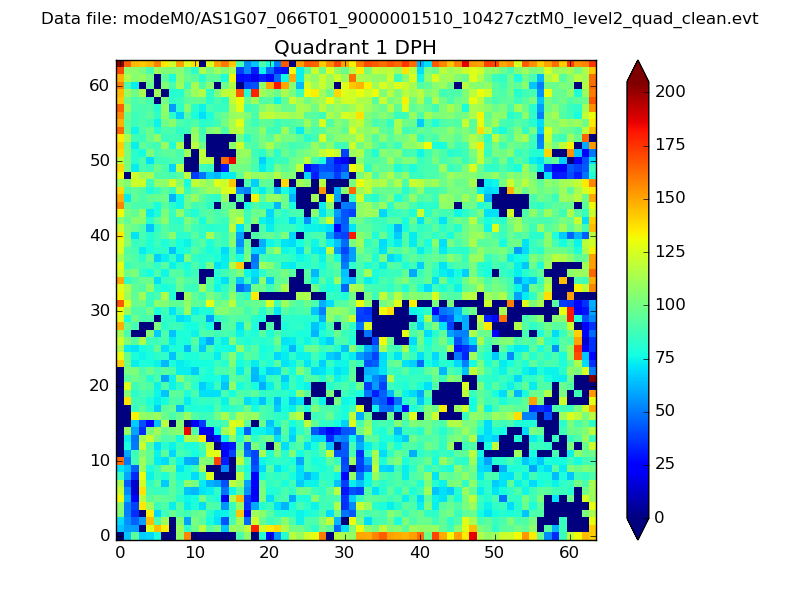 |
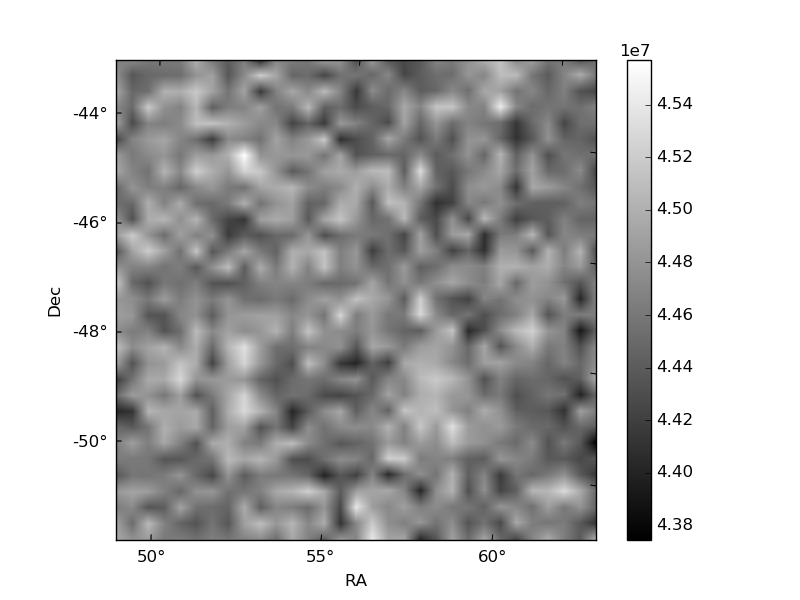
Quadrant B |
|---|---|---|---|
| Quadrant D | 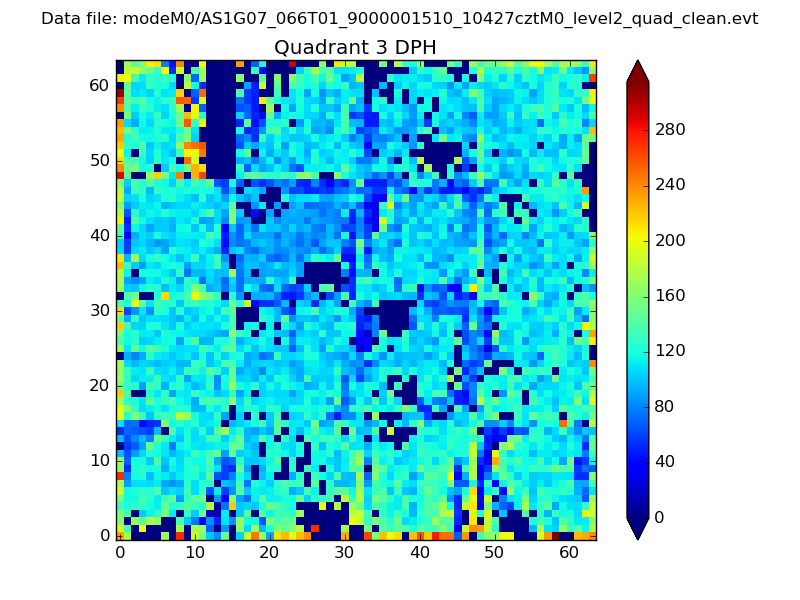 |
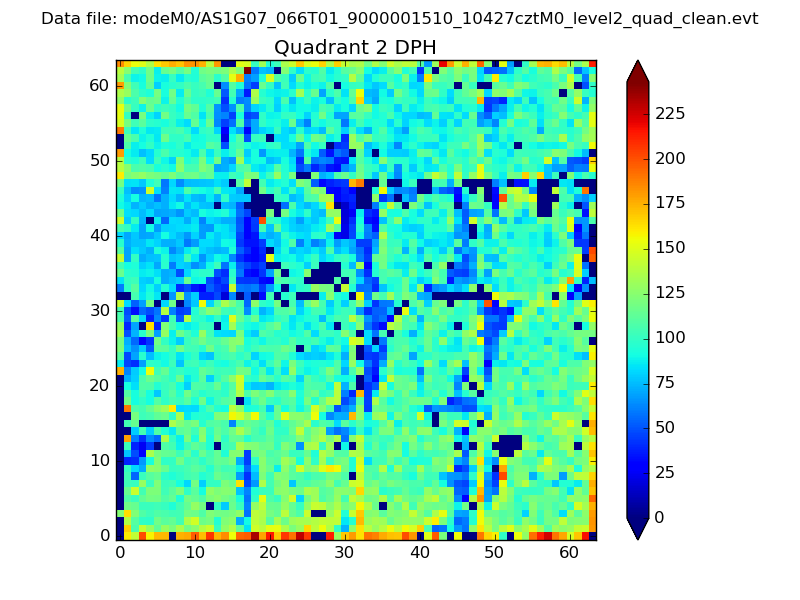 |
Quadrant C |
| Plot type | Count rate plots | Images |
|---|---|---|
| Comparison with Poisson distribution Blue bars denote a histogram of data divided into 1 sec bins. Red curve is a Poisson curve with rate = median count rate of data. |
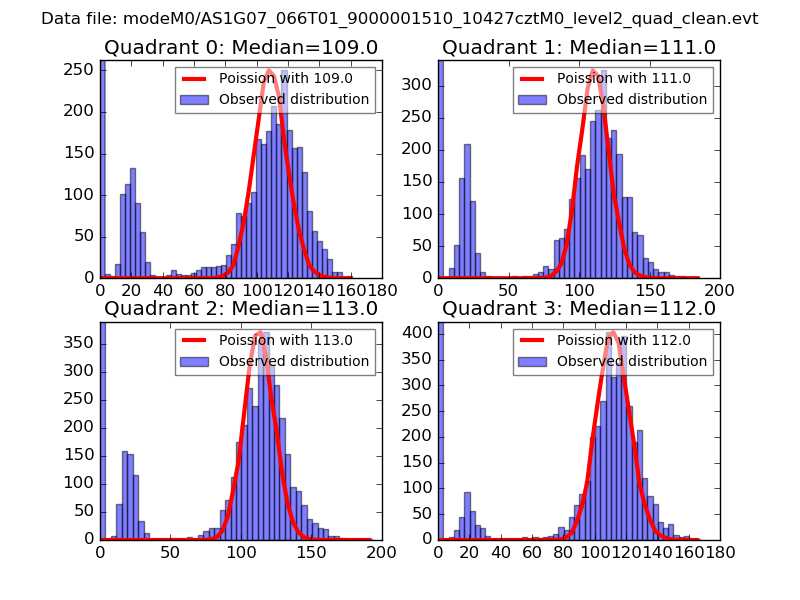 |
 |
| Quadrant-wise count rates Data is divided into 100 sec bins |
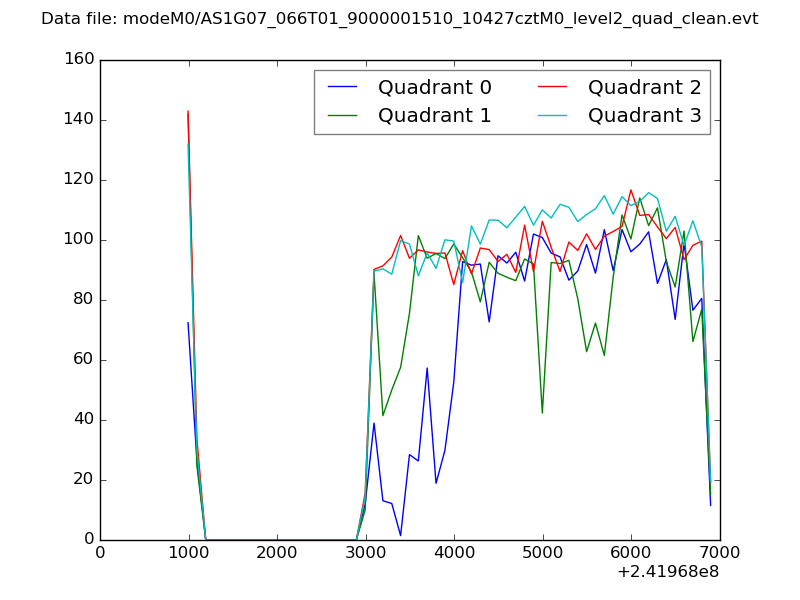 |
|
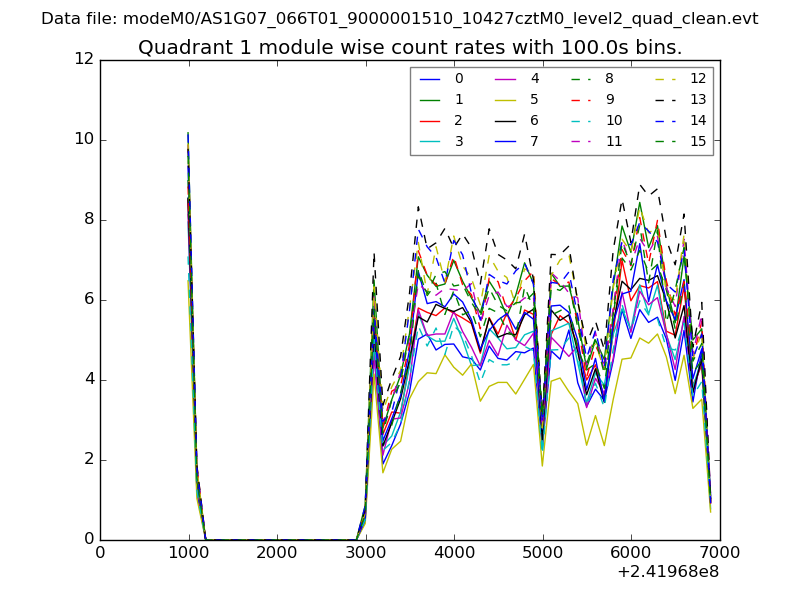
| Module-wise count rates for Quadrant A Data is divided into 100 sec bins |
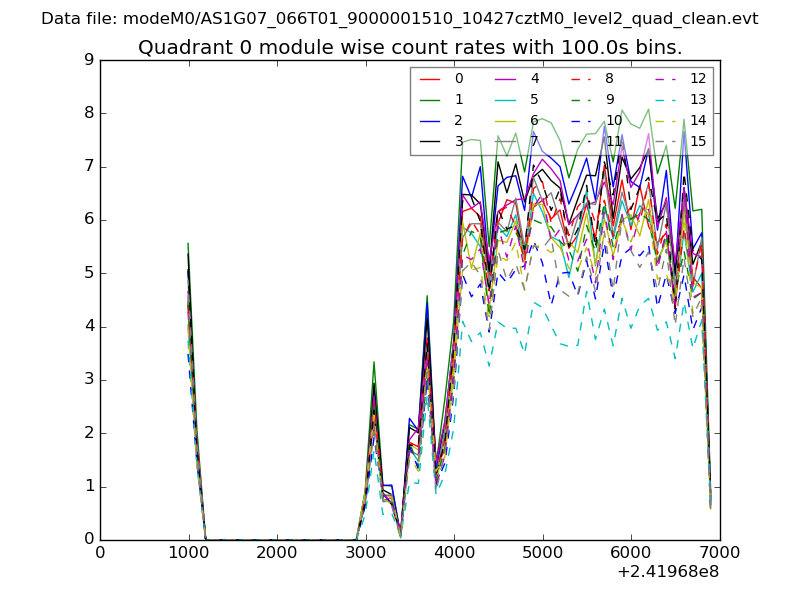 |
 |
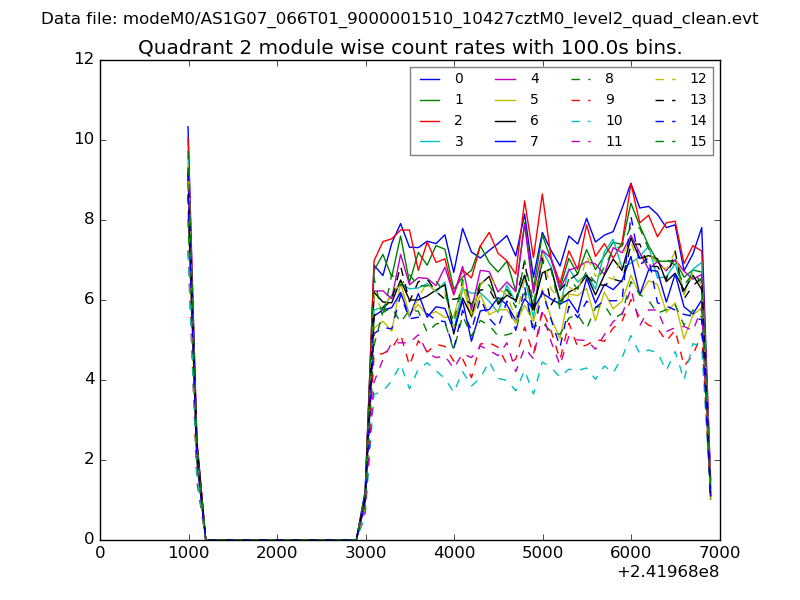
| Module-wise count rates for Quadrant B Data is divided into 100 sec bins |
 |
 |
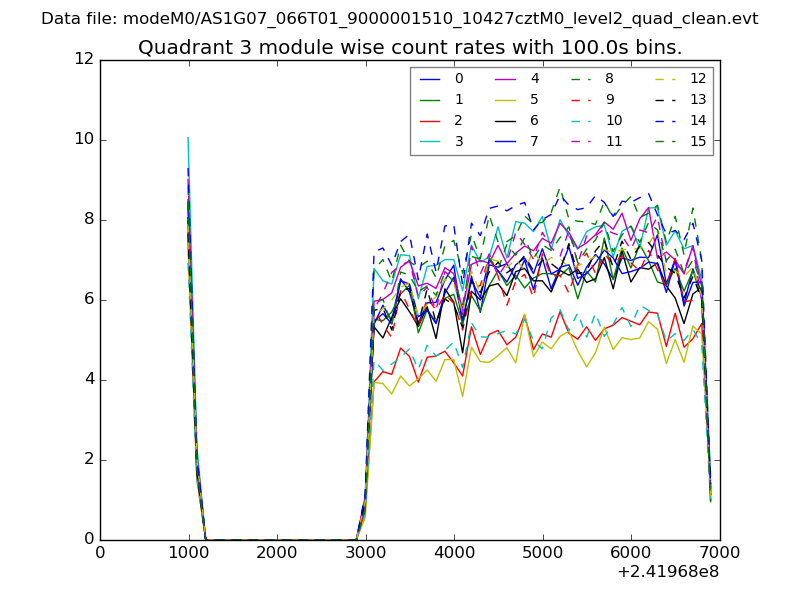
| Module-wise count rates for Quadrant C Data is divided into 100 sec bins |
 |
 |
| Module-wise count rates for Quadrant D Data is divided into 100 sec bins |
 |
 |
| Parameter | Plot |
|---|---|
| CZT HV Monitor | 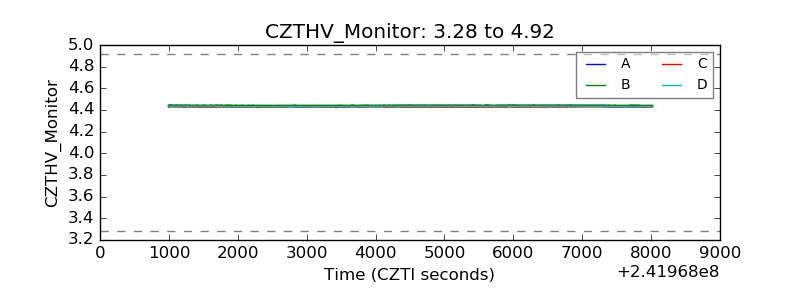 |
| D_VDD | 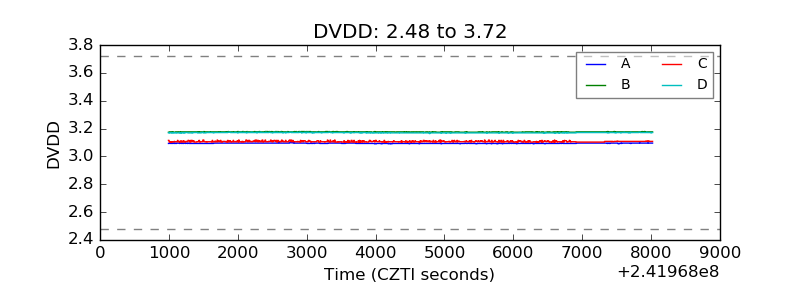 |
| Temperature 1 | 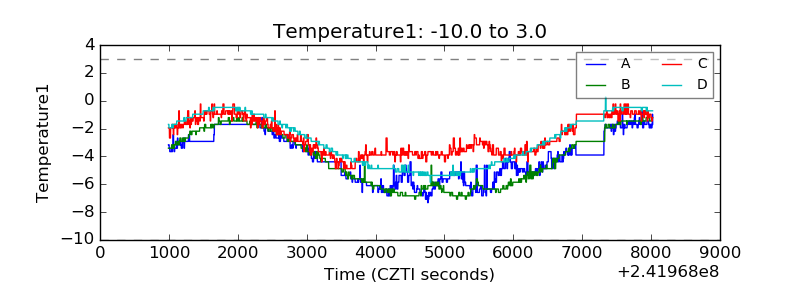 |
| Veto HV Monitor | 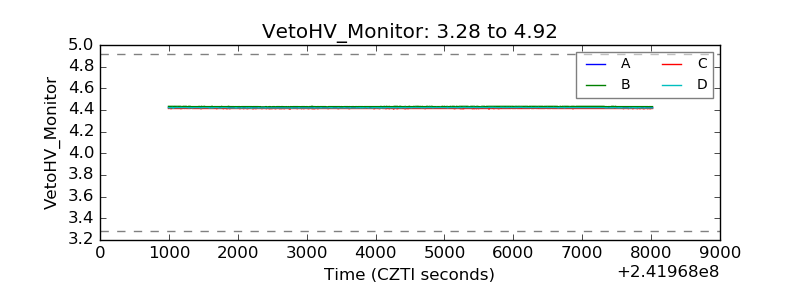 |
| Veto LLD | 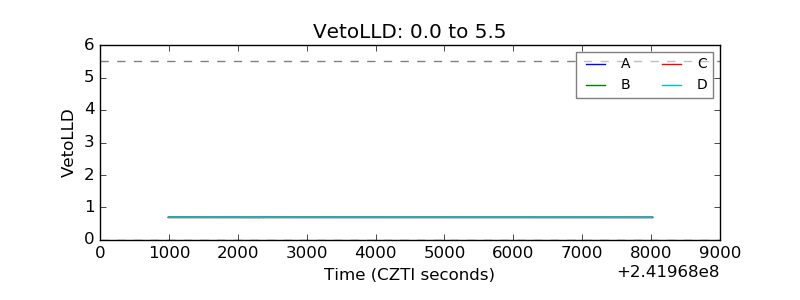 |
| Alpha Counter | 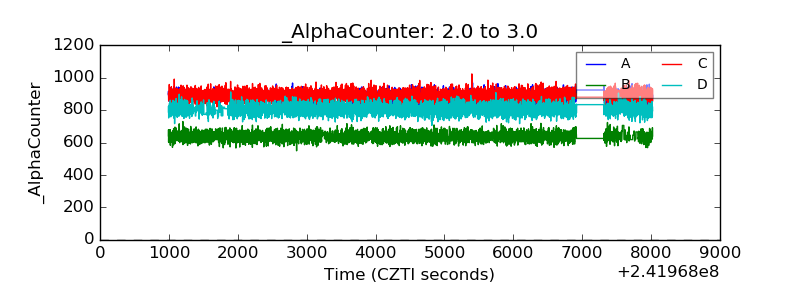 |
| _CPM_Rate | 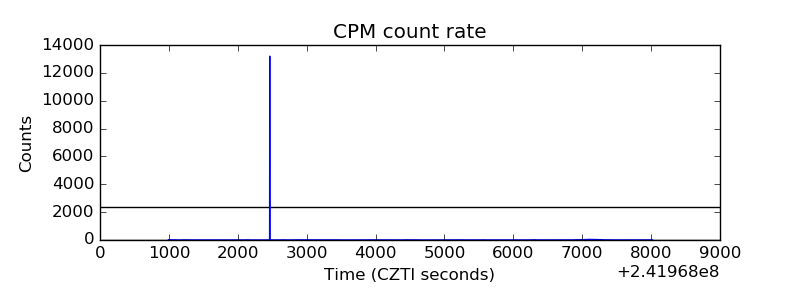 |
| CZT Counter | 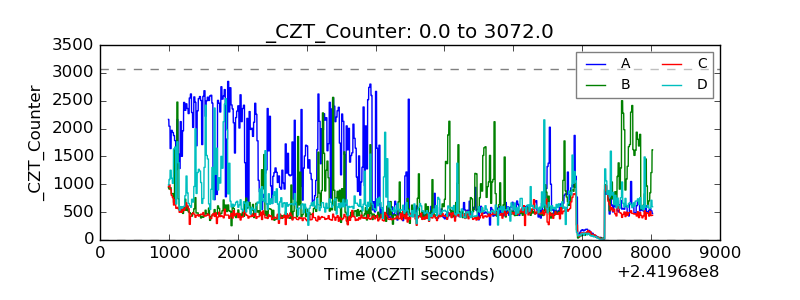 |
| +2.5 Volts monitor |  |
| +5 Volts monitor | 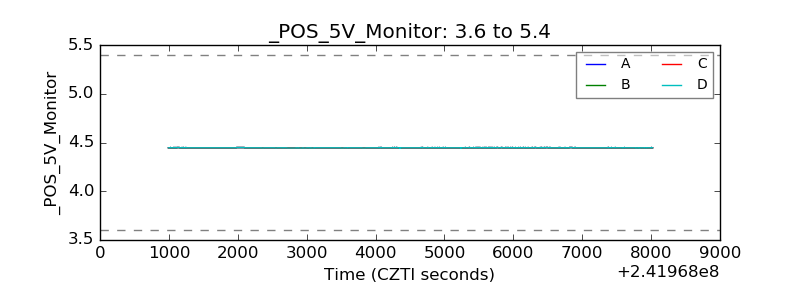 |
| _ROLL_ROT | 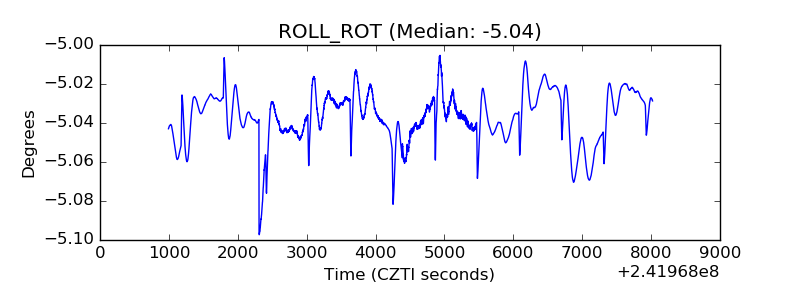 |
| _Roll_DEC | 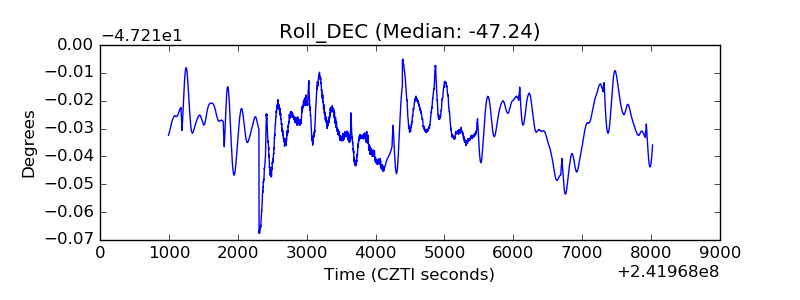 |
| _Roll_RA | 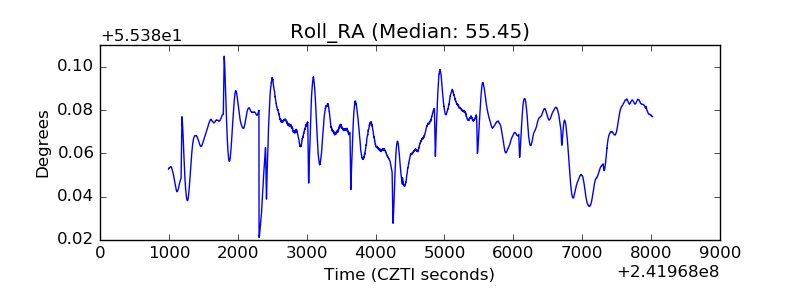 |
| Veto Counter | 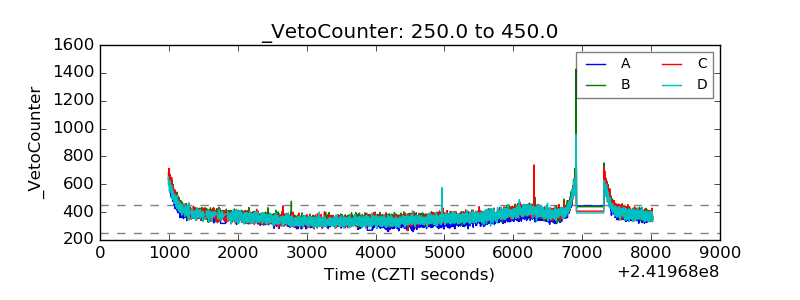 |