| Param | Original file | Final file |
|---|---|---|
| Filename | modeM0/AS1G07_066T01_9000001510_10431cztM0_level2.evt | modeM0/AS1G07_066T01_9000001510_10431cztM0_level2_quad_clean.evt |
| Size (bytes) | 602,199,360 | 87,727,680 |
| Size | 574.3 MB | 83.7 MB |
| Events in quadrant A | 5,754,355 | 550,554 |
| Events in quadrant B | 4,347,584 | 543,956 |
| Events in quadrant C | 3,100,949 | 584,715 |
| Events in quadrant D | 4,589,863 | 519,187 |
| Mode SS | |||
|---|---|---|---|
| Quadrant | BADHDUFLAG | Total packets | Discarded packets |
| A | 0 | 156 | 16 |
| B | 0 | 156 | 19 |
| C | 0 | 156 | 19 |
| D | 0 | 156 | 16 |
| Mode M9 | |||
|---|---|---|---|
| Quadrant | BADHDUFLAG | Total packets | Discarded packets |
| A | 0 | 19 | 0 |
| B | 0 | 19 | 0 |
| C | 0 | 19 | 0 |
| D | 0 | 19 | 0 |
| Mode M0 | |||
|---|---|---|---|
| Quadrant | BADHDUFLAG | Total packets | Discarded packets |
| A | 0 | 23522 | 2237 |
| B | 0 | 21158 | 3935 |
| C | 0 | 15765 | 2008 |
| D | 0 | 21308 | 3220 |
| Quadrant | Total seconds | Saturated seconds | Saturation percentage |
|---|---|---|---|
| A | 6622 | 608 | 9.181516% |
| B | 6440 | 421 | 6.537267% |
| C | 6700 | 41 | 0.611940% |
| D | 6466 | 145 | 2.242499% |
Noise dominated data is calculated using 1-second bins in cleaned event files. If a bin has >2000 counts, and if more than 50% of those come from <1% of pixels, then it is considered to be noise-dominated and hence unusable.
| Quadrant | # 1 sec bins | Bins with >0 counts | Bins with >2000 counts | High rate bins dominated by noise | Noise dominated (total time) | Noise dominated (detector-on time) | Marked lightcurve |
|---|---|---|---|---|---|---|---|
| A | 8777 | 6796 | 421 | 421 | 4.80% | 6.19% | 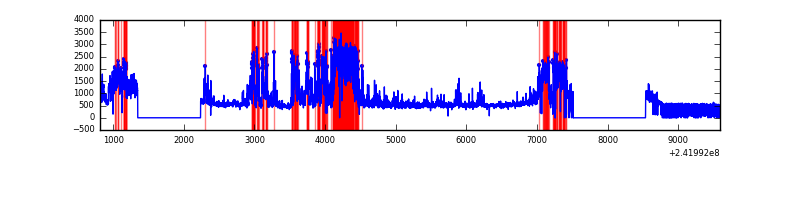 |
| B | 8778 | 6586 | 233 | 233 | 2.65% | 3.54% | 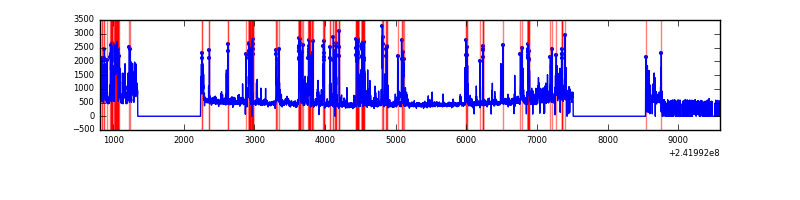 |
| C | 8778 | 6832 | 9 | 9 | 0.10% | 0.13% | 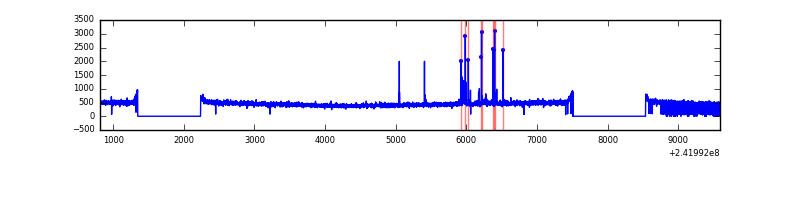 |
| D | 8778 | 6633 | 94 | 94 | 1.07% | 1.42% | 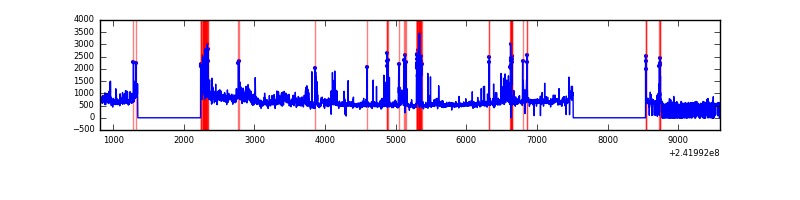 |
Top three noisy pixels from each quadrant. If the there are fewer than three noisy pixels in the level2.evt file, extra rows are filled as -1
| Pixel properties | Quadrant properties | ||||||
|---|---|---|---|---|---|---|---|
| Quadrant | DetID | PixID | Counts | Sigma | Mean | Median | Sigma |
| A | 13 | 251 | 2605181 | 16585.69 | 767 | 750 | 157.0 |
| A | 3 | 80 | 168789 | 1070.12 | 767 | 750 | 157.0 |
| A | 13 | 253 | 12604 | 75.49 | 767 | 750 | 157.0 |
| B | 4 | 239 | 1245900 | 8736.69 | 750 | 732 | 142.5 |
| B | 0 | 214 | 69392 | 481.75 | 750 | 732 | 142.5 |
| B | 0 | 85 | 50244 | 347.4 | 750 | 732 | 142.5 |
| C | 14 | 234 | 62337 | 341.76 | 778 | 783 | 180.1 |
| C | 13 | 61 | 5836 | 28.06 | 778 | 783 | 180.1 |
| C | 14 | 67 | 2647 | 10.35 | 778 | 783 | 180.1 |
| D | 8 | 195 | 573232 | 3223.26 | 736 | 717 | 177.6 |
| D | 1 | 255 | 454099 | 2552.54 | 736 | 717 | 177.6 |
| D | 13 | 104 | 172957 | 969.71 | 736 | 717 | 177.6 |
Histogram calculated using DETX and DETY for each event in the final _common_clean file
| Quadrant A | 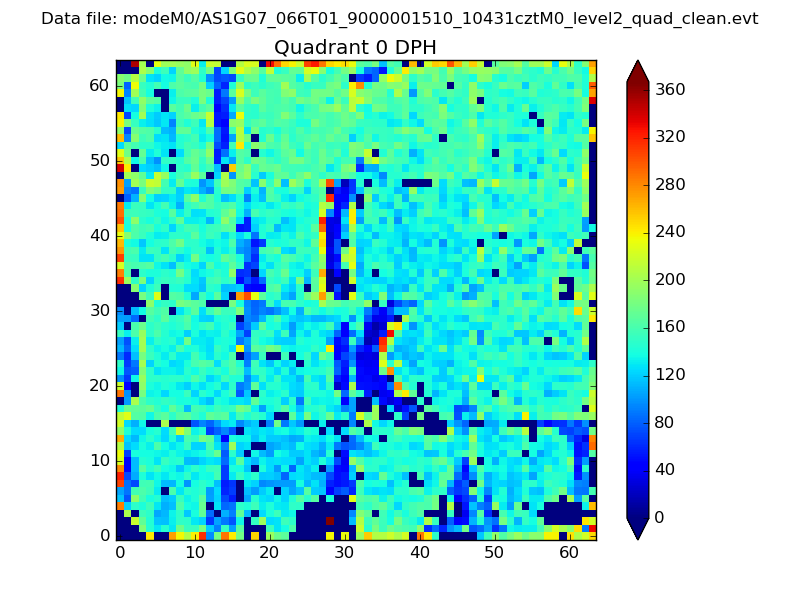 |
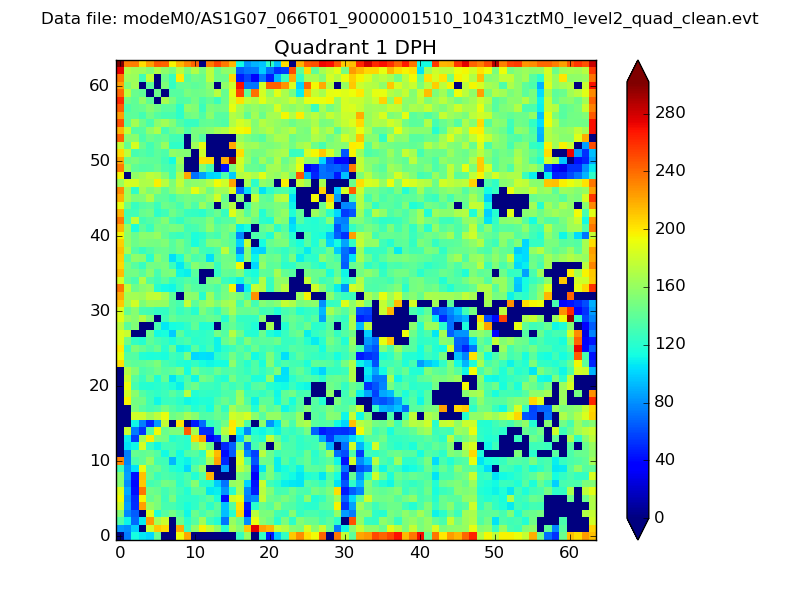 |
Quadrant B |
|---|---|---|---|
| Quadrant D | 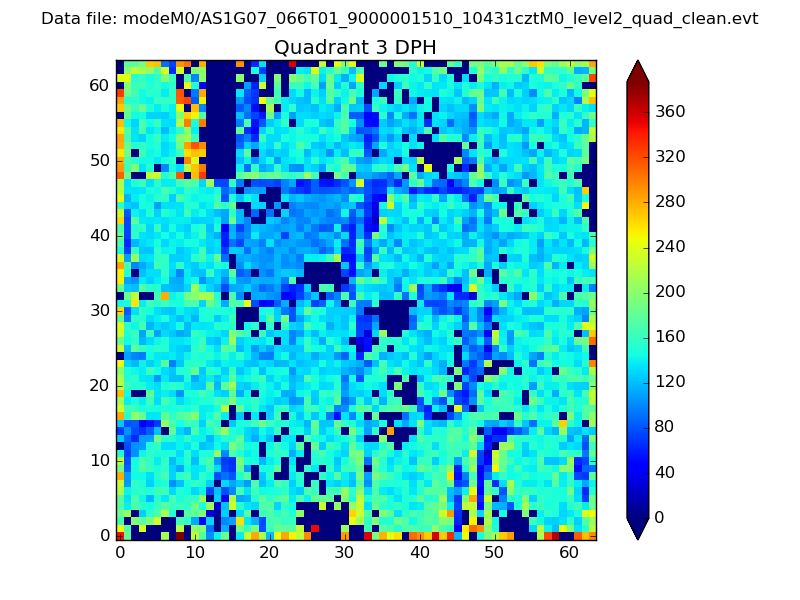 |
 |
Quadrant C |
| Plot type | Count rate plots | Images |
|---|---|---|
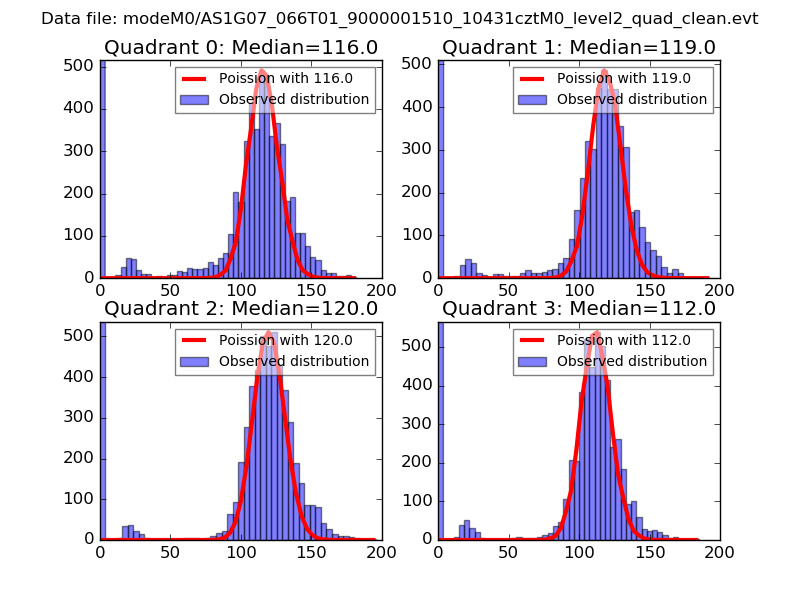
| Comparison with Poisson distribution Blue bars denote a histogram of data divided into 1 sec bins. Red curve is a Poisson curve with rate = median count rate of data. |
 |
 |
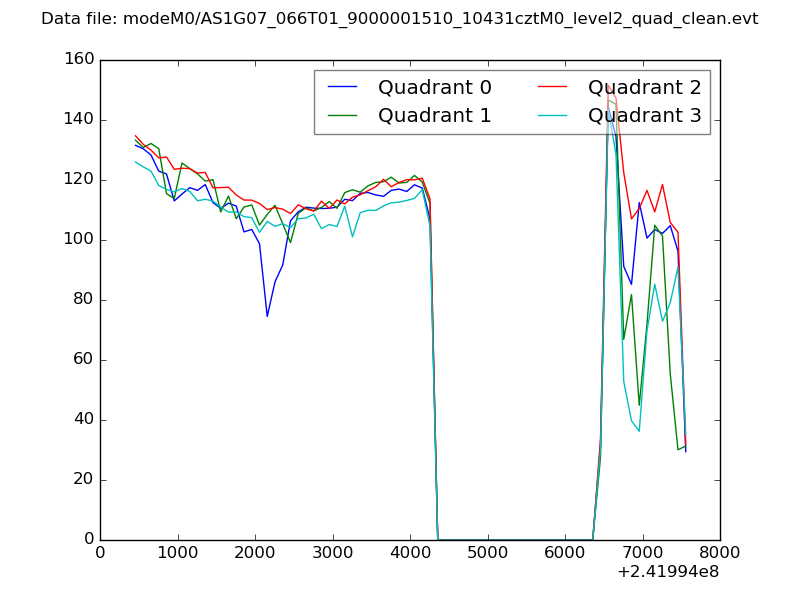
| Quadrant-wise count rates Data is divided into 100 sec bins |
 |
|
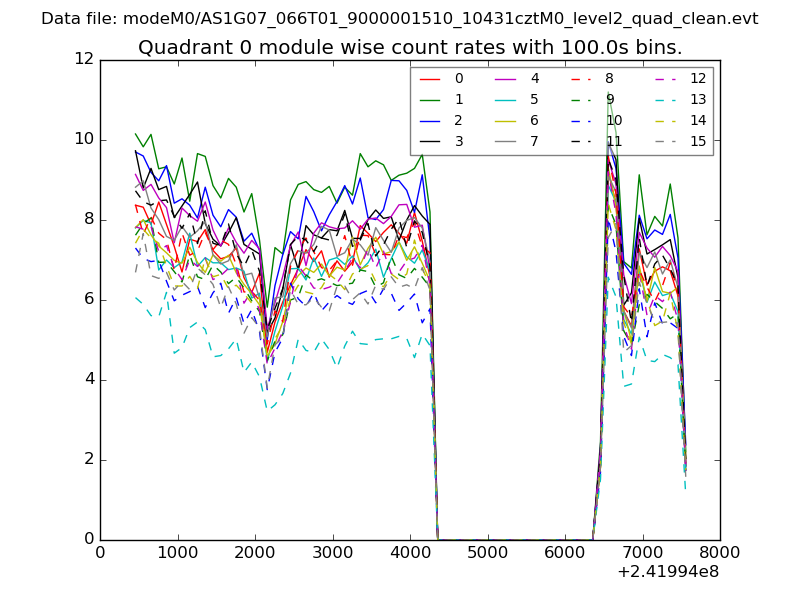
| Module-wise count rates for Quadrant A Data is divided into 100 sec bins |
 |
 |
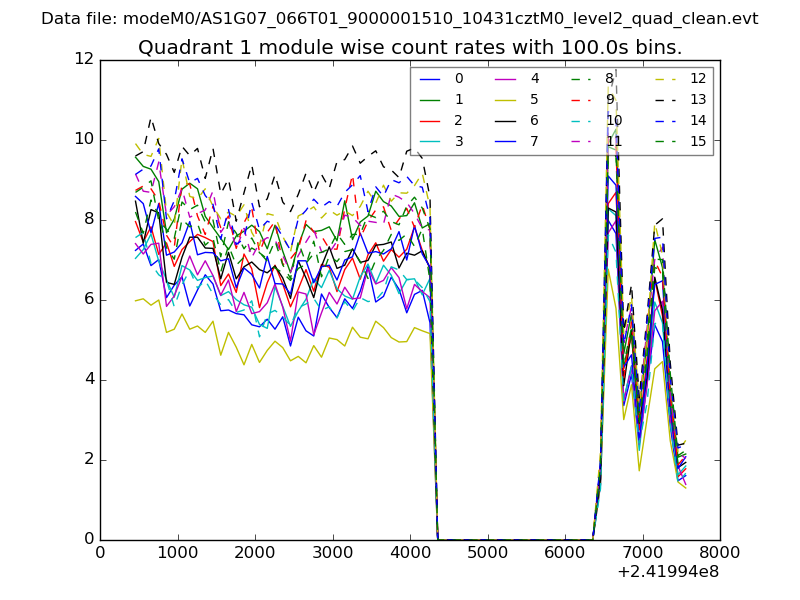
| Module-wise count rates for Quadrant B Data is divided into 100 sec bins |
 |
 |
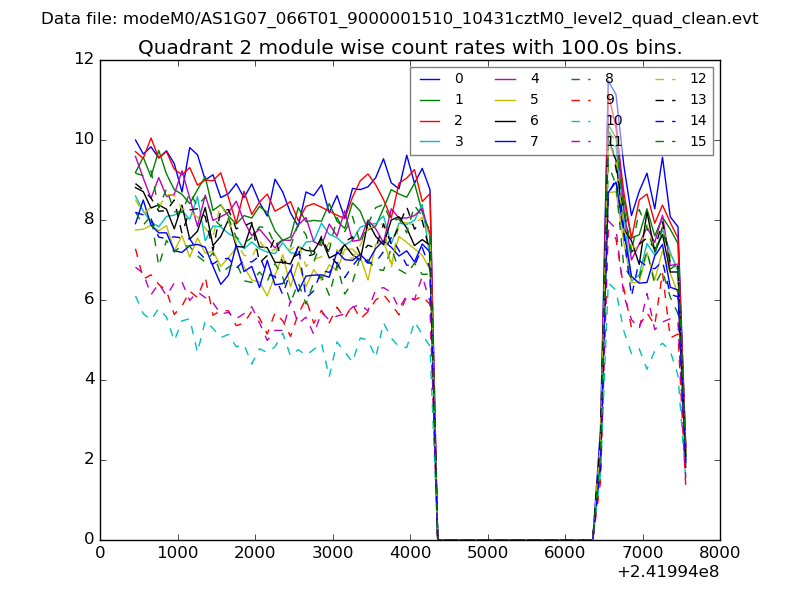
| Module-wise count rates for Quadrant C Data is divided into 100 sec bins |
 |
 |
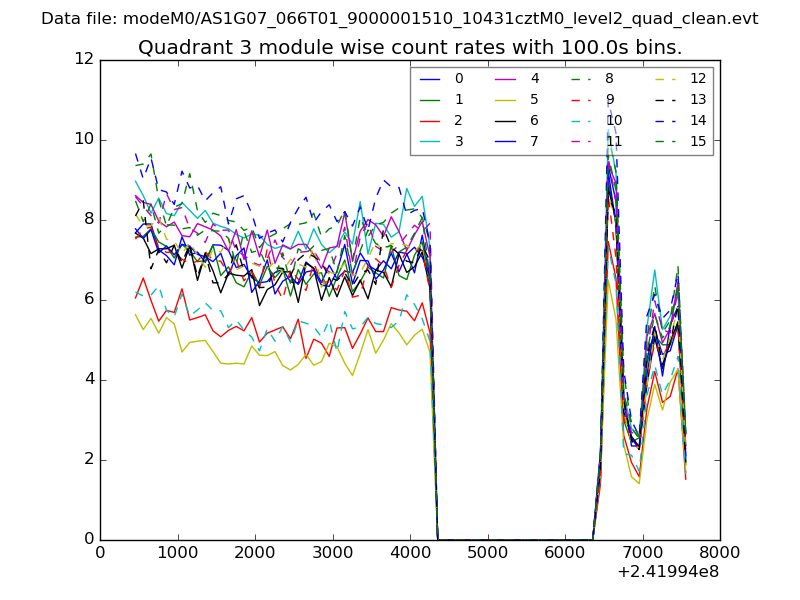
| Module-wise count rates for Quadrant D Data is divided into 100 sec bins |
 |
 |
| Parameter | Plot |
|---|---|
| CZT HV Monitor | 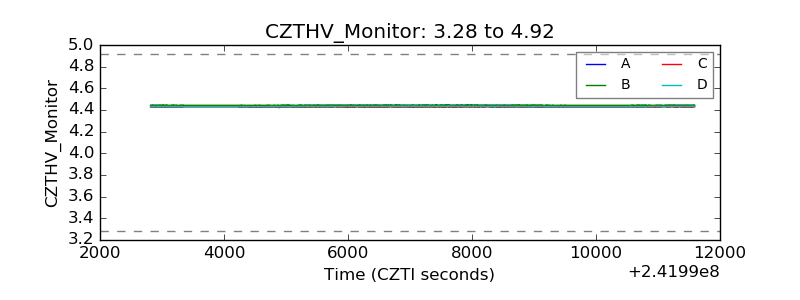 |
| D_VDD | 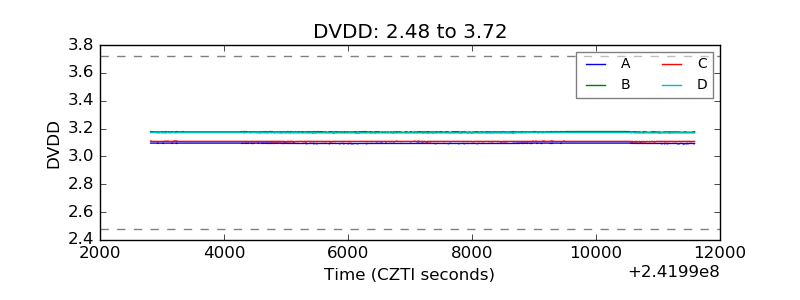 |
| Temperature 1 | 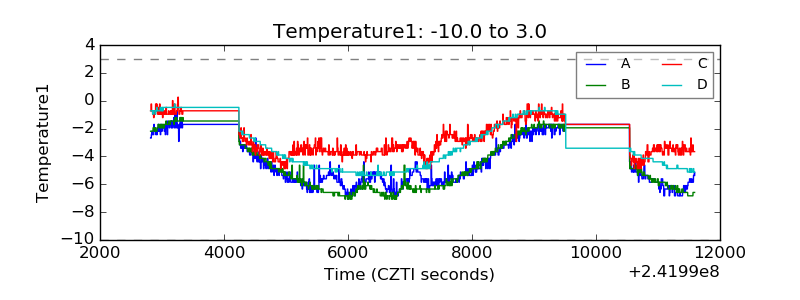 |
| Veto HV Monitor | 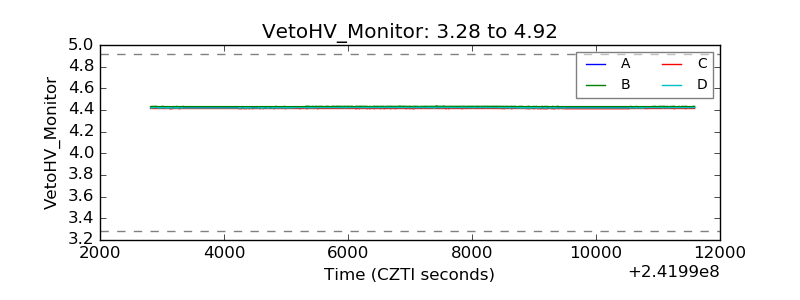 |
| Veto LLD | 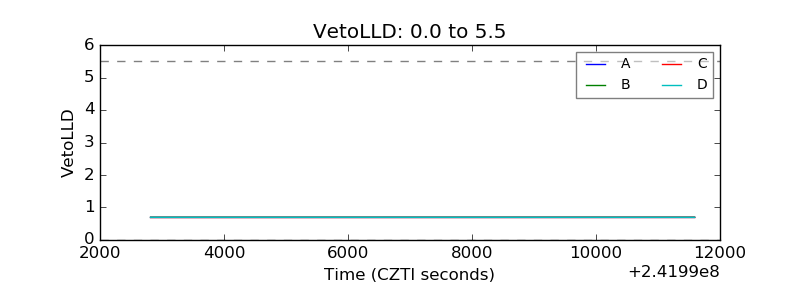 |
| Alpha Counter | 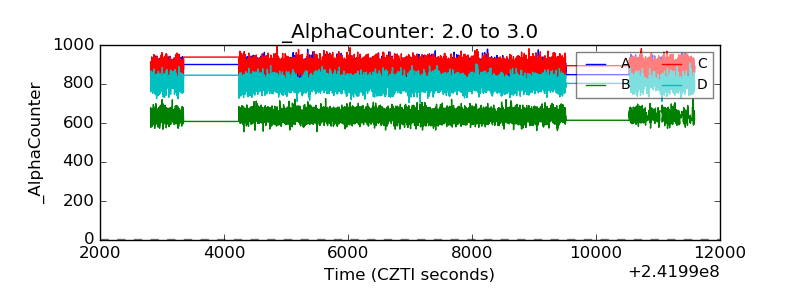 |
| _CPM_Rate | 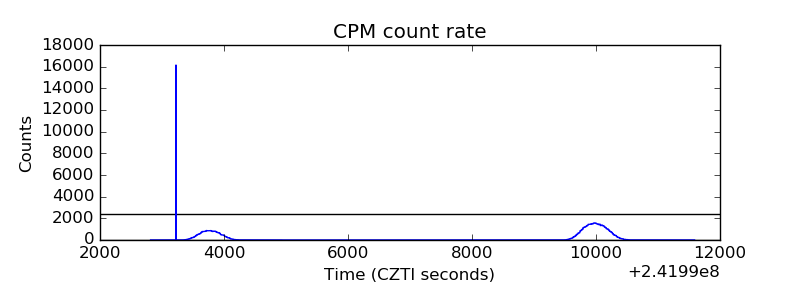 |
| CZT Counter |  |
| +2.5 Volts monitor |  |
| +5 Volts monitor |  |
| _ROLL_ROT | 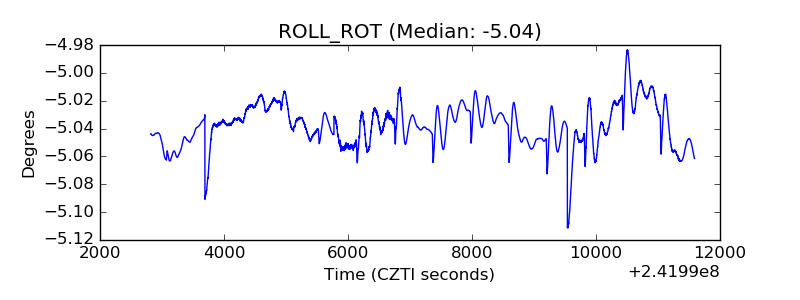 |
| _Roll_DEC | 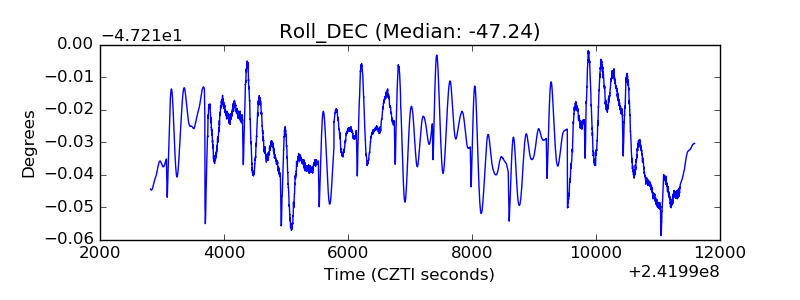 |
| _Roll_RA |  |
| Veto Counter | 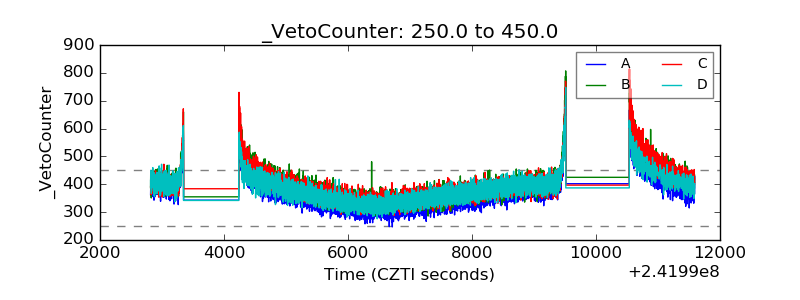 |