| Param | Original file | Final file |
|---|---|---|
| Filename | modeM0/AS1G07_066T01_9000001510_10435cztM0_level2.evt | modeM0/AS1G07_066T01_9000001510_10435cztM0_level2_quad_clean.evt |
| Size (bytes) | 2,397,320,640 | 374,201,280 |
| Size | 2.2 GB | 356.9 MB |
| Events in quadrant A | 21,984,653 | 2,325,462 |
| Events in quadrant B | 18,067,879 | 2,385,147 |
| Events in quadrant C | 12,396,340 | 2,413,996 |
| Events in quadrant D | 18,276,821 | 2,291,806 |
| Mode SS | |||
|---|---|---|---|
| Quadrant | BADHDUFLAG | Total packets | Discarded packets |
| A | 0 | 568 | 0 |
| B | 0 | 568 | 0 |
| C | 0 | 568 | 0 |
| D | 0 | 568 | 0 |
| Mode M9 | |||
|---|---|---|---|
| Quadrant | BADHDUFLAG | Total packets | Discarded packets |
| A | 0 | 36 | 0 |
| B | 0 | 36 | 0 |
| C | 0 | 36 | 0 |
| D | 0 | 36 | 0 |
| Mode M0 | |||
|---|---|---|---|
| Quadrant | BADHDUFLAG | Total packets | Discarded packets |
| A | 0 | 83673 | 5 |
| B | 0 | 72549 | 5 |
| C | 0 | 56740 | 5 |
| D | 0 | 73013 | 5 |
| Quadrant | Total seconds | Saturated seconds | Saturation percentage |
|---|---|---|---|
| A | 27884 | 1852 | 6.641802% |
| B | 27884 | 1564 | 5.608951% |
| C | 27884 | 123 | 0.441113% |
| D | 27884 | 491 | 1.760866% |
Noise dominated data is calculated using 1-second bins in cleaned event files. If a bin has >2000 counts, and if more than 50% of those come from <1% of pixels, then it is considered to be noise-dominated and hence unusable.
| Quadrant | # 1 sec bins | Bins with >0 counts | Bins with >2000 counts | High rate bins dominated by noise | Noise dominated (total time) | Noise dominated (detector-on time) | Marked lightcurve |
|---|---|---|---|---|---|---|---|
| A | 31509 | 27885 | 1345 | 1345 | 4.27% | 4.82% | 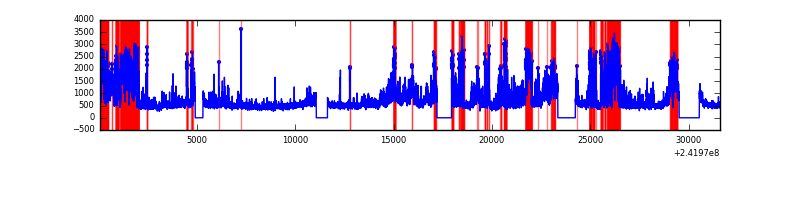 |
| B | 31509 | 27884 | 977 | 977 | 3.10% | 3.50% | 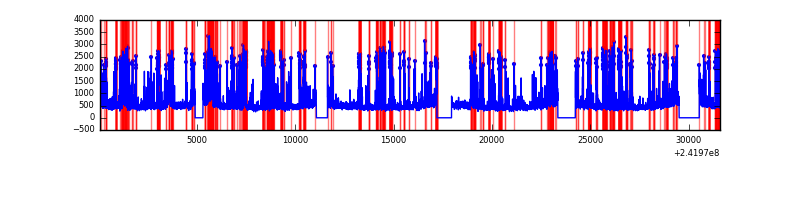 |
| C | 31509 | 27886 | 13 | 13 | 0.04% | 0.05% | 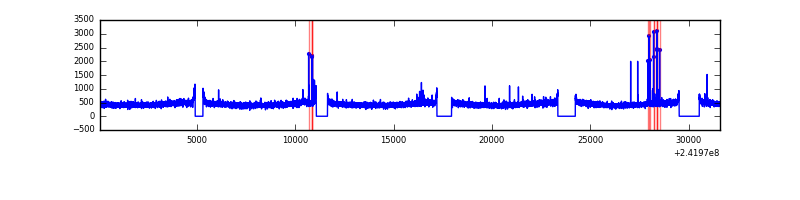 |
| D | 31509 | 27886 | 315 | 315 | 1.00% | 1.13% | 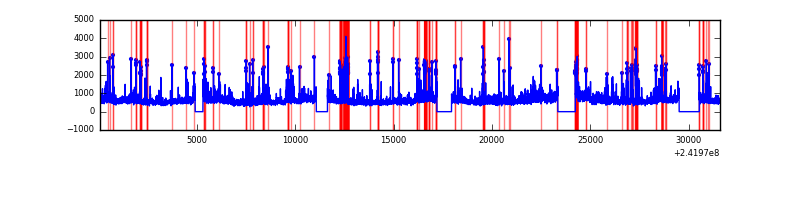 |
Top three noisy pixels from each quadrant. If the there are fewer than three noisy pixels in the level2.evt file, extra rows are filled as -1
| Pixel properties | Quadrant properties | ||||||
|---|---|---|---|---|---|---|---|
| Quadrant | DetID | PixID | Counts | Sigma | Mean | Median | Sigma |
| A | 13 | 251 | 8992632 | 14073.04 | 3151 | 3080 | 638.8 |
| A | 3 | 80 | 666618 | 1038.76 | 3151 | 3080 | 638.8 |
| A | 15 | 174 | 151933 | 233.03 | 3151 | 3080 | 638.8 |
| B | 4 | 239 | 5137134 | 8613.92 | 3163 | 3085 | 596.0 |
| B | 0 | 214 | 183018 | 301.89 | 3163 | 3085 | 596.0 |
| B | 11 | 51 | 130416 | 213.64 | 3163 | 3085 | 596.0 |
| C | 14 | 234 | 97228 | 129.62 | 3145 | 3159 | 725.7 |
| C | 13 | 61 | 23859 | 28.52 | 3145 | 3159 | 725.7 |
| C | 14 | 67 | 20717 | 24.19 | 3145 | 3159 | 725.7 |
| D | 8 | 195 | 2531584 | 3404.14 | 3096 | 3013 | 742.8 |
| D | 1 | 20 | 910586 | 1221.84 | 3096 | 3013 | 742.8 |
| D | 5 | 222 | 582579 | 780.25 | 3096 | 3013 | 742.8 |
Histogram calculated using DETX and DETY for each event in the final _common_clean file
| Quadrant A |  |
 |
Quadrant B |
|---|---|---|---|
| Quadrant D |  |
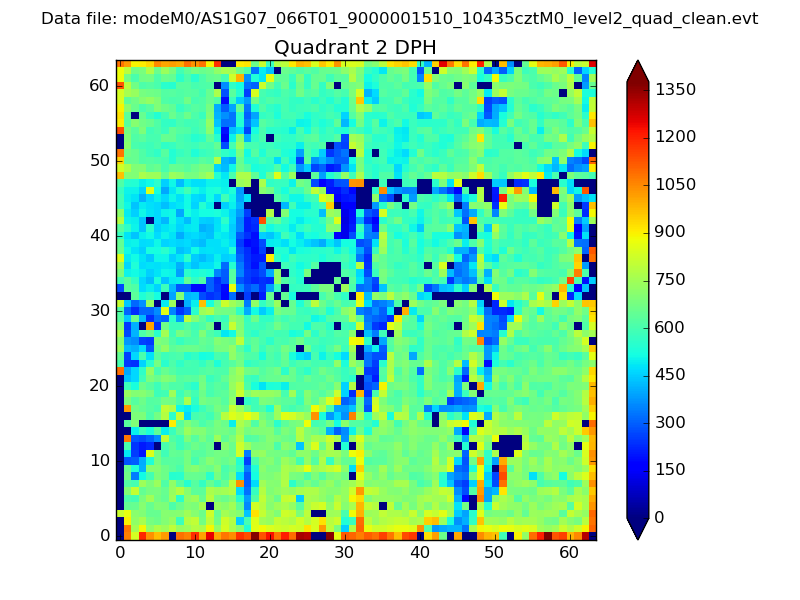 |
Quadrant C |
| Plot type | Count rate plots | Images |
|---|---|---|
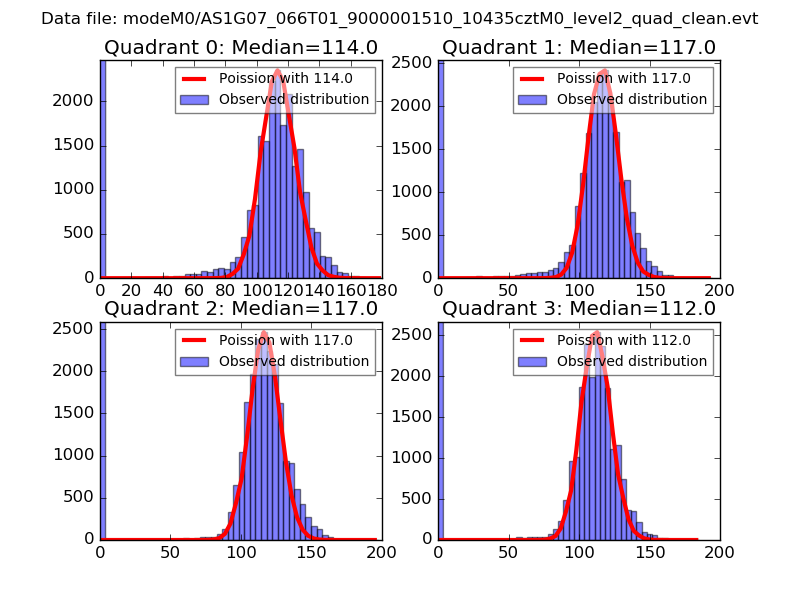
| Comparison with Poisson distribution Blue bars denote a histogram of data divided into 1 sec bins. Red curve is a Poisson curve with rate = median count rate of data. |
 |
 |
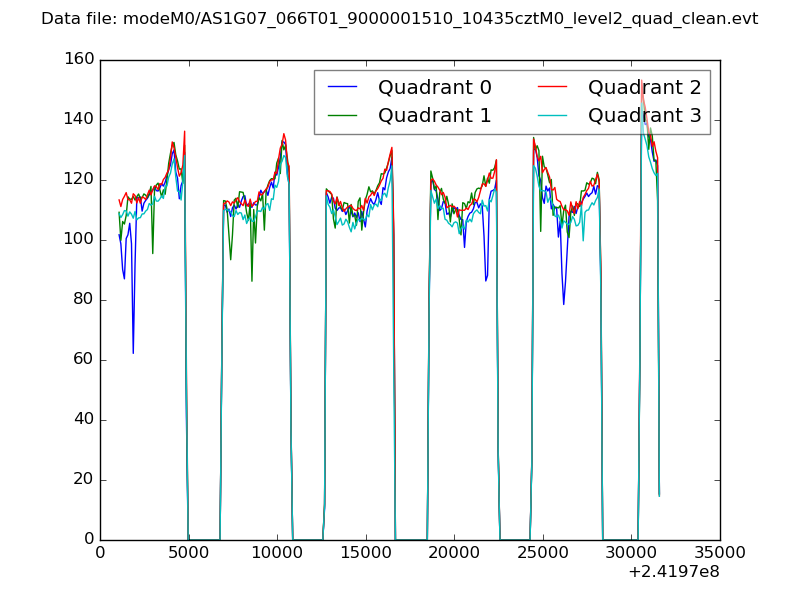
| Quadrant-wise count rates Data is divided into 100 sec bins |
 |
|
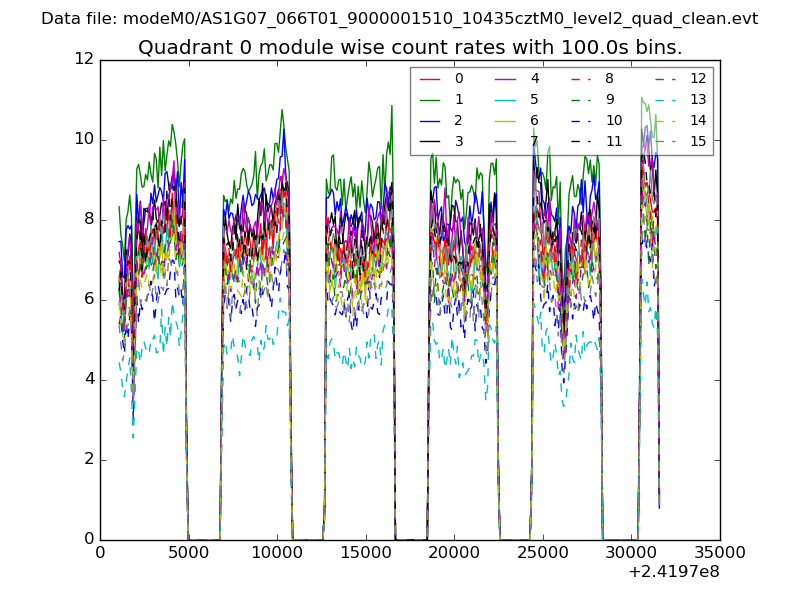
| Module-wise count rates for Quadrant A Data is divided into 100 sec bins |
 |
 |
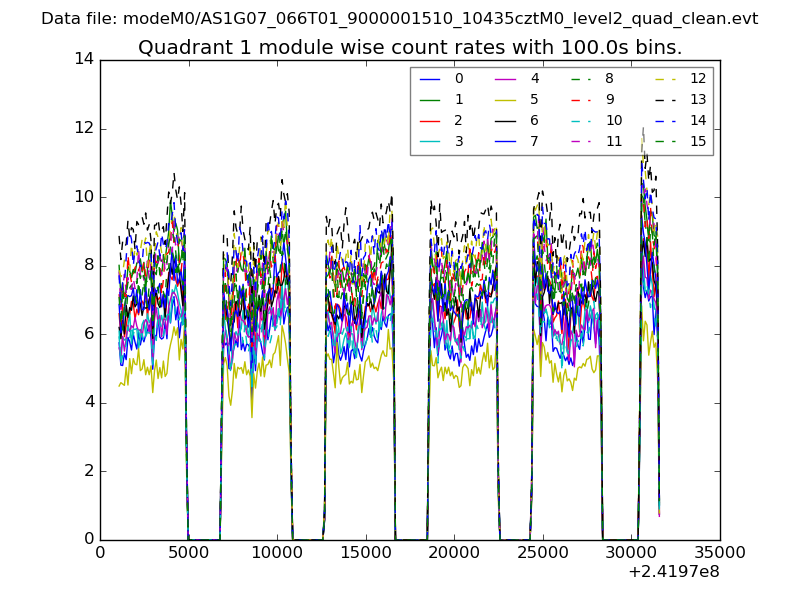
| Module-wise count rates for Quadrant B Data is divided into 100 sec bins |
 |
 |
| Module-wise count rates for Quadrant C Data is divided into 100 sec bins |
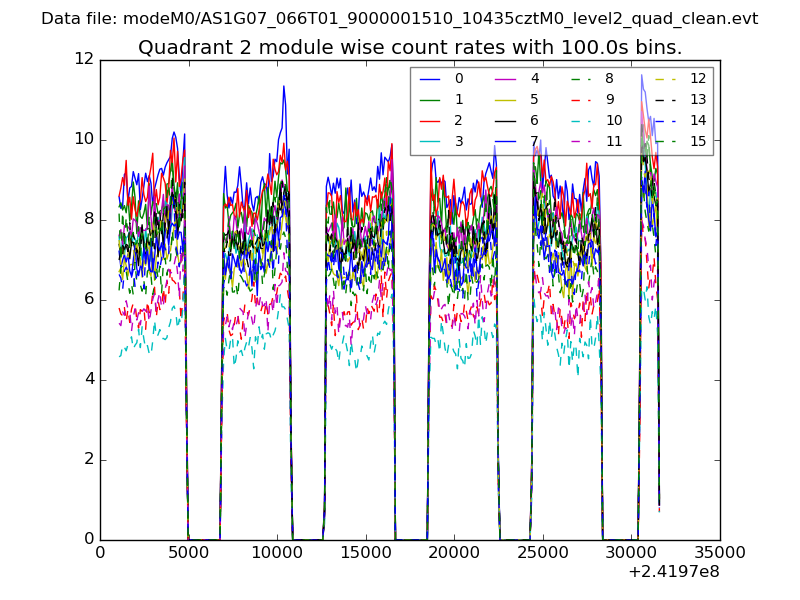 |
 |
| Module-wise count rates for Quadrant D Data is divided into 100 sec bins |
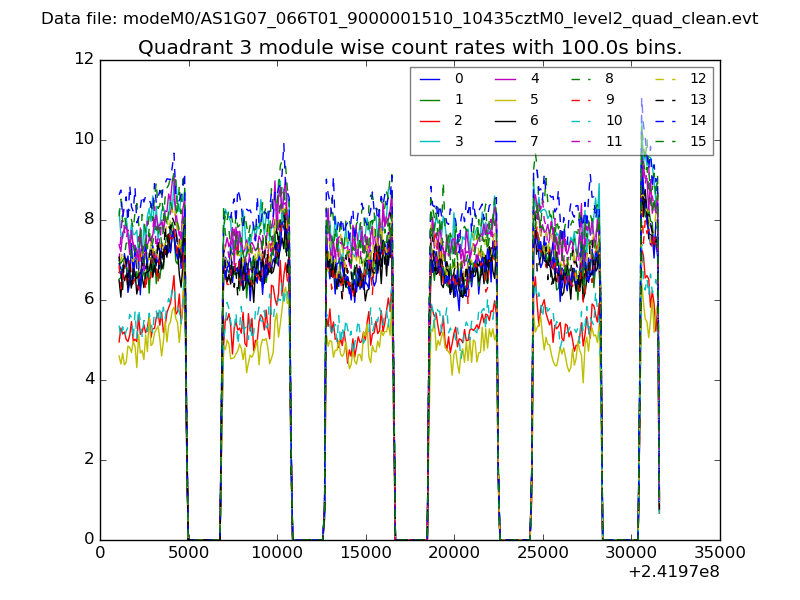 |
 |
| Parameter | Plot |
|---|---|
| CZT HV Monitor | 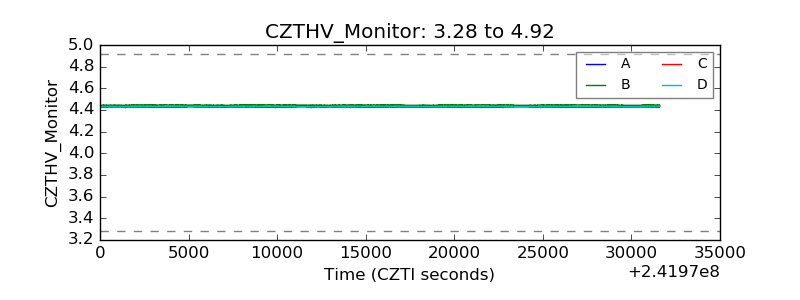 |
| D_VDD | 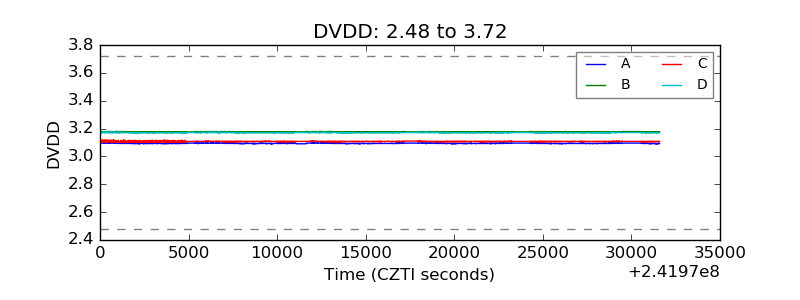 |
| Temperature 1 | 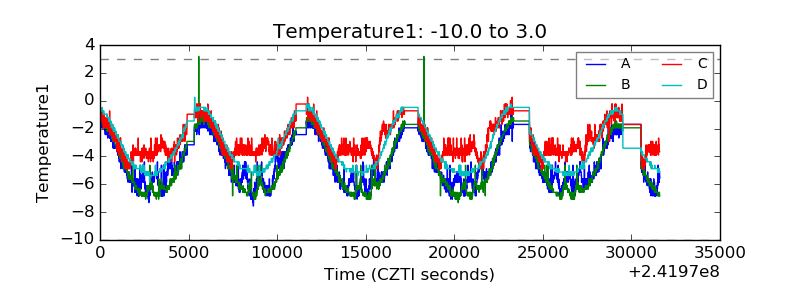 |
| Veto HV Monitor | 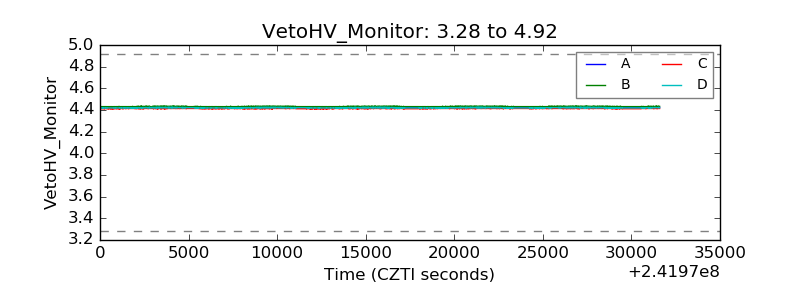 |
| Veto LLD |  |
| Alpha Counter | 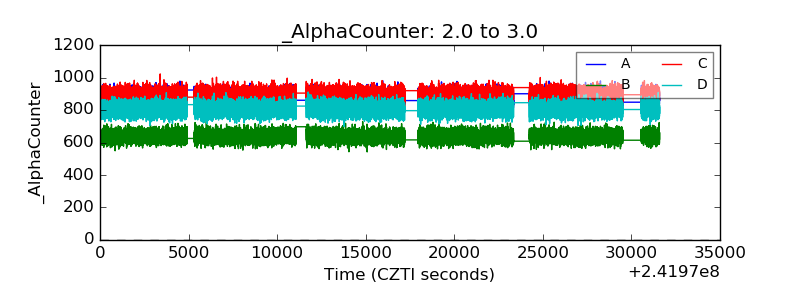 |
| _CPM_Rate | 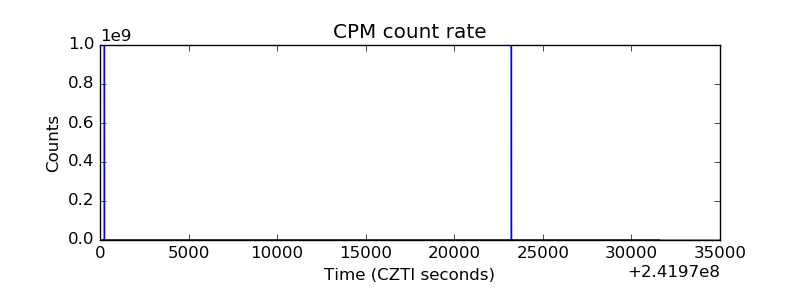 |
| CZT Counter | 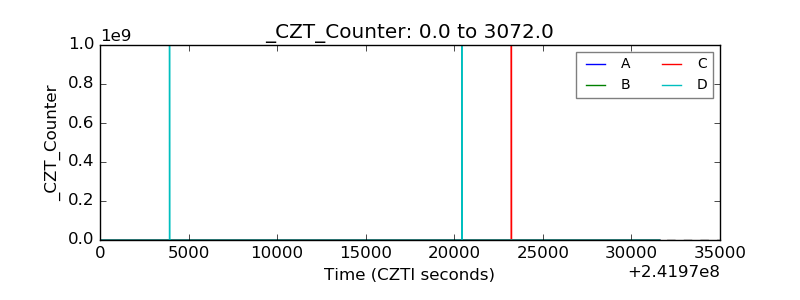 |
| +2.5 Volts monitor |  |
| +5 Volts monitor | 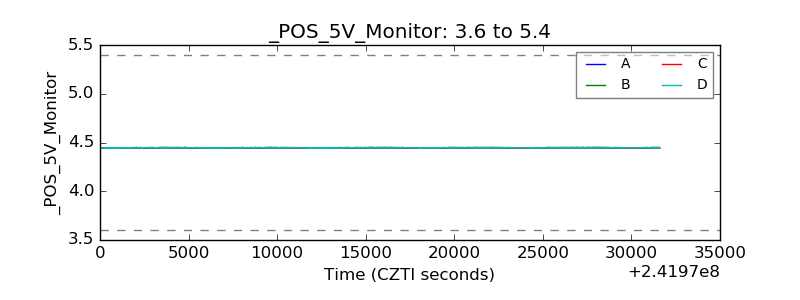 |
| _ROLL_ROT | 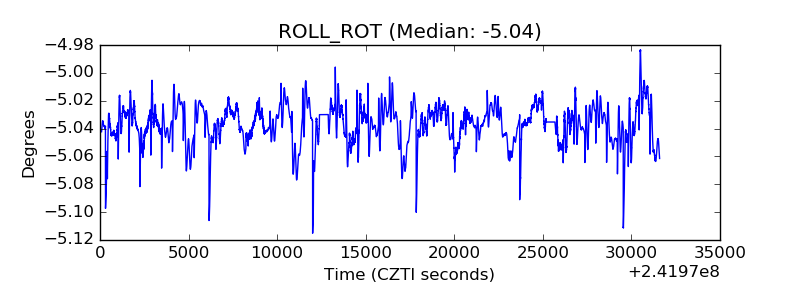 |
| _Roll_DEC | 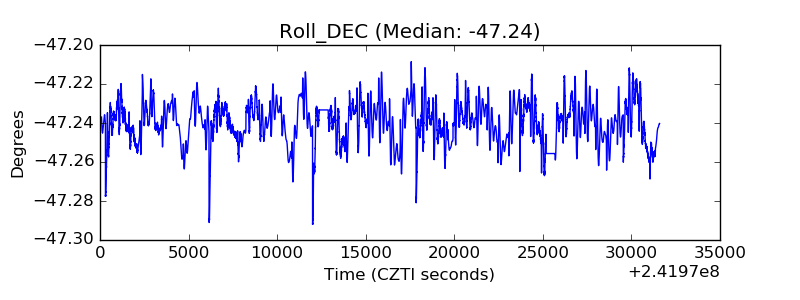 |
| _Roll_RA | 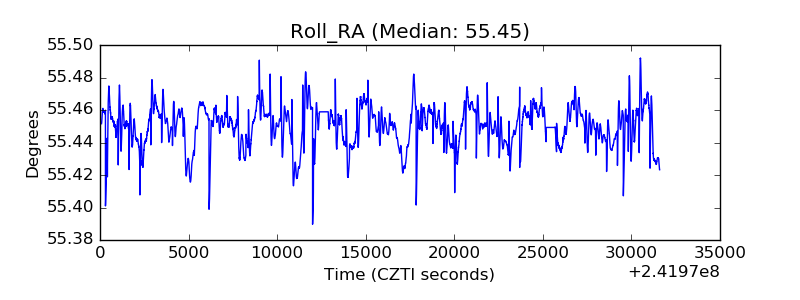 |
| Veto Counter | 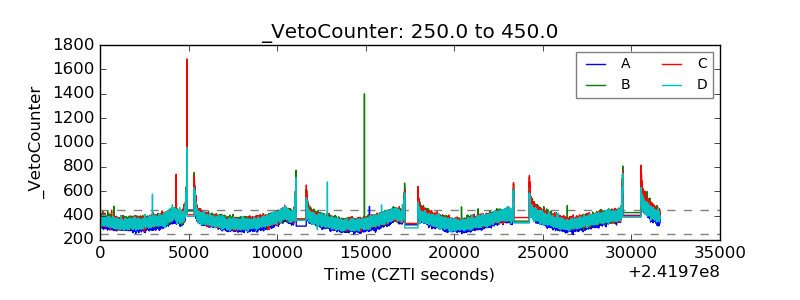 |