| Param | Original file | Final file |
|---|---|---|
| Filename | modeM0/AS1G07_066T01_9000001510_10438cztM0_level2.evt | modeM0/AS1G07_066T01_9000001510_10438cztM0_level2_quad_clean.evt |
| Size (bytes) | 759,689,280 | 137,327,040 |
| Size | 724.5 MB | 131.0 MB |
| Events in quadrant A | 5,352,298 | 732,634 |
| Events in quadrant B | 5,055,133 | 851,011 |
| Events in quadrant C | 4,774,253 | 936,979 |
| Events in quadrant D | 7,149,239 | 947,539 |
| Mode SS | |||
|---|---|---|---|
| Quadrant | BADHDUFLAG | Total packets | Discarded packets |
| A | 0 | 524 | 275 |
| B | 0 | 524 | 287 |
| C | 0 | 524 | 285 |
| D | 0 | 508 | 262 |
| Mode M9 | |||
|---|---|---|---|
| Quadrant | BADHDUFLAG | Total packets | Discarded packets |
| A | 0 | 47 | 21 |
| B | 0 | 52 | 26 |
| C | 0 | 52 | 26 |
| D | 0 | 50 | 24 |
| Mode M0 | |||
|---|---|---|---|
| Quadrant | BADHDUFLAG | Total packets | Discarded packets |
| A | 0 | 79724 | 58692 |
| B | 0 | 65406 | 44164 |
| C | 0 | 52176 | 30668 |
| D | 0 | 67883 | 39137 |
| Quadrant | Total seconds | Saturated seconds | Saturation percentage |
|---|---|---|---|
| A | 8142 | 126 | 1.547531% |
| B | 9494 | 92 | 0.969033% |
| C | 10620 | 26 | 0.244821% |
| D | 11223 | 54 | 0.481155% |
Noise dominated data is calculated using 1-second bins in cleaned event files. If a bin has >2000 counts, and if more than 50% of those come from <1% of pixels, then it is considered to be noise-dominated and hence unusable.
| Quadrant | # 1 sec bins | Bins with >0 counts | Bins with >2000 counts | High rate bins dominated by noise | Noise dominated (total time) | Noise dominated (detector-on time) | Marked lightcurve |
|---|---|---|---|---|---|---|---|
| A | 15446 | 10130 | 0 | 0 | 0.00% | 0.00% | 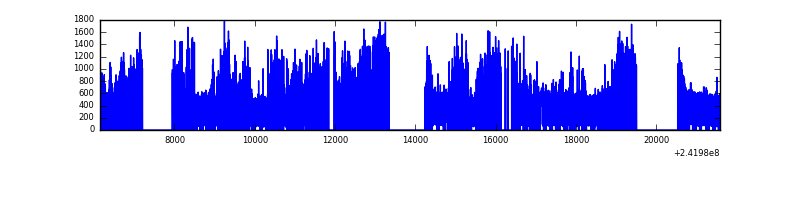 |
| B | 15445 | 11399 | 0 | 0 | 0.00% | 0.00% | 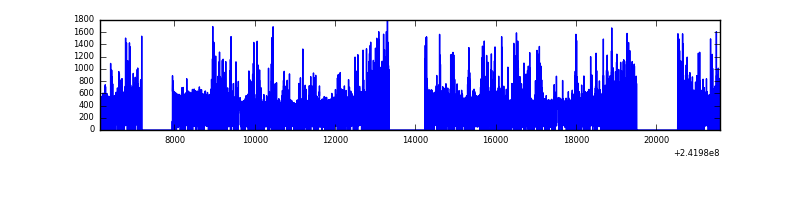 |
| C | 15447 | 12329 | 0 | 0 | 0.00% | 0.00% | 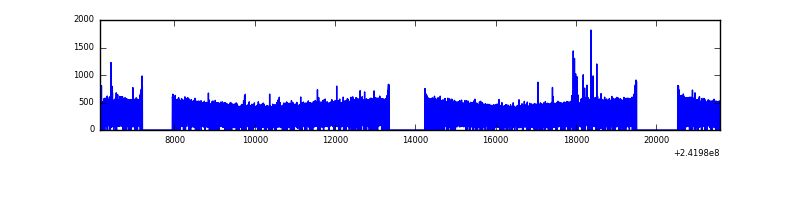 |
| D | 15447 | 12309 | 0 | 0 | 0.00% | 0.00% | 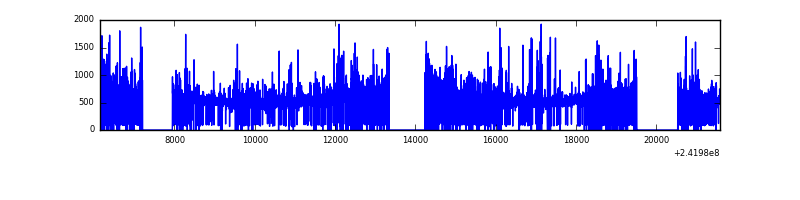 |
Top three noisy pixels from each quadrant. If the there are fewer than three noisy pixels in the level2.evt file, extra rows are filled as -1
| Pixel properties | Quadrant properties | ||||||
|---|---|---|---|---|---|---|---|
| Quadrant | DetID | PixID | Counts | Sigma | Mean | Median | Sigma |
| A | 13 | 251 | 1480787 | 7686.79 | 942 | 919 | 192.5 |
| A | 3 | 80 | 211997 | 1096.39 | 942 | 919 | 192.5 |
| A | 15 | 174 | 17931 | 88.36 | 942 | 919 | 192.5 |
| B | 4 | 239 | 569369 | 2705.45 | 1105 | 1079 | 210.1 |
| B | 0 | 214 | 80558 | 378.37 | 1105 | 1079 | 210.1 |
| B | 11 | 51 | 47274 | 219.92 | 1105 | 1079 | 210.1 |
| C | 14 | 234 | 33145 | 114.05 | 1213 | 1220 | 279.9 |
| C | 14 | 67 | 9315 | 28.92 | 1213 | 1220 | 279.9 |
| C | 13 | 61 | 9148 | 28.32 | 1213 | 1220 | 279.9 |
| D | 8 | 195 | 1039629 | 3449.08 | 1261 | 1226 | 301.1 |
| D | 1 | 255 | 397619 | 1316.63 | 1261 | 1226 | 301.1 |
| D | 1 | 20 | 300629 | 994.47 | 1261 | 1226 | 301.1 |
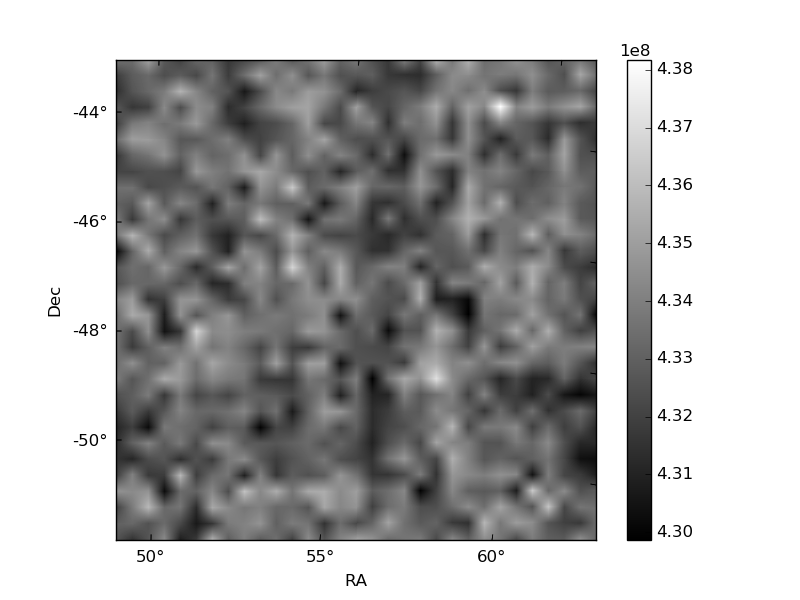
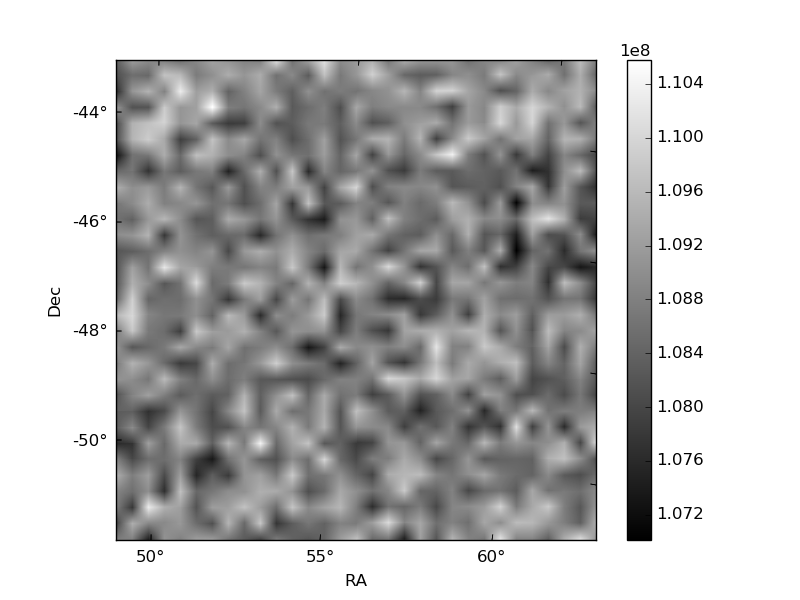
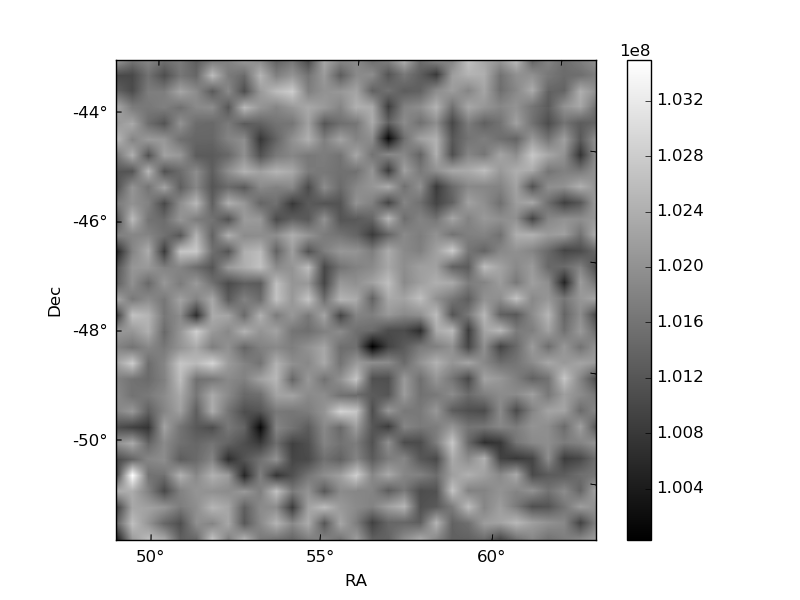
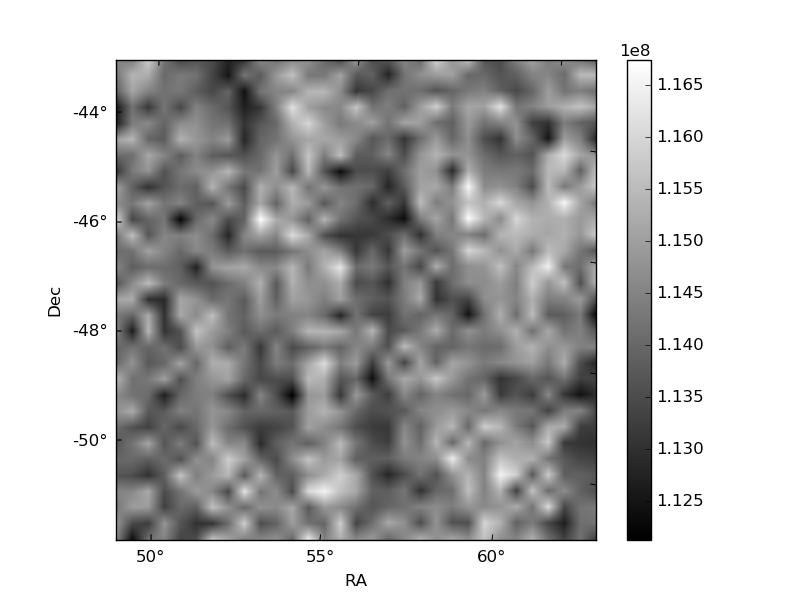
Histogram calculated using DETX and DETY for each event in the final _common_clean file
| Quadrant A |  |
 |
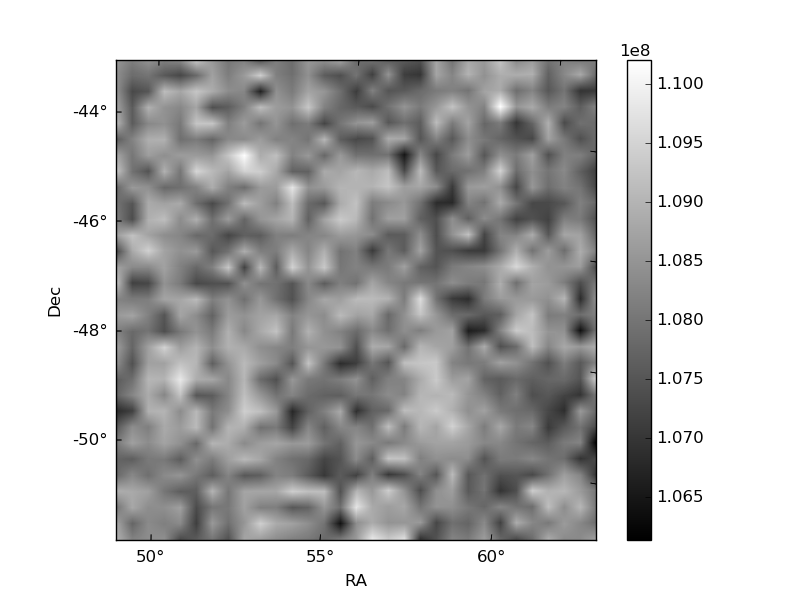
Quadrant B |
|---|---|---|---|
| Quadrant D |  |
 |
Quadrant C |
| Plot type | Count rate plots | Images |
|---|---|---|
| Comparison with Poisson distribution Blue bars denote a histogram of data divided into 1 sec bins. Red curve is a Poisson curve with rate = median count rate of data. |
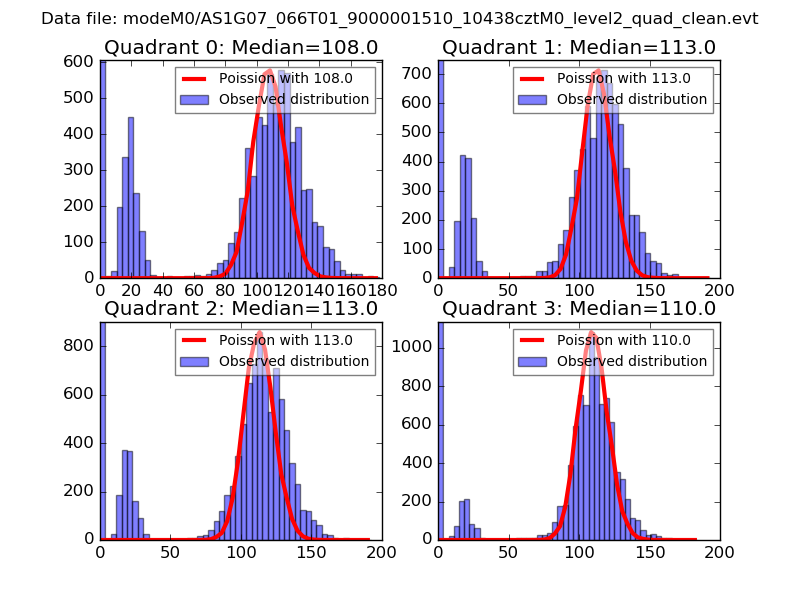 |
 |
| Quadrant-wise count rates Data is divided into 100 sec bins |
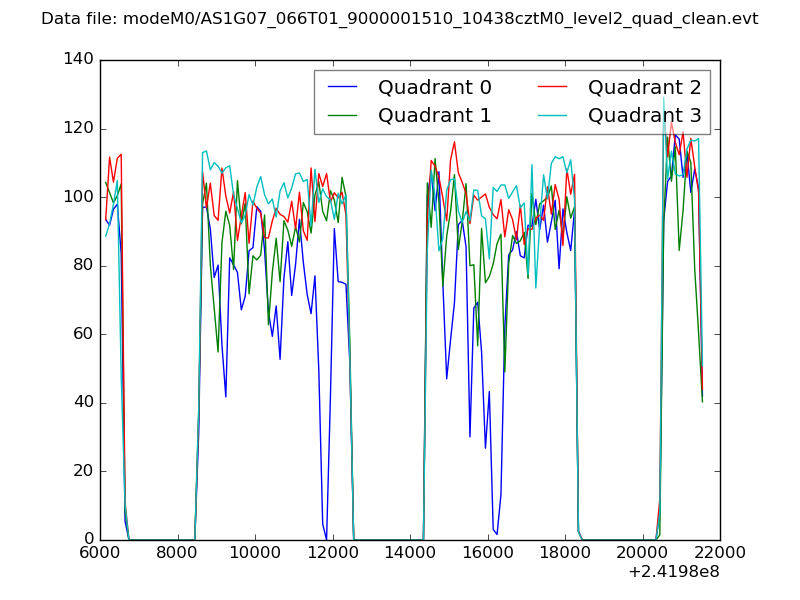 |
|
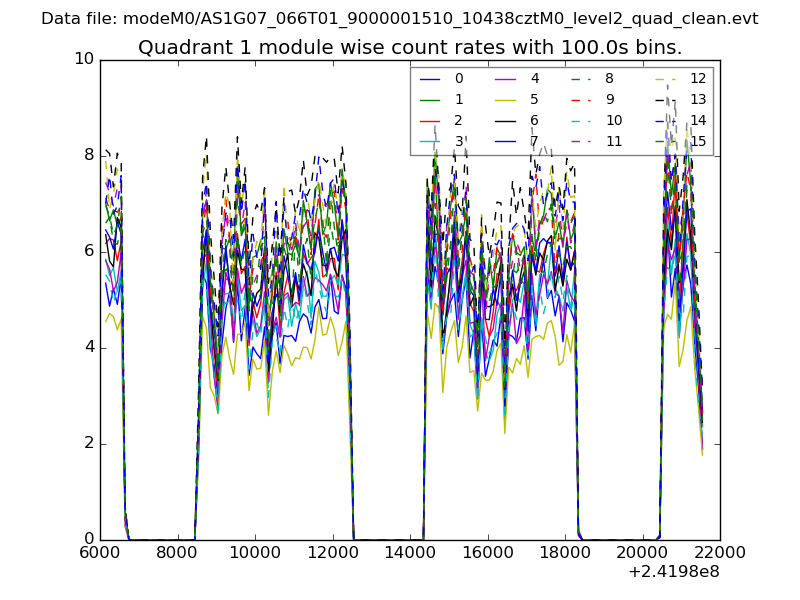
| Module-wise count rates for Quadrant A Data is divided into 100 sec bins |
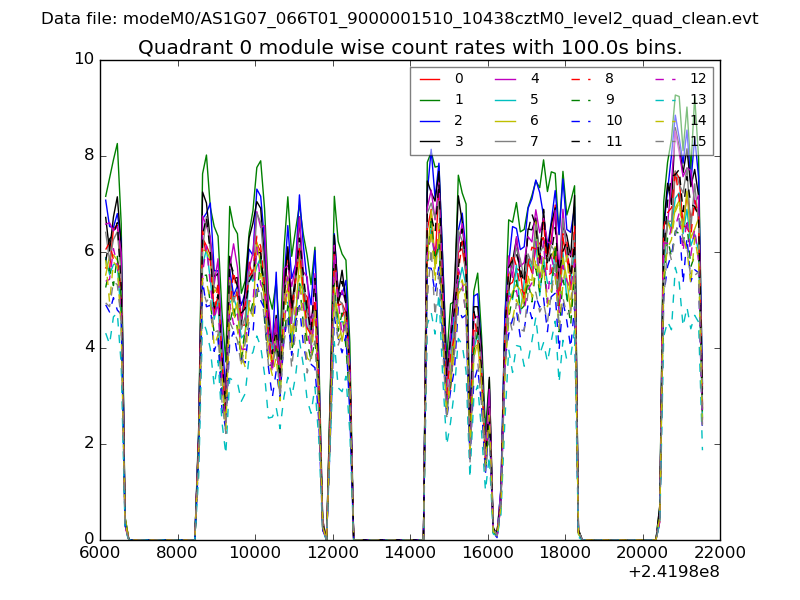 |
 |
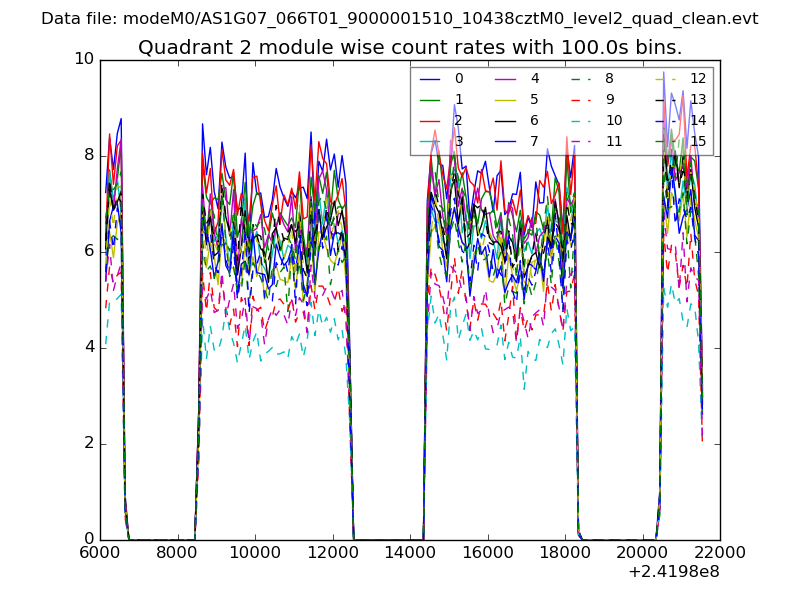
| Module-wise count rates for Quadrant B Data is divided into 100 sec bins |
 |
 |
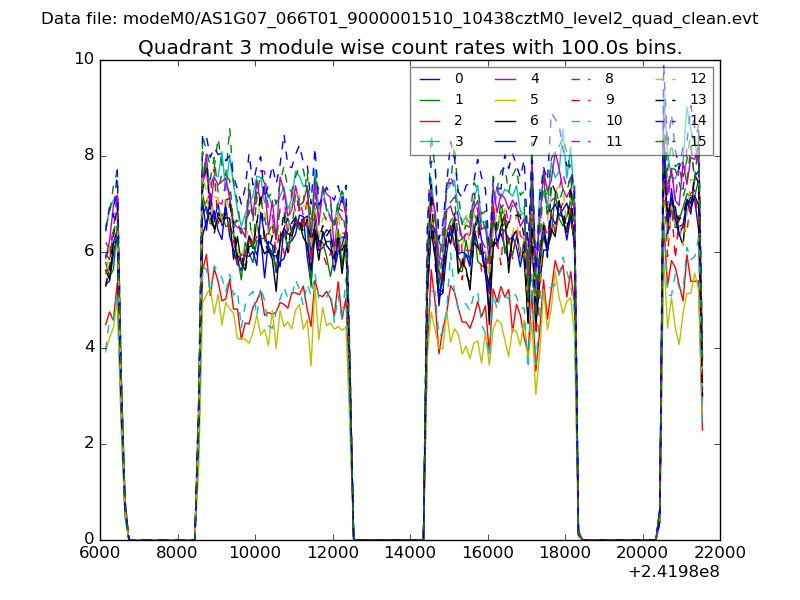
| Module-wise count rates for Quadrant C Data is divided into 100 sec bins |
 |
 |
| Module-wise count rates for Quadrant D Data is divided into 100 sec bins |
 |
 |
| Parameter | Plot |
|---|---|
| CZT HV Monitor | 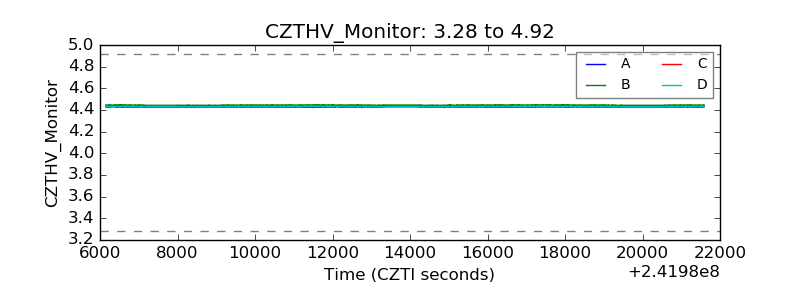 |
| D_VDD | 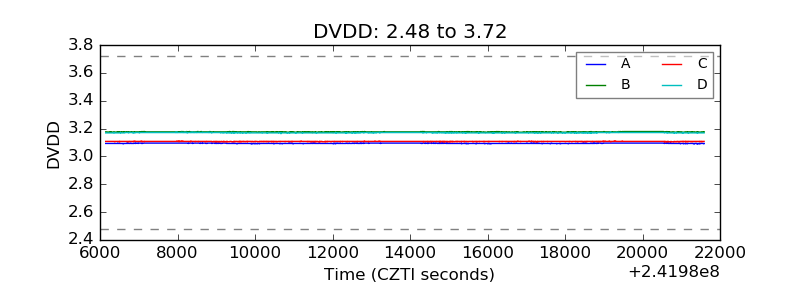 |
| Temperature 1 | 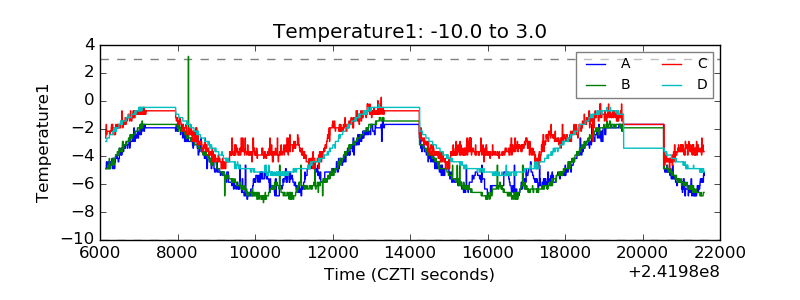 |
| Veto HV Monitor |  |
| Veto LLD | 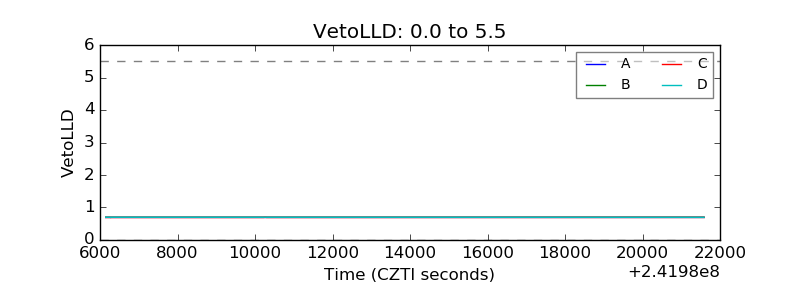 |
| Alpha Counter | 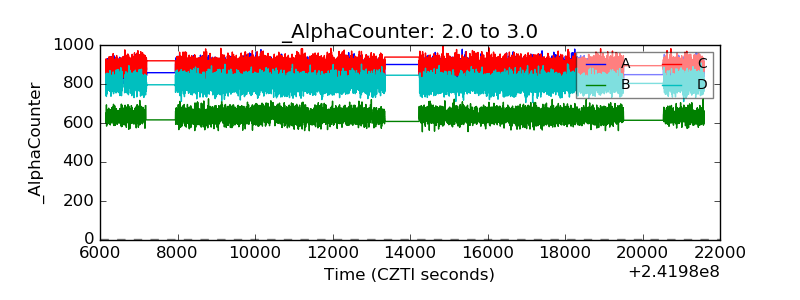 |
| _CPM_Rate | 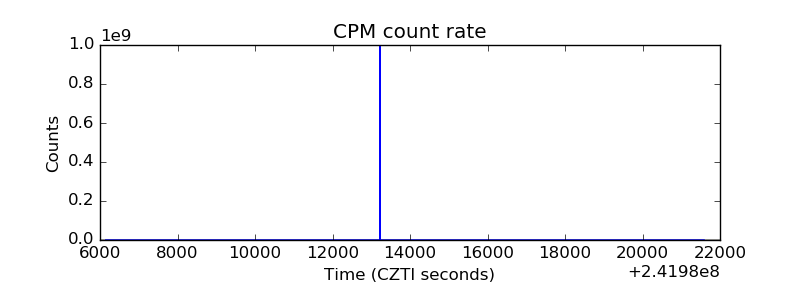 |
| CZT Counter | 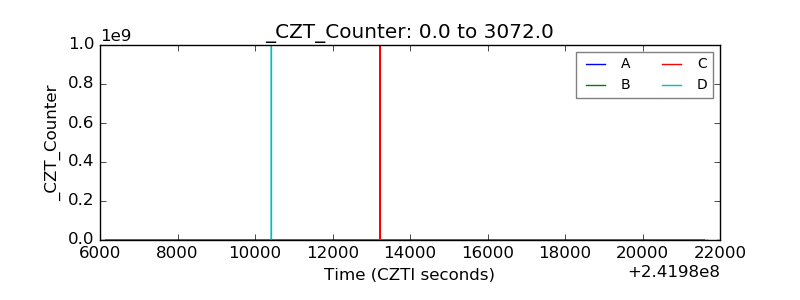 |
| +2.5 Volts monitor |  |
| +5 Volts monitor | 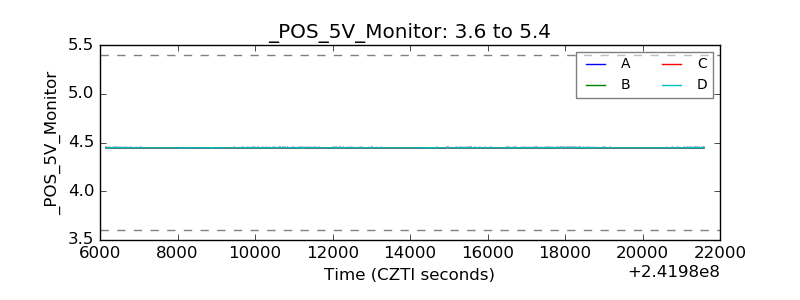 |
| _ROLL_ROT | 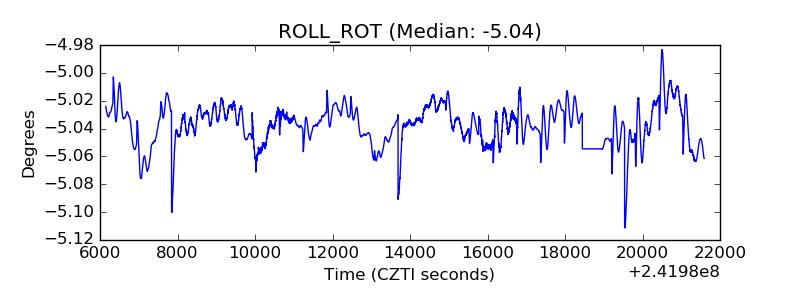 |
| _Roll_DEC |  |
| _Roll_RA | 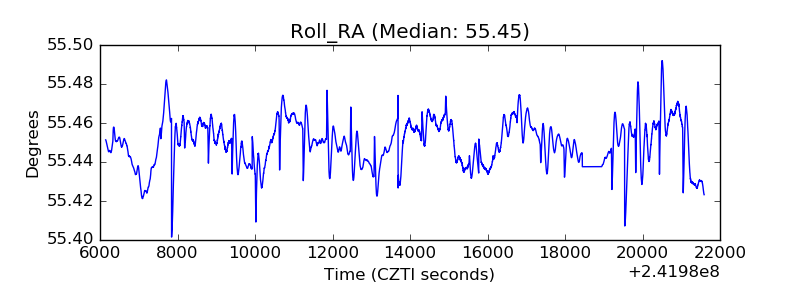 |
| Veto Counter | 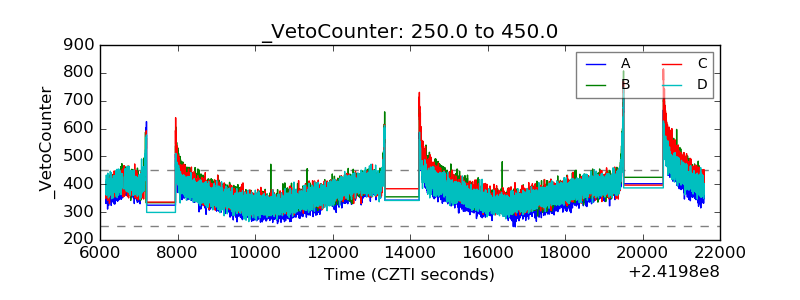 |