| Param | Original file | Final file |
|---|---|---|
| Filename | modeM0/AS1G07_068T02_9000001508_10420cztM0_level2.evt | modeM0/AS1G07_068T02_9000001508_10420cztM0_level2_quad_clean.evt |
| Size (bytes) | 638,424,000 | 104,906,880 |
| Size | 608.8 MB | 100.0 MB |
| Events in quadrant A | 5,140,078 | 631,447 |
| Events in quadrant B | 4,467,961 | 637,891 |
| Events in quadrant C | 3,931,790 | 681,540 |
| Events in quadrant D | 5,254,565 | 671,854 |
| Mode SS | |||
|---|---|---|---|
| Quadrant | BADHDUFLAG | Total packets | Discarded packets |
| A | 0 | 312 | 136 |
| B | 0 | 312 | 135 |
| C | 0 | 312 | 132 |
| D | 0 | 296 | 123 |
| Mode M9 | |||
|---|---|---|---|
| Quadrant | BADHDUFLAG | Total packets | Discarded packets |
| A | 0 | 40 | 15 |
| B | 0 | 41 | 16 |
| C | 0 | 41 | 16 |
| D | 0 | 34 | 9 |
| Mode M0 | |||
|---|---|---|---|
| Quadrant | BADHDUFLAG | Total packets | Discarded packets |
| A | 0 | 37399 | 17094 |
| B | 0 | 38790 | 20463 |
| C | 0 | 31373 | 14436 |
| D | 0 | 39213 | 18152 |
| Quadrant | Total seconds | Saturated seconds | Saturation percentage |
|---|---|---|---|
| A | 7700 | 83 | 1.077922% |
| B | 7768 | 123 | 1.583419% |
| C | 8233 | 17 | 0.206486% |
| D | 8075 | 186 | 2.303406% |
Noise dominated data is calculated using 1-second bins in cleaned event files. If a bin has >2000 counts, and if more than 50% of those come from <1% of pixels, then it is considered to be noise-dominated and hence unusable.
| Quadrant | # 1 sec bins | Bins with >0 counts | Bins with >2000 counts | High rate bins dominated by noise | Noise dominated (total time) | Noise dominated (detector-on time) | Marked lightcurve |
|---|---|---|---|---|---|---|---|
| A | 11447 | 8357 | 23 | 23 | 0.20% | 0.28% | 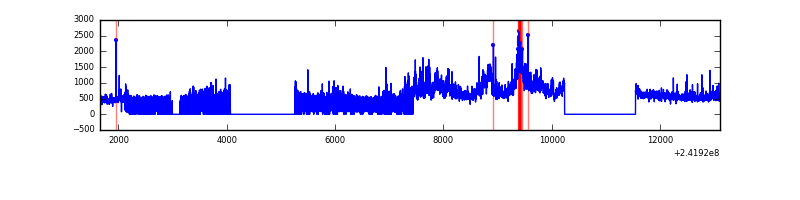 |
| B | 11447 | 8402 | 55 | 55 | 0.48% | 0.65% | 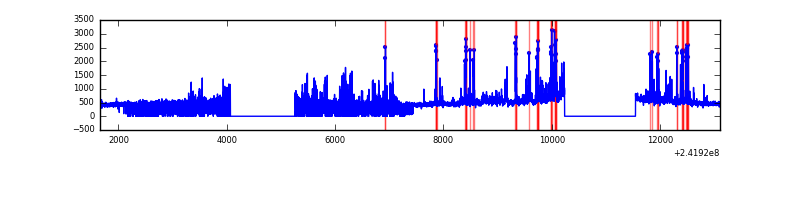 |
| C | 11447 | 8791 | 7 | 7 | 0.06% | 0.08% |  |
| D | 11447 | 8332 | 183 | 183 | 1.60% | 2.20% |  |
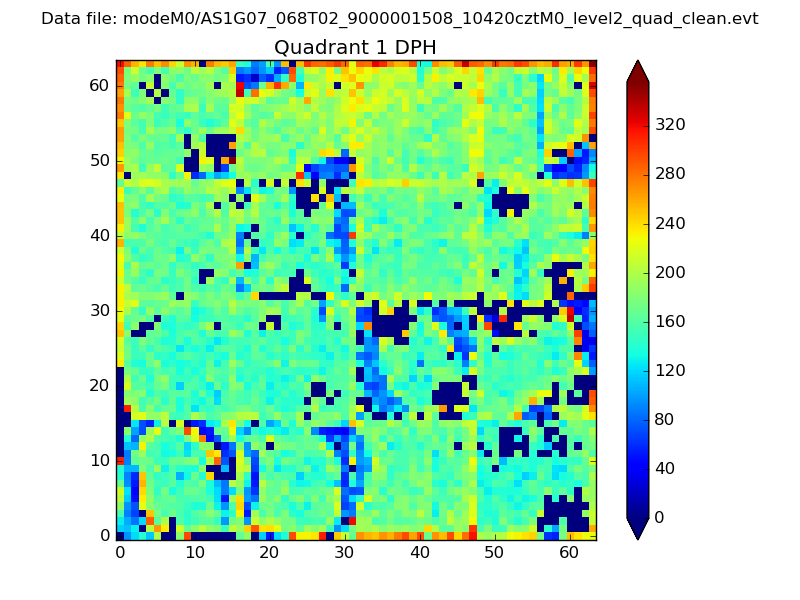
Top three noisy pixels from each quadrant. If the there are fewer than three noisy pixels in the level2.evt file, extra rows are filled as -1
| Pixel properties | Quadrant properties | ||||||
|---|---|---|---|---|---|---|---|
| Quadrant | DetID | PixID | Counts | Sigma | Mean | Median | Sigma |
| A | 13 | 251 | 1505889 | 8003.82 | 934 | 915 | 188.0 |
| A | 4 | 2 | 21862 | 111.4 | 934 | 915 | 188.0 |
| A | 1 | 162 | 10803 | 52.59 | 934 | 915 | 188.0 |
| B | 4 | 239 | 566203 | 3190.57 | 948 | 927 | 177.2 |
| B | 10 | 245 | 72079 | 401.6 | 948 | 927 | 177.2 |
| B | 0 | 214 | 67557 | 376.08 | 948 | 927 | 177.2 |
| C | 14 | 234 | 39227 | 168.08 | 997 | 1003 | 227.4 |
| C | 13 | 61 | 7385 | 28.06 | 997 | 1003 | 227.4 |
| C | 14 | 67 | 3073 | 9.1 | 997 | 1003 | 227.4 |
| D | 2 | 33 | 686692 | 3003.05 | 957 | 932 | 228.4 |
| D | 8 | 195 | 485262 | 2120.96 | 957 | 932 | 228.4 |
| D | 1 | 52 | 225236 | 982.26 | 957 | 932 | 228.4 |
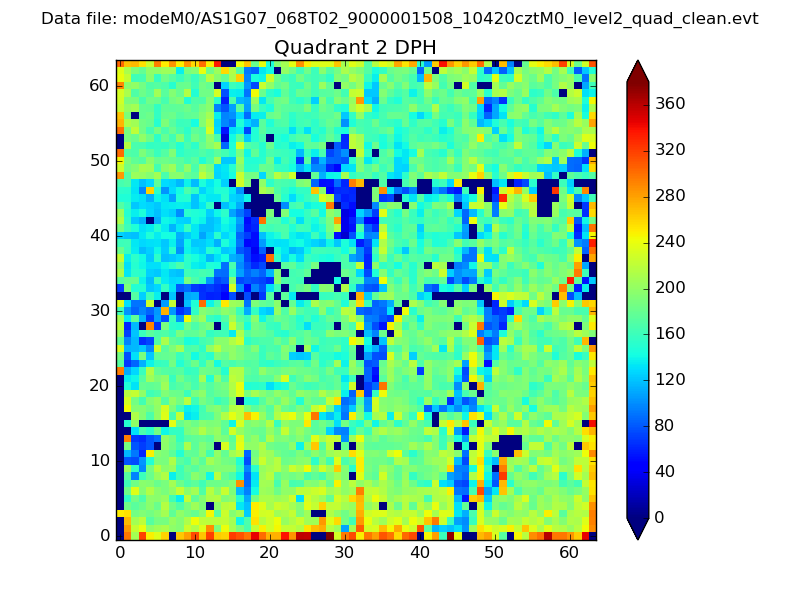
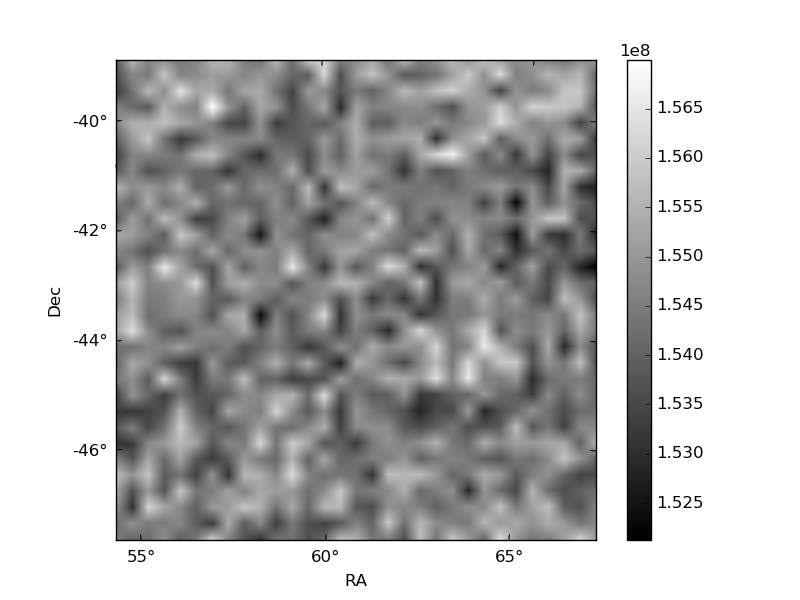
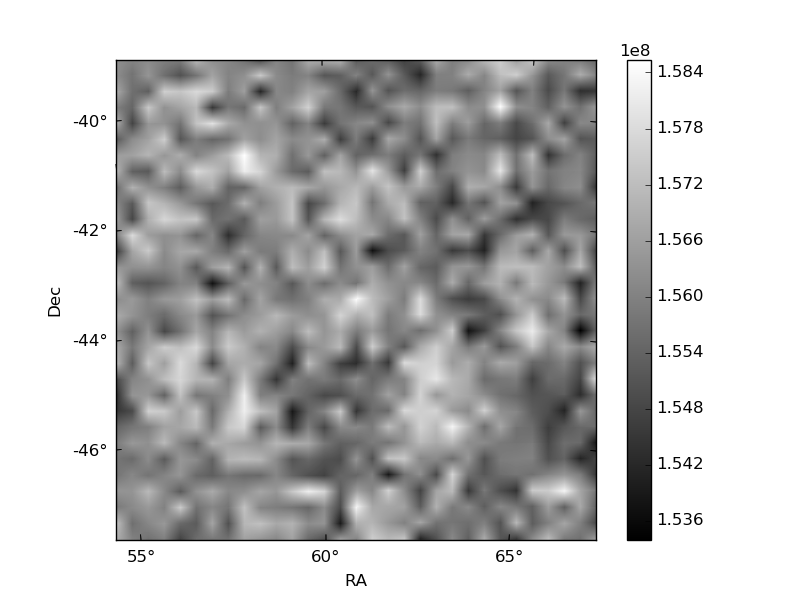
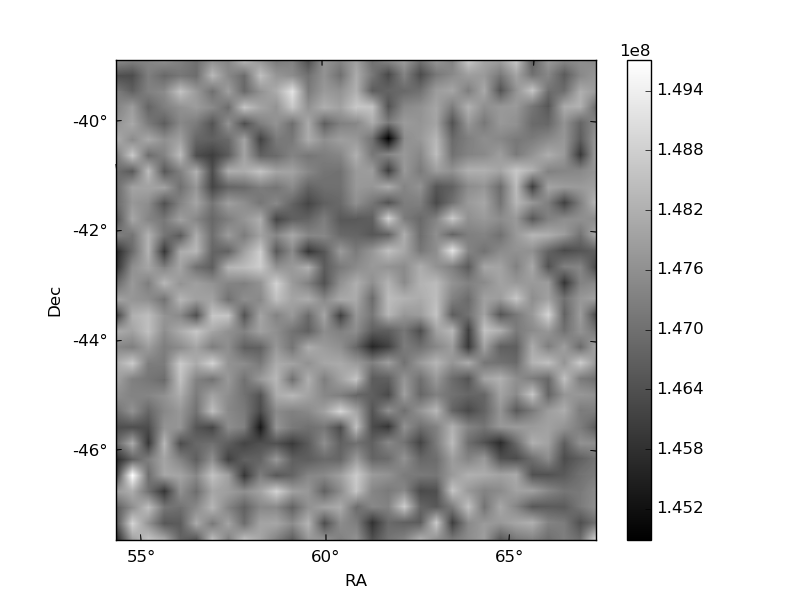
Histogram calculated using DETX and DETY for each event in the final _common_clean file
| Quadrant A | 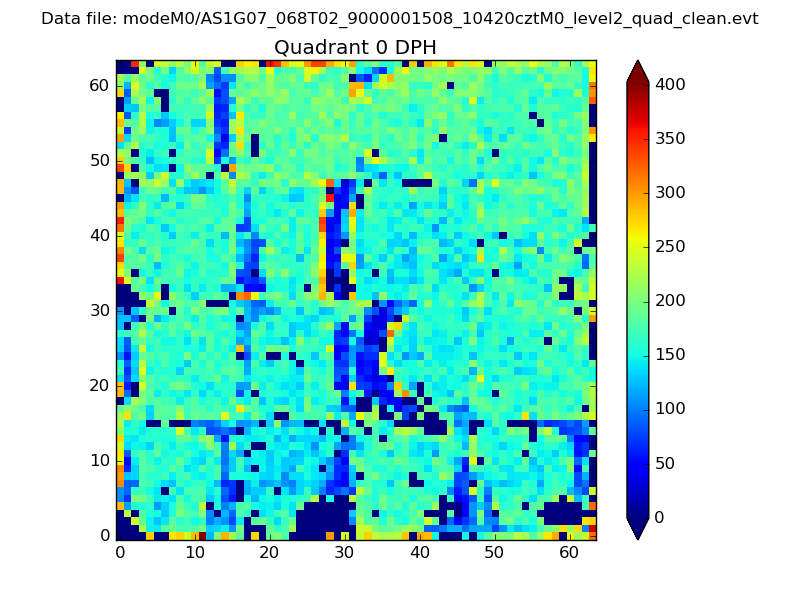 |
 |
Quadrant B |
|---|---|---|---|
| Quadrant D | 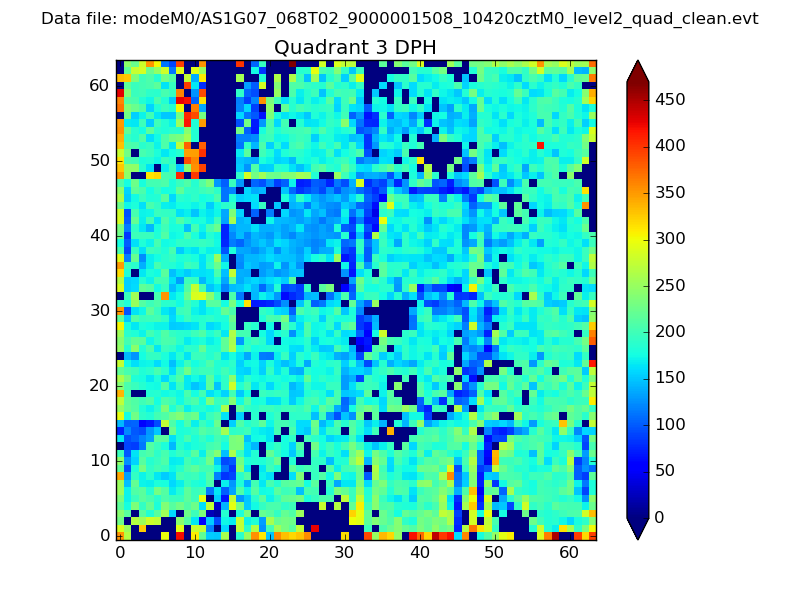 |
 |
Quadrant C |
| Plot type | Count rate plots | Images |
|---|---|---|
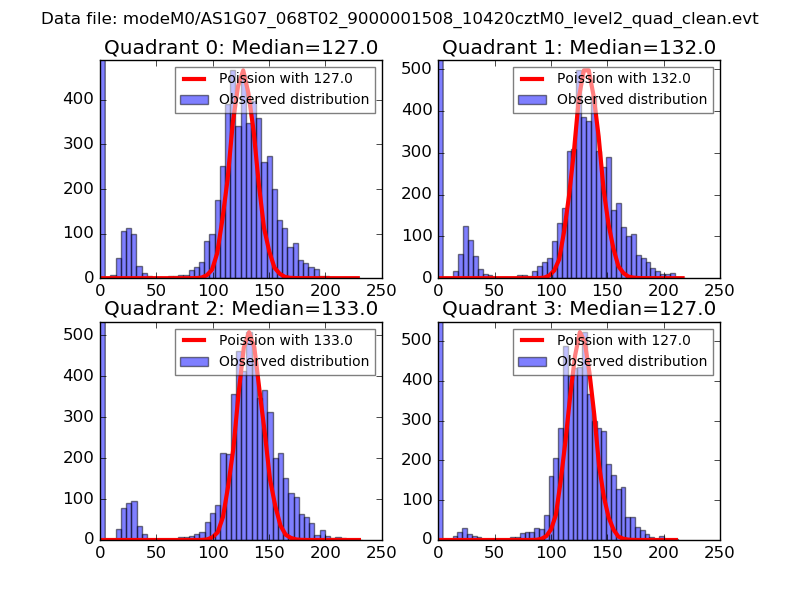
| Comparison with Poisson distribution Blue bars denote a histogram of data divided into 1 sec bins. Red curve is a Poisson curve with rate = median count rate of data. |
 |
 |
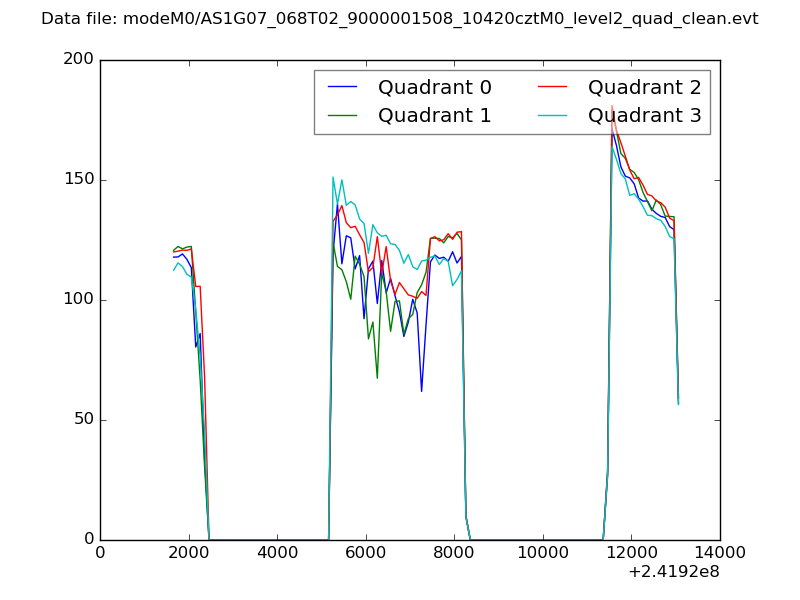
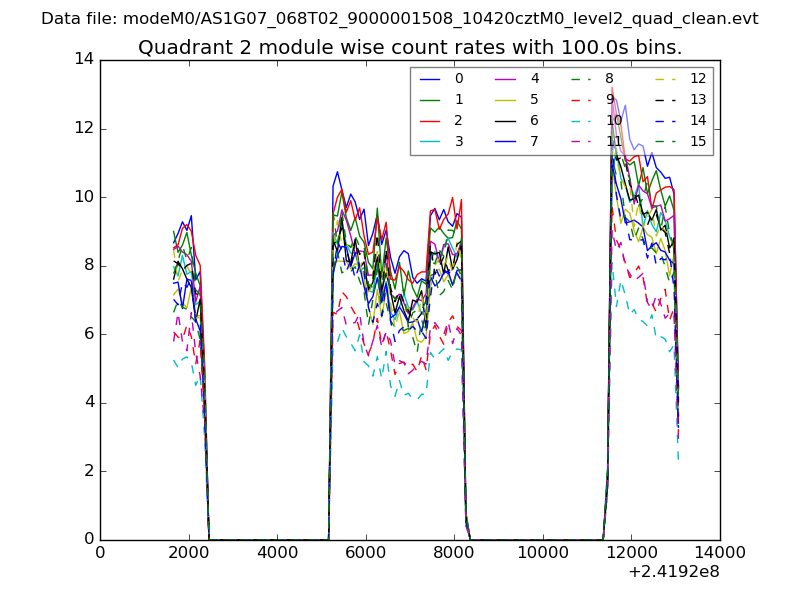
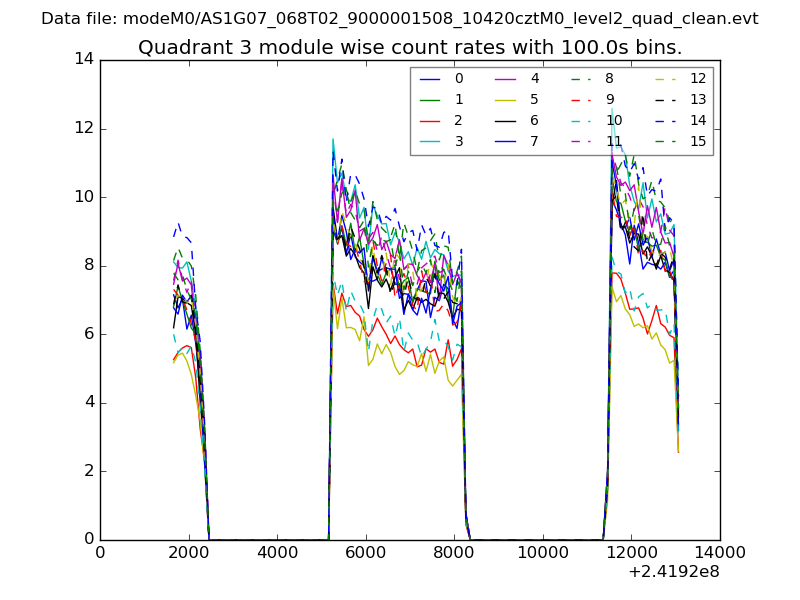
| Quadrant-wise count rates Data is divided into 100 sec bins |
 |
|
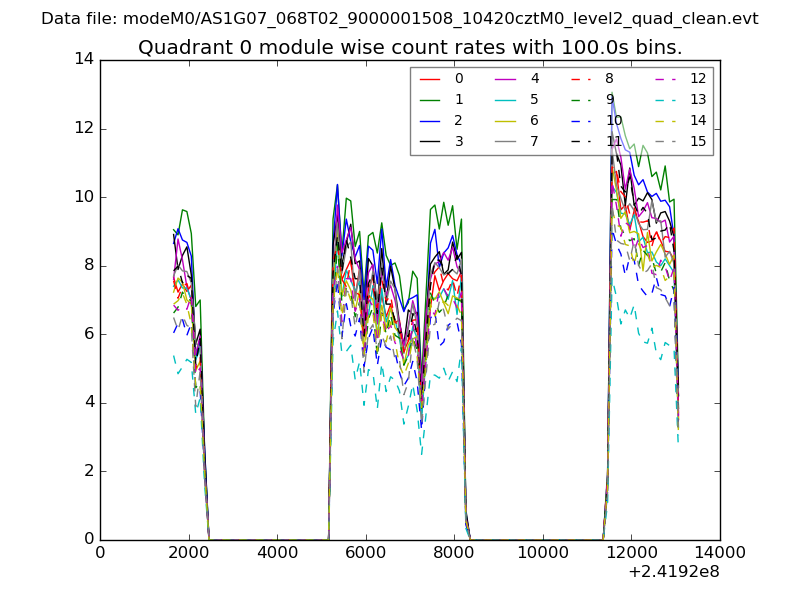
| Module-wise count rates for Quadrant A Data is divided into 100 sec bins |
 |
 |
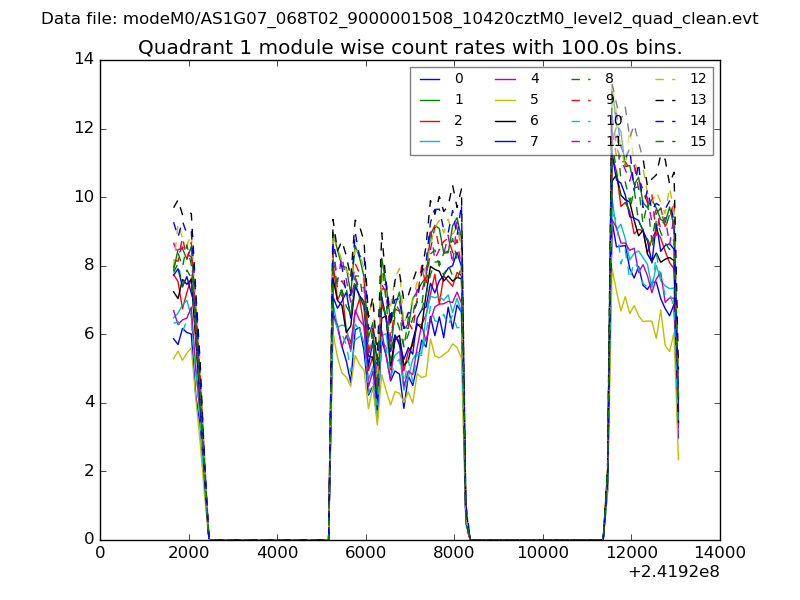
| Module-wise count rates for Quadrant B Data is divided into 100 sec bins |
 |
 |
| Module-wise count rates for Quadrant C Data is divided into 100 sec bins |
 |
 |
| Module-wise count rates for Quadrant D Data is divided into 100 sec bins |
 |
 |
| Parameter | Plot |
|---|---|
| CZT HV Monitor | 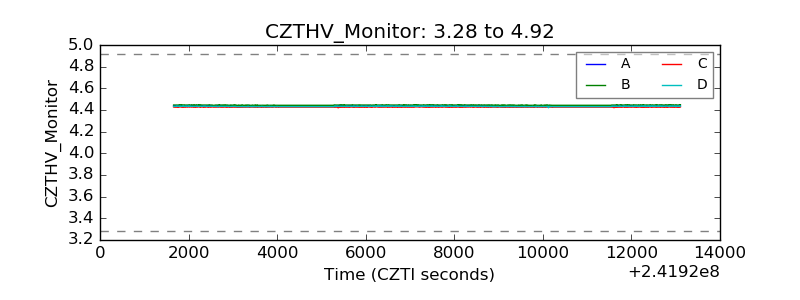 |
| D_VDD | 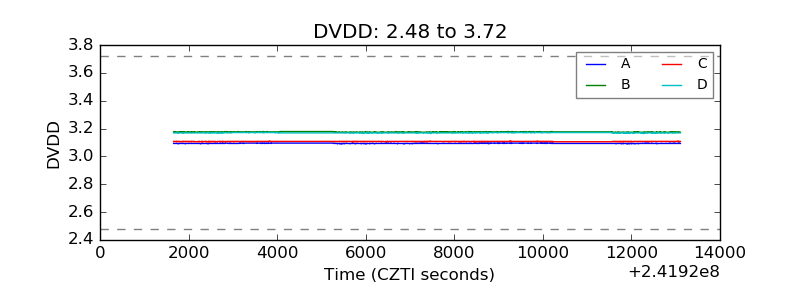 |
| Temperature 1 | 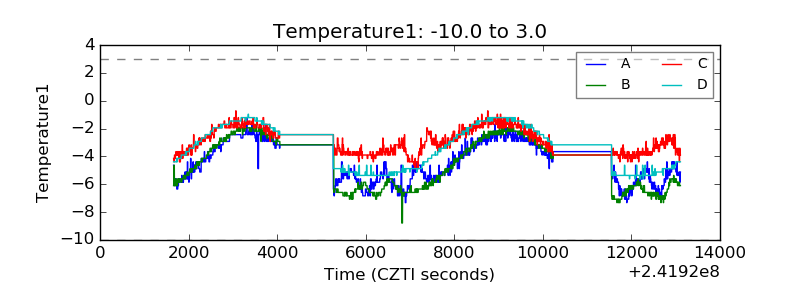 |
| Veto HV Monitor | 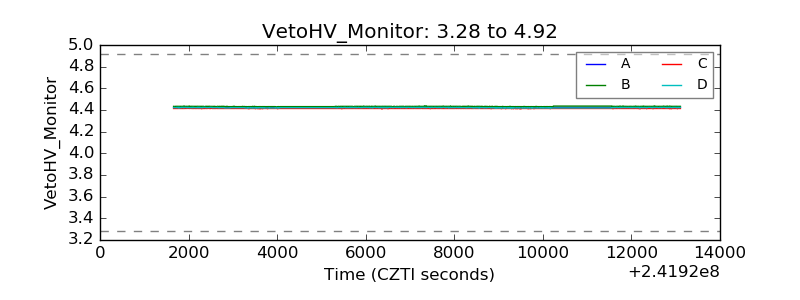 |
| Veto LLD | 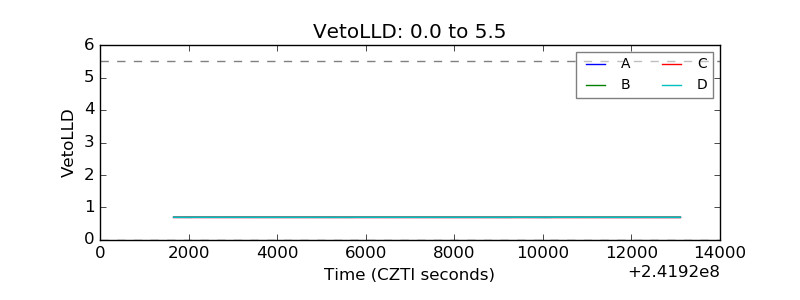 |
| Alpha Counter | 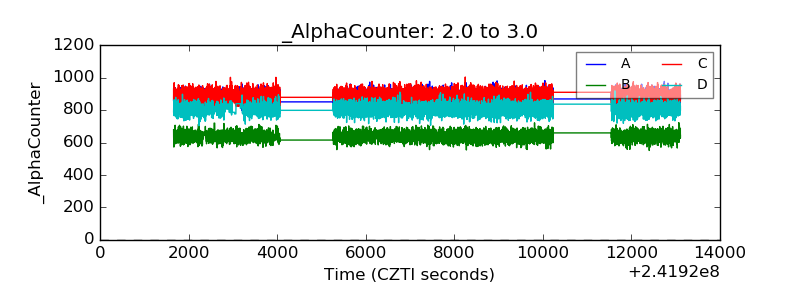 |
| _CPM_Rate | 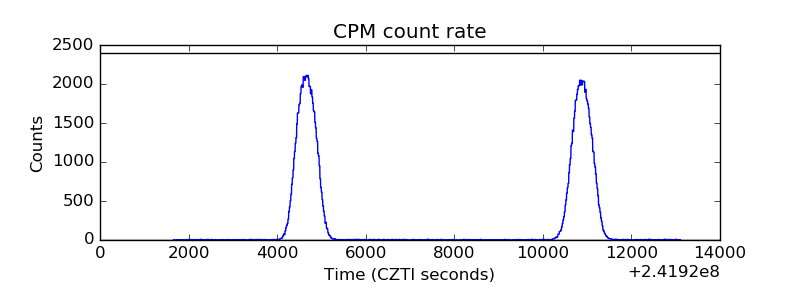 |
| CZT Counter | 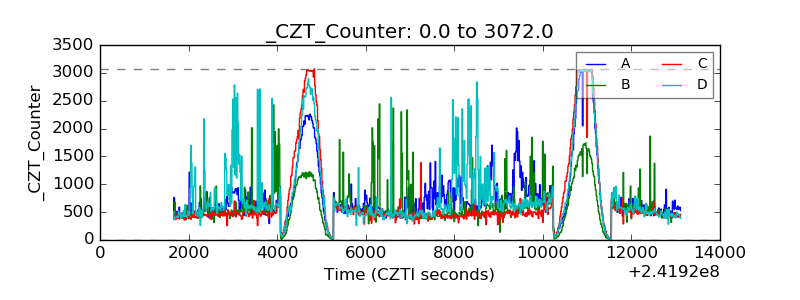 |
| +2.5 Volts monitor |  |
| +5 Volts monitor | 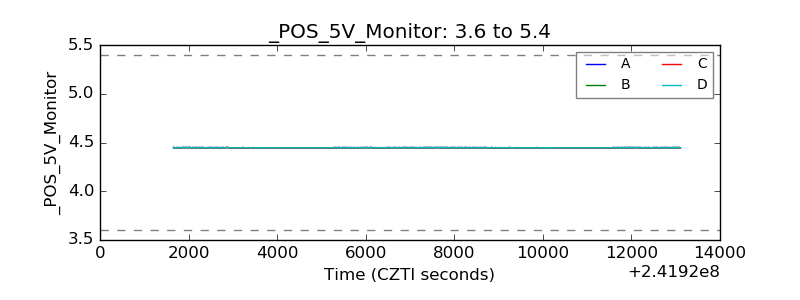 |
| _ROLL_ROT | 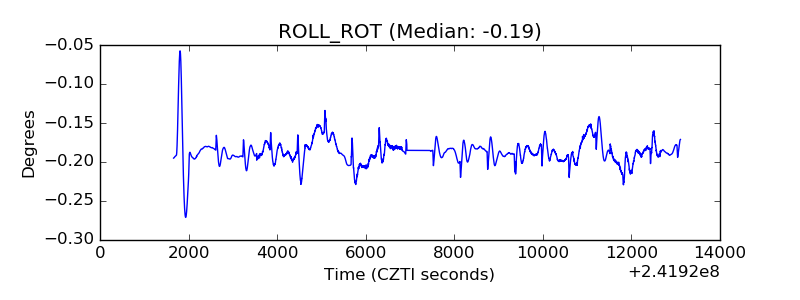 |
| _Roll_DEC | 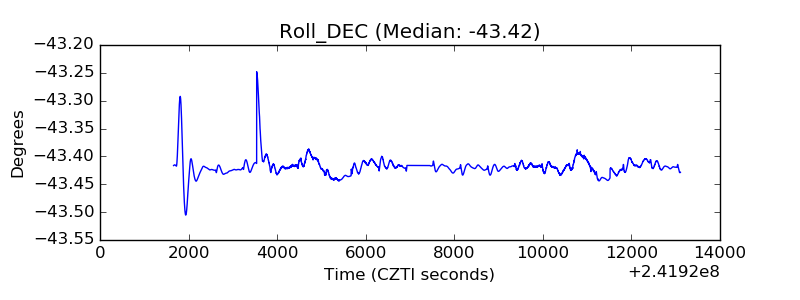 |
| _Roll_RA | 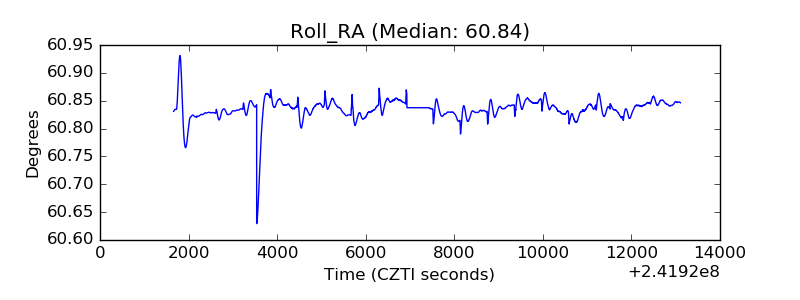 |
| Veto Counter | 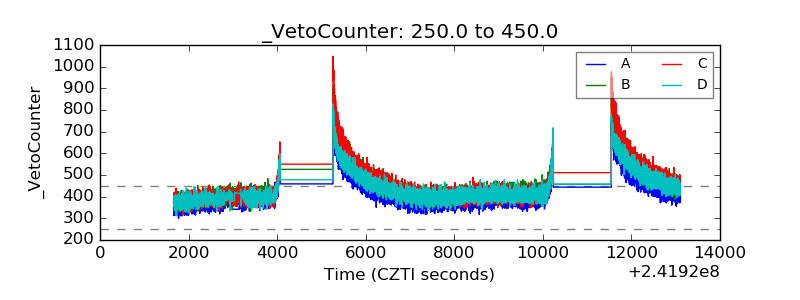 |